| Exhibit 99.2 |
Investor PresentationMay 2023 NYSE: AESI

Forward-Looking Statements This presentation contains “forward-looking
statements” of Atlas Energy Solutions Inc. (“Atlas,” the “Company,” “AESI,” “we,” “us” or “our”) within the meaning of Section 27A of the Securities Act of 1933, as amended, and Section 21E of the Securities Exchange Act of 1934, as amended.
Statements that are predictive or prospective in nature, that depend upon or refer to future events or conditions or that include the words “may,” “assume,” “forecast,” “position,” “strategy,” “potential,” “continue,” “could,” “will,” “plan,”
“project,” “budget,” “predict,” “pursue,” “target,” “seek,” “objective,” “believe,” “expect,” “anticipate,” “intend,” “estimate,” and other expressions that are predictions of or indicate future events and trends and that do not relate to
historical matters identify forward-looking statements. Our forward-looking statements include statements about our business strategy, industry, future operations and profitability, expected capital expenditures and the impact of such
expenditures on our performance, financial position, production, revenues and losses, our capital programs, management changes, current and potential future long-term contracts and our future business and financial performance. Although
forward-looking statements reflect our good faith beliefs at the time they are made, we caution you that these forward-looking statements are subject to a number of risks and uncertainties, most of which are difficult to predict and many of
which are beyond our control. These risks include, but are not limited to, commodity price volatility stemming from the continued impacts of COVID-19, including any new strains or variants, the ongoing war in Ukraine, adverse developments
affecting the financial services industry, our ability to complete growth projects, including the Dune Express, on time and on budget, actions of OPEC+ to set and maintain oil production levels, the level of production of crude oil, natural
gas and other hydrocarbons and the resultant market prices of crude oil, inflation, environmental risks, operating risks, regulatory changes, lack of demand, market share growth, the uncertainty inherent in projecting future rates of
reserves, production, cash flow, access to capital, the timing of development expenditures and other factors discussed under the heading “Risk Factors” in our Registration Statement on Form S-1 filed with the U.S. Securities and Exchange
Commission (“SEC”) on January 31, 2023 (as later amended) in connection with our initial public offering (our “IPO”) or any of our other filings with the SEC. You are cautioned not to place undue reliance on any forward-looking statements,
which speak only as of the date of this presentation. Should one or more of these risks or uncertainties occur, or should underlying assumptions prove incorrect, our actual results and plans could differ materially from those expressed in any
forward-looking statements. All forward-looking statements, expressed or implied, are expressly qualified in their entirety by this cautionary statement. This cautionary statement should also be considered in connection with any subsequent
written or oral forward-looking statements that we or persons acting on our behalf may issue. Except as otherwise required by applicable law, we disclaim any duty and do not intend to update any forward-looking statements to reflect events or
circumstances after the date of this presentation. Adjusted EBITDA, Adjusted EBITDA Margin, Adjusted Free Cash Flow, Adjusted Free Cash Flow Margin Adjusted Free Cash Flow Conversion and Maintenance Capital Expenditures are non-GAAP
supplemental financial measures are used by our management and by external users of our financial statements such as investors, research analysts and others, in the case of Adjusted EBITDA, to assess our operating performance on a consistent
basis across periods by removing the effects of development activities, provide views on capital resources available to organically fund growth projects and, in the case of Adjusted Free Cash Flow, to assess the financial performance of our
assets and their ability to sustain dividends over the long term without regard to financing methods, capital structure, levels of reinvestment or historical cost basis. These measures do not represent and should not be considered
alternatives to, or more meaningful than, net income, income from operations, net cash provided by operating activities or any other measure of financial performance presented in accordance with GAAP as measures of our financial performance.
Adjusted EBITDA and Adjusted Free Cash Flow have important limitations as analytical tools because they exclude some but not all items that affect net income, the most directly comparable GAAP financial measure. Our computation of Adjusted
EBITDA, Adjusted EBITDA Margin, Adjusted Free Cash Flow, Adjusted Free Cash Flow Margin, Adjusted Free Cash Flow Conversion and Maintenance Capital Expenditures may differ from computations of similarly titled measures of other companies.
We define Adjusted EBITDA as net income (loss) before depreciation, depletion and accretion, interest expense, income tax expense, stock and unit-based compensation, gain (loss) on extinguishment of debt and unrealized commodity derivative
gain (loss).We define Adjusted EBITDA Margin as Adjusted EBITDA divided by total sales. We define Adjusted Free Cash Flow as Adjusted EBITDA less Maintenance Capital Expenditures. We define Maintenance Capital Expenditures as capital
expenditures less growth capital expenditures. We define Adjusted Free Cash Flow Margin as Adjusted Free Cash Flow divided by total sales. We define Adjusted Free Cash Flow Conversion as Adjusted Free Cash Flow divided by Adjusted
EBITDA. Reserves This Presentation includes frac sand reserve and resource estimates based on engineering, economic and geological data assembled and analyzed by our mining engineers, which are reviewed periodically by outside firms.
However, frac sand reserve estimates are by nature imprecise and depend to some extent on statistical inferences drawn from available drilling data, which may prove unreliable. There are numerous uncertainties inherent in estimating
quantities and qualities of frac sand reserves and non-reserve frac sand deposits and costs to mine recoverable reserves, many of which are beyond our control and any of which could cause actual results to differ materially from our
expectations. These uncertainties include: geological and mining conditions that may not be fully identified by available data or that may differ from experience; assumptions regarding the effectiveness of our mining, quality control and
training programs; assumptions concerning future prices of frac sand, operating costs, mining technology improvements, development costs and reclamation costs; and assumptions concerning future effects of regulation, including the issuance of
required permits and taxes by governmental agencies. Trademarks and Trade Names The Company owns or has rights to various trademarks, service marks and trade names that it uses in connection with the operation of its business. This
presentation also contains trademarks, service marks and trade names of third parties, which are the property of their respective owners. The use or display of third parties’ trademarks, service marks, trade names or products in this
presentation is not intended to, and does not imply, a relationship with the Company, or an endorsement or sponsorship by or of the Company. Solely for convenience, the trademarks, service marks and trade names referred to in this
presentation may appear without the ®, TM or SM symbols, but such references are not intended to indicate, in any way, that the Company will not assert, to the fullest extent under applicable law, its rights or the right of the applicable
licensor to these trademarks, service marks and trade names. Industry and Market Data This presentation has been prepared by the Company and includes market data and certain other statistical information from third-party sources, including
independent industry publications, government publications, and other published independent sources. Although we believe these third-party sources are reliable as of their respective dates, we have not independently verified the accuracy or
completeness of this information. Some data is also based on our good faith estimates, which are derived from our review of internal sources as well as the third-party sources described above. The industry in which we operate is subject to a
high degree of uncertainty and risk due to a variety of factors. These and other factors could cause results to differ materially from those expressed in these third-party publications. Additionally, descriptions herein of market conditions
and opportunities are presented for informational purposes only; there can be no assurance that such conditions will actually occur. Please also see “Forward-Looking Statements” disclaimer above. 2 Important Disclosures
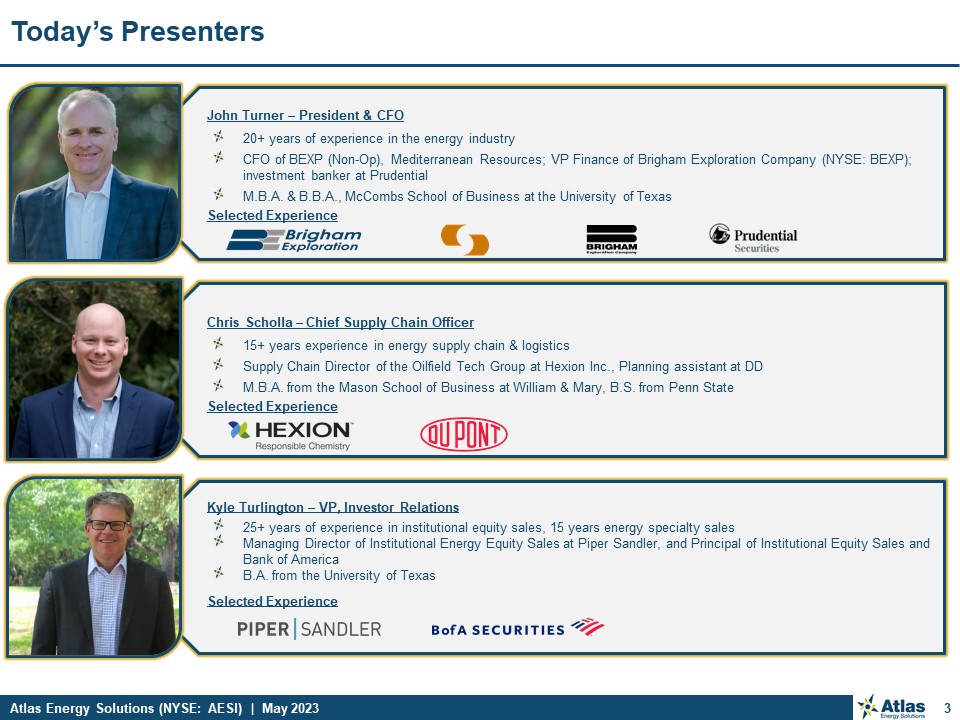
3 Today’s Presenters John Turner – President & CFO 20+ years of
experience in the energy industry CFO of BEXP (Non-Op), Mediterranean Resources; VP Finance of Brigham Exploration Company (NYSE: BEXP); investment banker at Prudential M.B.A. & B.B.A., McCombs School of Business at the University of
Texas Selected Experience Chris Scholla – Chief Supply Chain Officer 15+ years experience in energy supply chain & logistics Supply Chain Director of the Oilfield Tech Group at Hexion Inc., Planning assistant at DD M.B.A. from the
Mason School of Business at William & Mary, B.S. from Penn State Selected Experience Kyle Turlington – VP, Investor Relations 25+ years of experience in institutional equity sales, 15 years energy specialty sales Managing Director of
Institutional Energy Equity Sales at Piper Sandler, and Principal of Institutional Equity Sales and Bank of America B.A. from the University of Texas Selected Experience
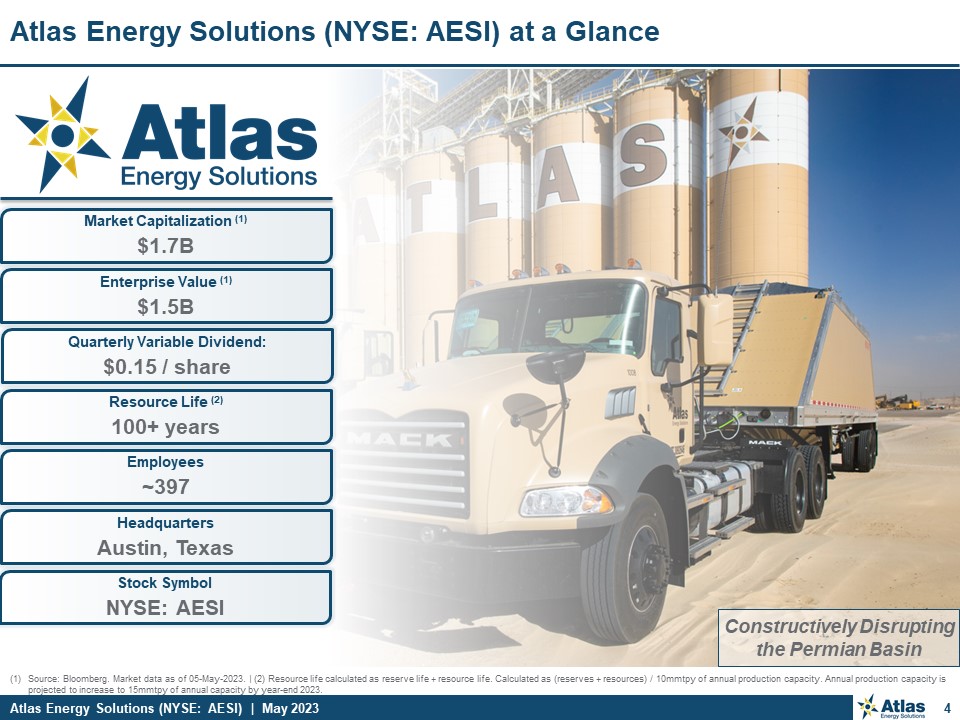
Source: Bloomberg. Market data as of 05-May-2023. | (2) Resource life calculated
as reserve life + resource life. Calculated as (reserves + resources) / 10mmtpy of annual production capacity. Annual production capacity is projected to increase to 15mmtpy of annual capacity by year-end 2023. 4 Atlas Energy Solutions
(NYSE: AESI) at a Glance Market Capitalization (1) $1.7B Enterprise Value (1) $1.5B Headquarters Austin, Texas Resource Life (2) 100+ years Stock Symbol NYSE: AESI Constructively Disrupting the Permian Basin Quarterly Variable
Dividend: $0.15 / share Employees ~397

On-time & On-budget Planned in-service Q4 2023 Permian Sand
Market Market pricing remains attractive with robust activity levels and growing demand Operators are signaling capex growth even at oil prices lower than today’s levels Permian is insulated from natural gas price weakness, 12-month WTI
Strip is ~$70 (2) Frac crews migrating from gas plays have potential to add to Permian sand demand Permian Sand Market Adj. EBITDA (1) $84mm ~55% margin Non-GAAP financial measure. See Appendix for reconciliations of non-GAAP measures to
the nearest GAAP measures. | (2) Bloomberg as of 05-May-2023. 5 Atlas Energy Solutions Q1 2023 Update Sales $153mm ~2.8mm tons Adj. FCF (1) $77mm ~50% margin Net Income $63mm ~41% margin Cash from Ops $54mm ~129% growth
y/y Dune Express Have ordered >50% of equipment, 40% of installation / services Have cleared ~15 miles of the right of way and laid down 15 acres of caliche Expected commercial in-service Q4 2024 Dune Express
Update Logistics Business is ramping up, showing early success Have achieved payloads >70 tons per truck (vs. market standard ~23 tons) Deliveries have progressed on-time and on-budget Logistics Update Kermit Expansion Silos
currently going up

Company Overview / Introduction
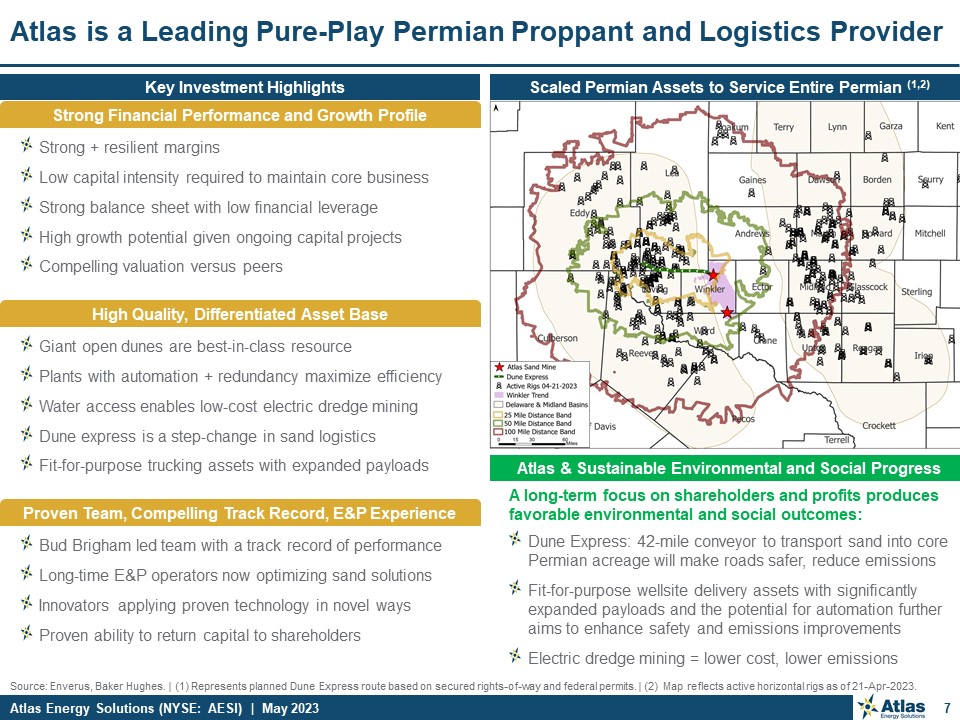
Source: Enverus, Baker Hughes. | (1) Represents planned Dune Express route based
on secured rights-of-way and federal permits. | (2) Map reflects active horizontal rigs as of 21-Apr-2023. 7 Atlas is a Leading Pure-Play Permian Proppant and Logistics Provider Scaled Permian Assets to Service Entire Permian (1,2) Key
Investment Highlights Atlas & Sustainable Environmental and Social Progress A long-term focus on shareholders and profits produces favorable environmental and social outcomes: Dune Express: 42-mile conveyor to transport sand into core
Permian acreage will make roads safer, reduce emissions Fit-for-purpose wellsite delivery assets with significantly expanded payloads and the potential for automation further aims to enhance safety and emissions improvements Electric
dredge mining = lower cost, lower emissions Strong + resilient margins Low capital intensity required to maintain core business Strong balance sheet with low financial leverage High growth potential given ongoing capital
projects Compelling valuation versus peers Strong Financial Performance and Growth Profile High Quality, Differentiated Asset Base Giant open dunes are best-in-class resource Plants with automation + redundancy maximize efficiency Water
access enables low-cost electric dredge mining Dune express is a step-change in sand logistics Fit-for-purpose trucking assets with expanded payloads Proven Team, Compelling Track Record, E&P Experience Bud Brigham led team with a
track record of performance Long-time E&P operators now optimizing sand solutions Innovators applying proven technology in novel ways Proven ability to return capital to shareholders
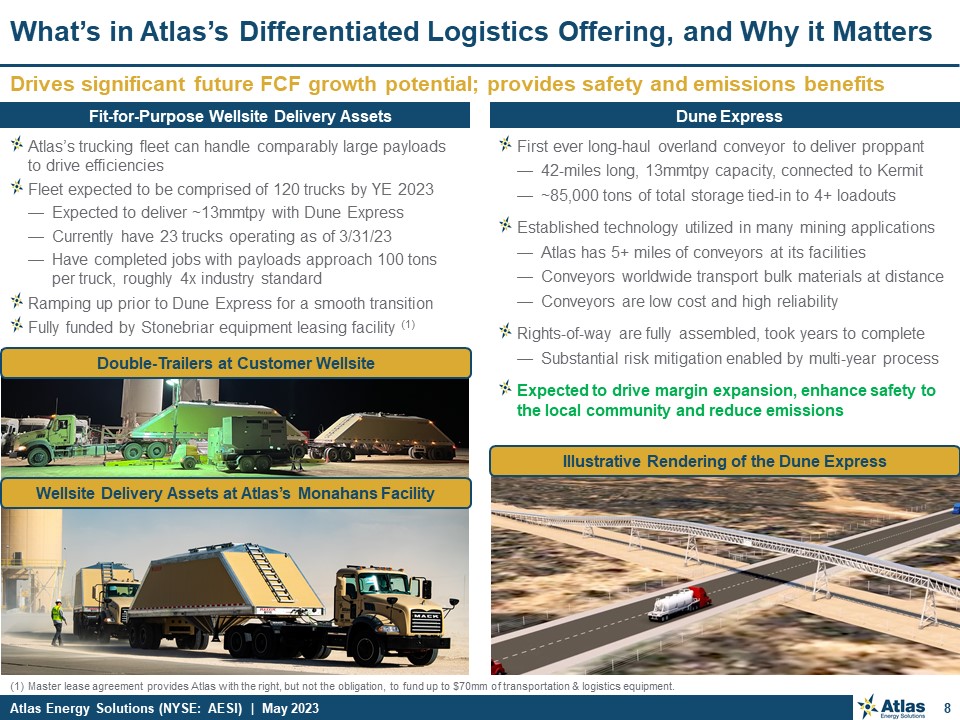
8 Drives significant future FCF growth potential; provides safety and emissions
benefits What’s in Atlas’s Differentiated Logistics Offering, and Why it Matters Dune Express Fit-for-Purpose Wellsite Delivery Assets Atlas’s trucking fleet can handle comparably large payloads to drive efficiencies Fleet expected to
be comprised of 120 trucks by YE 2023 Expected to deliver ~13mmtpy with Dune Express Currently have 23 trucks operating as of 3/31/23 Have completed jobs with payloads approach 100 tons per truck, roughly 4x industry standard Ramping up
prior to Dune Express for a smooth transition Fully funded by Stonebriar equipment leasing facility (1) Wellsite Delivery Assets at Atlas’s Monahans Facility Double-Trailers at Customer Wellsite Master lease agreement provides Atlas with
the right, but not the obligation, to fund up to $70mm of transportation & logistics equipment. Illustrative Rendering of the Dune Express First ever long-haul overland conveyor to deliver proppant 42-miles long, 13mmtpy capacity,
connected to Kermit ~85,000 tons of total storage tied-in to 4+ loadouts Established technology utilized in many mining applications Atlas has 5+ miles of conveyors at its facilities Conveyors worldwide transport bulk materials at
distance Conveyors are low cost and high reliability Rights-of-way are fully assembled, took years to complete Substantial risk mitigation enabled by multi-year process Expected to drive margin expansion, enhance safety to the local
community and reduce emissions

Source: Lium, Rystad, management estimates. | (1) Lium Local Sand Plants –
Permian 1Q23. Estimated Permian Production capacity assumes competitor mines operate at 70% of nameplate capacity. Includes the addition of incremental nameplate capacity presently under construction. | (2) Lium and Rystad proppant demand
estimates for 23E and 24E. In response to the significant increase in market demand for Atlas proppant, and in connection with the expansion of our logistics offering, we are expanding our Kermit production capacity by 100% Provides
incremental production capacity of 5.0mmtpy for pro forma production capacity of 15.0mmtpy Significantly increases Atlas’s size and scale Increased production capacity enables Atlas logistical optimization Expansion project is on-time
andon-budget In-service date of Q4 2023 9 Atlas is expanding it’s basin leading production capacity Kermit Expansion to Increase Company Production Capacity by 50% Atlas is Expanding it’s Differentiated Proppant Producing Leadership
(1) Kermit Facility Expansion will increase Atlas’s production capacity by ~50% Existing Production Capacity Capacity Under Construction Estimated Production Capacity (1,2) Estimated 12/31/23 Permian Production
Capacity 70.8mmtpy 77 71 84 76 2023E Demand 2024E Demand

Bakken Eagle Ford Permian Niobrara Anadarko Other 10 Permian is the #1
Oil Basin; Efficiencies Drive Growing Proppant Demand (1) Per Lium, Rystad, Baker Hughes and EIA. 2023E and 2024E frac fleet and proppant demand forecast based on Lium and Rystad guidance. | (2) Area chart represents production by basin and
line chart represents Permian’s share of the total U.S. rig count. | (3) Assumes 23.5 tons per truckload of proppant. | (4) Current nameplate capacity in the Permian Basin is approximately 74 million tons per year according to Rystad Energy
estimates. Rystad currently estimates a current utilization rate of 75% to 85%. Permian Frac Fleets & Proppant per Fleet per year (1) Average Permian Basin Proppant per Well (1) Permian Basin Proppant Demand (1) Permian Proppant
Demand (mmtpy) Permian as % of U.S. Total Estimates from Rystad and Lium Equivalent to ~3.2mm to ~3.6mm truckloads per year (3) Permian Proppant per Well (tons) Equivalent Truckloads of Proppant (3) Permian Basin Production & Rig
Count (1,2) The Permian Basin is Driving U.S. Shale Production Permian Frac Fleets Proppant per Frac Fleet (k tons) Estimates from Rystad and Lium Simul-Frac Fleets Can Use >1mmtpy 1Q ‘23 Permian Proppant Production Capacity =
~60mmtpy (4) 77 84 131 113

Key Investment Highlights
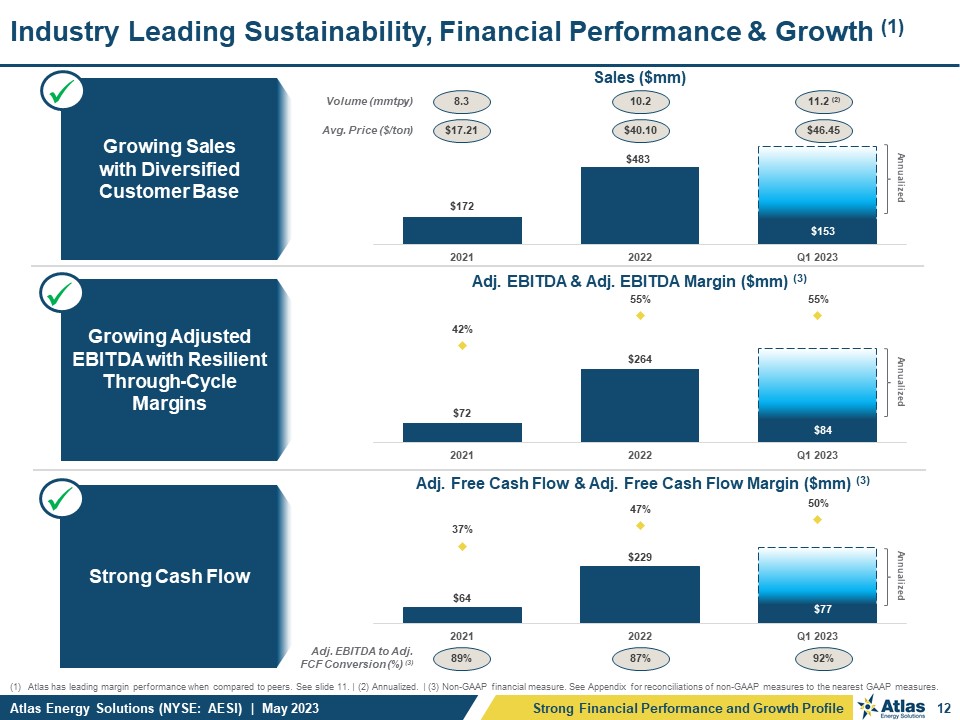
Atlas has leading margin performance when compared to peers. See slide 11. | (2)
Annualized. | (3) Non-GAAP financial measure. See Appendix for reconciliations of non-GAAP measures to the nearest GAAP measures. 12 Industry Leading Sustainability, Financial Performance & Growth (1) Growing Sales with Diversified
Customer Base Growing Adjusted EBITDA with Resilient Through-Cycle Margins Strong Cash Flow Adj. EBITDA to Adj. FCF Conversion (%) (3) 89% 87% 92% Sales ($mm) Adj. EBITDA & Adj. EBITDA Margin ($mm) (3) Adj. Free Cash Flow
& Adj. Free Cash Flow Margin ($mm) (3) Volume (mmtpy) 8.3 10.2 11.2 (2) Avg. Price ($/ton) $17.21 $40.10 $46.45 Strong Financial Performance and Growth Profile Annualized Annualized Annualized

Source: Public Filings, Bloomberg Consensus data as of 05-May-2023. | Big Three
Oilfield Services: SLB, BHI and HAL. | Equipment & Infra.: NOV, FTI, WHD and OII. | Chemical / Water / Proppant: CHX, SES, SOI, ARIS and SLCA. | Production & Field Services: USAC, AROC, XPRO, HLX and CLB. | Midstream: KMI, WMB, OKE,
TRGP, MMP, WES, ENLC and ETRN. 13 Atlas aims to deliver returns through a combination of growth and income Exceptional Margins & Growth that Merit Multiple Expansion Strong Financial Performance and Growth Profile Atlas Trades at a
Discount to Peers while Wall Street Consensus Margins and Growth Outperform
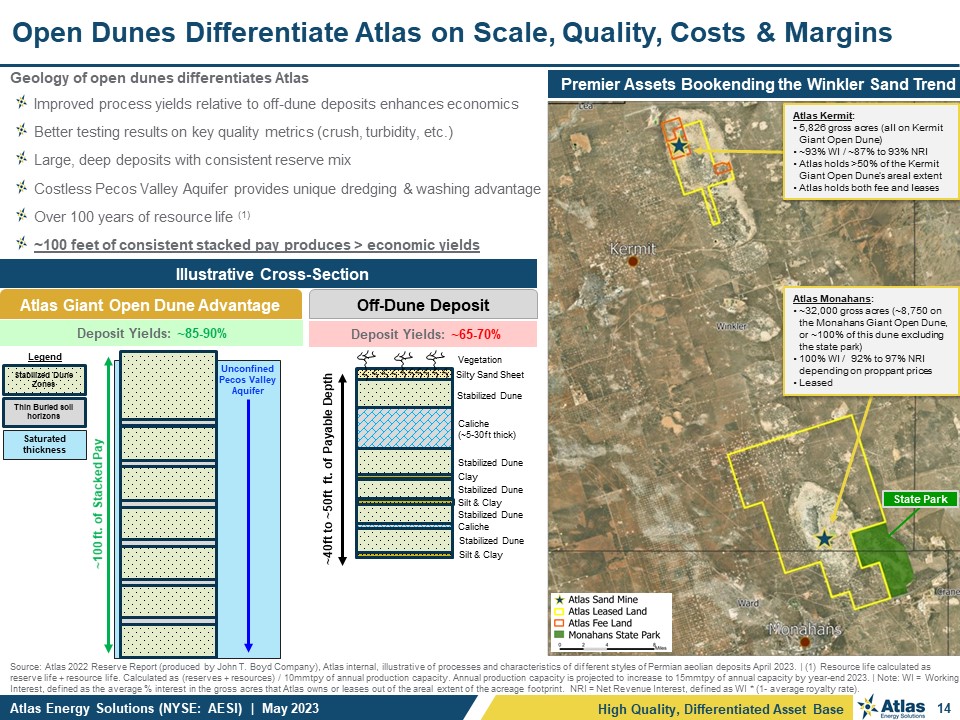
14 Geology of open dunes differentiates Atlas Improved process yields relative
to off-dune deposits enhances economics Better testing results on key quality metrics (crush, turbidity, etc.) Large, deep deposits with consistent reserve mix Costless Pecos Valley Aquifer provides unique dredging & washing
advantage Over 100 years of resource life (1) ~100 feet of consistent stacked pay produces > economic yields Open Dunes Differentiate Atlas on Scale, Quality, Costs & Margins Source: Atlas 2022 Reserve Report (produced by John T.
Boyd Company), Atlas internal, illustrative of processes and characteristics of different styles of Permian aeolian deposits April 2023. | (1) Resource life calculated as reserve life + resource life. Calculated as (reserves + resources) /
10mmtpy of annual production capacity. Annual production capacity is projected to increase to 15mmtpy of annual capacity by year-end 2023. | Note: WI = Working Interest, defined as the average % interest in the gross acres that Atlas owns or
leases out of the areal extent of the acreage footprint. NRI = Net Revenue Interest, defined as WI * (1- average royalty rate). Premier Assets Bookending the Winkler Sand Trend Atlas Kermit: 5,826 gross acres (all on Kermit Giant Open
Dune) ~93% WI / ~87% to 93% NRI Atlas holds >50% of the Kermit Giant Open Dune’s areal extent Atlas holds both fee and leases Atlas Monahans: ~32,000 gross acres (~8,750 on the Monahans Giant Open Dune, or ~100% of this dune
excluding the state park) 100% WI / 92% to 97% NRI depending on proppant prices Leased State Park High Quality, Differentiated Asset Base Illustrative Cross-Section UnconfinedPecos ValleyAquifer ~100 ft. of Stacked Pay Deposit Yields:
~85-90% Deposit Yields: ~65-70% Atlas Giant Open Dune Advantage Off-Dune Deposit Legend Thin Buried soil horizons Saturated thickness Stabilized Dune Zones Caliche (~5-30ft thick) Clay Caliche Silt & Clay Silty Sand
Sheet Stabilized Dune ~40ft to ~50ft ft. of Payable Depth Vegetation Silt & Clay Stabilized Dune Stabilized Dune Stabilized Dune Stabilized Dune
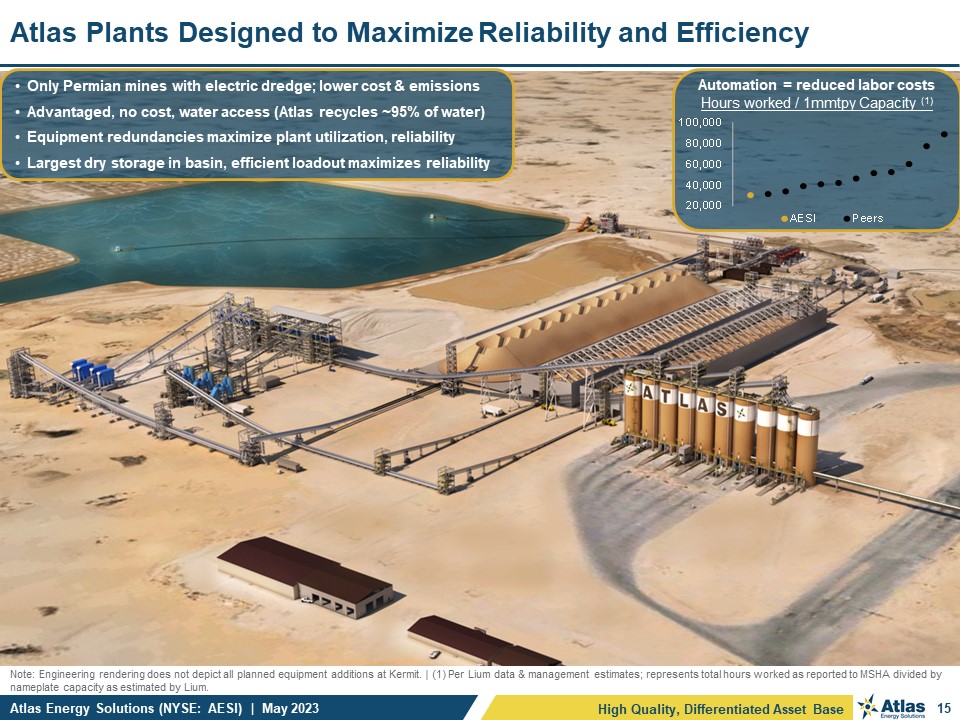
15 Atlas Plants Designed to Maximize Reliability and Efficiency High Quality,
Differentiated Asset Base Only Permian mines with electric dredge; lower cost & emissions Advantaged, no cost, water access (Atlas recycles ~95% of water) Equipment redundancies maximize plant utilization, reliability Largest dry
storage in basin, efficient loadout maximizes reliability Automation = reduced labor costs Hours worked / 1mmtpy Capacity (1) Note: Engineering rendering does not depict all planned equipment additions at Kermit. | (1) Per Lium data &
management estimates; represents total hours worked as reported to MSHA divided by nameplate capacity as estimated by Lium.

Daily Proppant Delivery Capacity per Truck (Dune Express) 16 Atlas Expects to
Deliver Significant Logistics Efficiency Gains Daily Proppant Delivery Capacity per Truck (Current) Source: Enverus, Management analysis and estimates. | (1) Represents planned Dune Express route based on secured rights-of-way and federal
permits. | (2) Estimates represent anticipated reductions over a 30-year period; Management’s internal analysis, based on results of study completed by Texas A&M Transportation Institute. | (3) Emissions includes CO2, CH4, N2O, PM10 +
PM2.5 particulates and is calculated on a CO2e basis. Represents anticipated emissions reductions over a 30-year period. High Quality, Differentiated Asset Base Today, a truck can deliver only ~125 to ~150 tons to this point in a day, ~95%
of which is on commercial roads With the Dune Express, a truck can deliver up to 500 tons a day to this same point, none of which impacts the commercial roads and the communities! (1) Expected Reduction in Mileage Driven (2) Expected
Reduction in Traffic Accident & Fatality Rate (2) Expected Reduction in Emissions (2, 3) …all while driving up throughput per truck per day 3x – 10x+ ~70% Operational Efficiency Gains Driving Huge Safety + Emissions Benefits
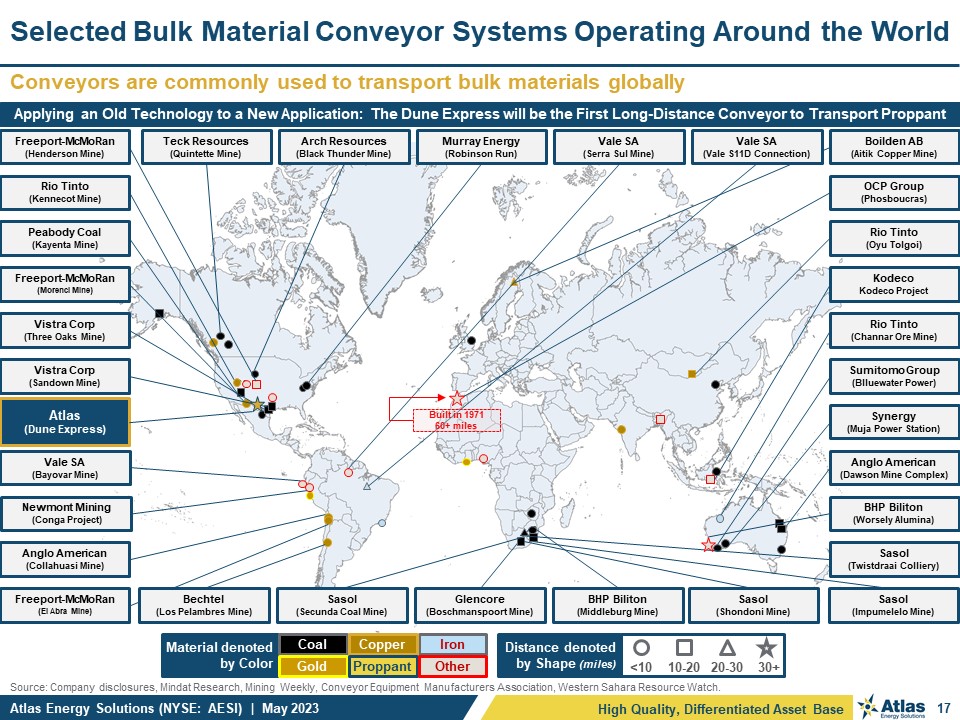
Source: Company disclosures, Mindat Research, Mining Weekly, Conveyor Equipment
Manufacturers Association, Western Sahara Resource Watch. 17 Conveyors are commonly used to transport bulk materials globally Selected Bulk Material Conveyor Systems Operating Around the World High Quality, Differentiated Asset Base OCP
Group (Phosboucras) <10 10-20 20-30 30+ Distance denoted by Shape (miles) Material denoted by Color Coal Gold Iron Copper Proppant Other Applying an Old Technology to a New Application: The Dune Express will be the First
Long-Distance Conveyor to Transport Proppant Anglo American (Collahuasi Mine) BHP Biliton (Worsely Alumina) Freeport-McMoRan (Morenci Mine) Kodeco Kodeco Project Vistra Corp (Three Oaks Mine) Vistra Corp (Sandown
Mine) Freeport-McMoRan (Henderson Mine) Boilden AB (Aitik Copper Mine) Sumitomo Group (Blluewater Power) Rio Tinto (Oyu Tolgoi) Rio Tinto (Channar Ore Mine) Rio Tinto (Kennecot Mine) Peabody Coal (Kayenta
Mine) Freeport-McMoRan (El Abra Mine) Sasol (Shondoni Mine) Sasol (Secunda Coal Mine) Sasol (Impumelelo Mine) Sasol (Twistdraai Colliery) Vale SA (Bayovar Mine) Vale SA (Serra Sul Mine) BHP Biliton (Middleburg Mine) Arch
Resources (Black Thunder Mine) Glencore (Boschmanspoort Mine) Atlas (Dune Express) Newmont Mining (Conga Project) Murray Energy (Robinson Run) Teck Resources (Quintette Mine) Synergy (Muja Power Station) Anglo American (Dawson
Mine Complex) Bechtel (Los Pelambres Mine) Vale SA (Vale S11D Connection) Built in 1971 60+ miles

18 Atlas General Contractor Approach & Experience Controls Costs and
Ensures Timelines Dune Express is years in the making: Numerous project studies & surveys completed Detailed engineering plans laid out Key vendor relationships developed Right of way acquired All material permits, including key
state & federal permits obtained Anchor contracts signed Required capital raised through IPO Atlas Major Construction Projects since 2017 (1) Monahans Facility Kermit Facility Kermit Expansion Dune Express (1) In addition, Atlas
has overseen a number of maintenance capital projects since 2017. Proven Team, Compelling Track Record, E&P Experience Dune Express is off and running: Procurement: Have ordered >50% of equipment + materials, >40% of
installation / labor services Procurement: Orders are largely contracted, providing budget visibility Construction: 15 miles of conveyor corridor cleared Construction: 5 miles of conveyor corridor graded Construction: 15 acres of caliche
pads constructed for overhead crossings, transfer stations, laydown yards, etc. Atlas is well positioned for success: Hired top-tier engineering firms Atlas has a highly experienced construction team As our own general contractor, Atlas
has increased control over the project Kermit expansion provides real-time insight into market trends Acquisition of right of way was one of the project’s greatest challenges Atlas has constructed >5 miles of conveyors in our sand
facilities Dune Express Update: Q4 2024 expected commercial in-service

19 Note: Past performance by members of our management team, our directors or
their respective affiliates may not be indicative of future performance. | Source: Bloomberg, public disclosures. | (1) Total return calculated as cumulative dividends plus stock price appreciation (IPO date through 28-Dec-2022 and includes
the reinvestment of dividends and is pro forma for Sitio merger). | (2) Non-GAAP financial measure. See Appendix for reconciliations of non-GAAP measures to the nearest GAAP measures. Management’s E&P Background and Track Record of Value
Creation Disruptive Oil & Gas Ventures with Track Record of Success What We Observed Through an E&P Operator’s Lens The Permian is North America’s premier shale resource Proppant is mission-critical to efficient shale
development Logistics challenges are a barrier to optimization The sector was primed for positive disruption due to inefficiencies: Out-of-basin proppant not cost effective Plants not designed for just-in-time demand model Local roadways
overwhelmed by robust activity levels Need for high-quality, reliable and efficient in-basin sand Our Differentiated Approach to Transform the Market + SESP Focused on giant open dunes with unique geologic attributes Plentiful water,
quality product, high mining yields Plants designed with operator mindset; scaled for efficiency with multiple redundancies to minimize downtime Culture of technological innovation drives Atlas’s growth We have “walked the walk” on
sustainability, putting shareholders and corporate integrity first to drive Sustainable Environmental and Social Progress (“SESP”) Management’s E&P Background Drives Customer Success Pioneering Use of 3D Seismic, Disruption in
Horizontal D&C Techniques within the Oil-Rich Bakken Shale IPO in 1997 Sold to Statoil in 2011 for $4.7 billion Drilling & Completion Innovations in Delaware Basin; Early Adopter of E-Frac & Proppant Loading >5,000 lbs per
foot Sold to Diamondback Energy, Inc. in 2017 for $2.6 billion Technically Sophisticated Tier One Minerals Model IPO in 2019 Sitio Merger = $2.2 billion value to MNRL 145% total return from IPO to sale (1) Differentiated Permian
Pure-Play Proppant Producer with Game Changing Logistics Platform Q1 2023 Adj. EBITDA of $84.0 million (2) Q1 2023 Adj. EBITDA Margin of 55% (2) Proven Team, Compelling Track Record, E&P Experience

High Quality, Differentiated Asset Base with Unmatched Scale to Match Industry
Needs Proven Team, Compelling Track Record, E&P Experience Strong Financial Performance, Exceptional Margins & Growth Profile at an Attractive Valuation Foundation of Mission Critical Proppant with Transformative Logistics
Expanding to Enhance Permian Efficiencies 20 Atlas Energy Solutions (NYSE: AESI) Investment Highlights Illustrative Dune Express Highway Overpass Atlas Wellsite Delivery Asset Atlas conveyor fed silos at Kermit Facility
Appendix

22 Atlas’s Business is Inherently Different from Legacy Sand Providers Atlas
Advantage Underpinned by In-Basin + Just-in-Time Model Drives Efficiency + Profits Source: Union Pacific Calculator, Management’s internal analysis, based on results of study completed by Texas A&M Transportation Institute. | (1)
Emissions includes CO2, CH4, N2O, PM10 + PM2.5 particulates and is calculated on a CO2e basis. Represents anticipated emissions reductions over a 30-year period. | (2) Assumes a 50-mile reduction in miles driven one-way from mine to wellsite.
| (3) Illustrative average miles driven one-way from in-basin mine site to well site. Midwestern Sand Mines Midwestern Supply Chain: ~1,300+ miles, by train + truck In-Basin Supply Chain: ~25 – 150 mile by truck Dune Express Supply
Chain: ~0 – 65 mile by truck In-Basin (3) Atlas (3) Dune Express Midwestern The Dune Express is expected to take 55 million miles of sand truckloads off of public roadways, driving meaningful reductions in emissions, traffic accidents
and traffic fatalities in the region (2) Distance From Mine to Wellsite (miles) Associated Logistics Emissions (mm lbs CO2e)(1)

Reconciliation and Calculation ofNon-GAAP Financial Measurements
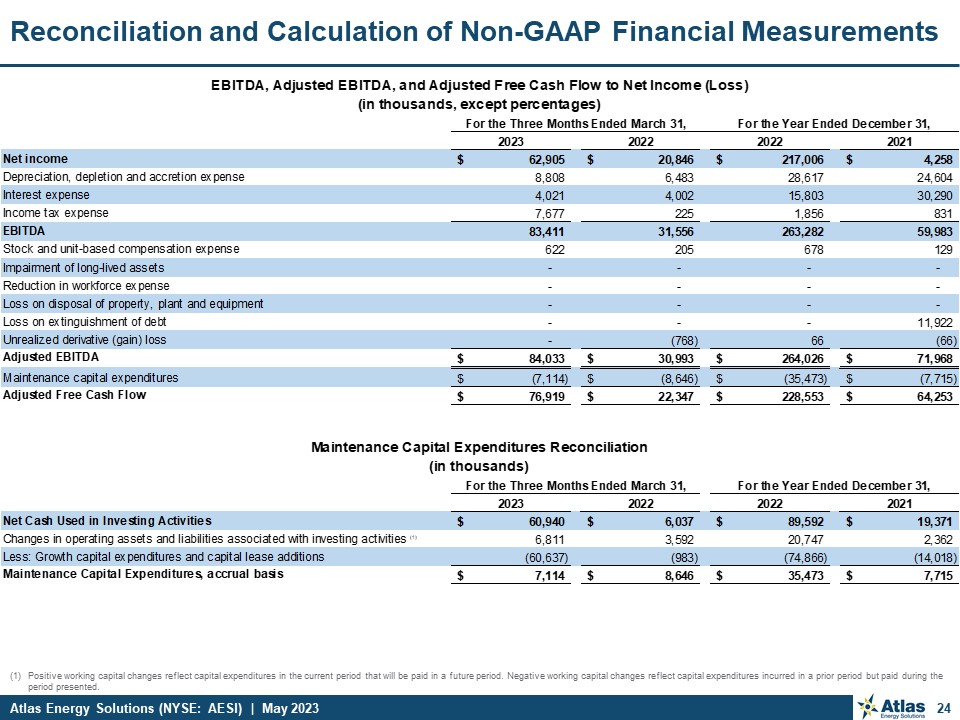
Positive working capital changes reflect capital expenditures in the current
period that will be paid in a future period. Negative working capital changes reflect capital expenditures incurred in a prior period but paid during the period presented. 24 Reconciliation and Calculation of Non-GAAP Financial
Measurements
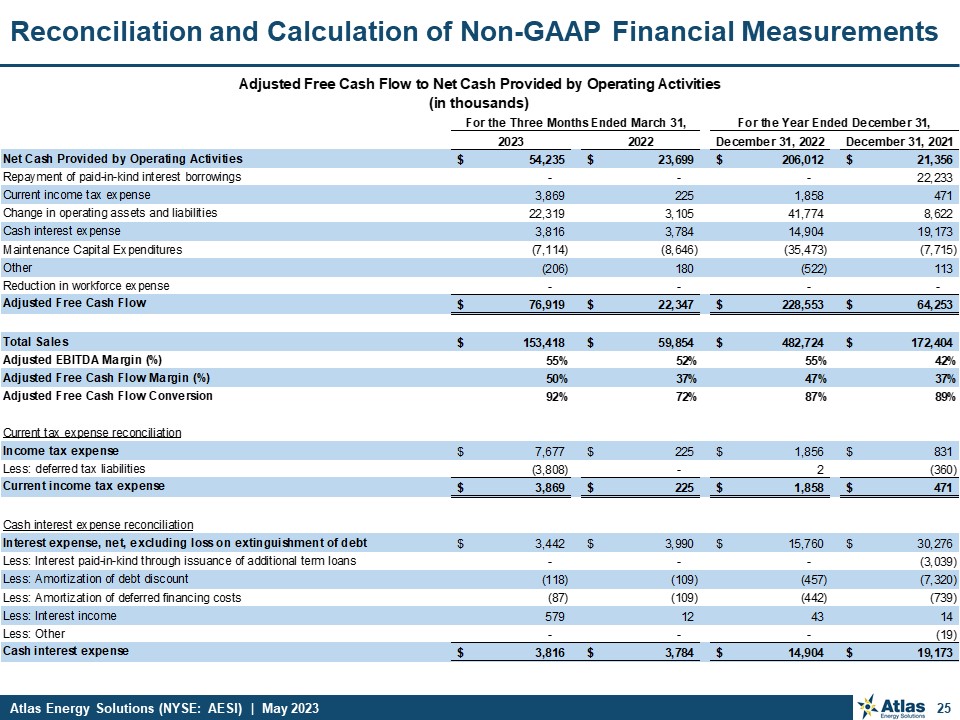
25 Reconciliation and Calculation of Non-GAAP Financial Measurements

Investor Relations Contact For more information, please visit our website at
https://atlas.energy/ IR Contact: Kyle Turlington 5918 W Courtyard Drive, Suite #500; Austin, Texas 78730 (T) 512-220-1200 IR@atlas.energy NYSE: AESI