Exhibit 99.1

TECHNICAL REPORT SUMMARY

FRAC SAND RESOURCES AND RESERVES

KERMIT AND MONAHANS MINES

Winkler and Ward Counties, Texas


At your request, we are providing a copy of a John T. Boyd Company (BOYD) professional work product in electronic format. Please be advised that the authorship and content of the material being provided is strictly privileged to BOYD and no change or revision to said work product is permitted. Any request for alteration to the material provided should be made to BOYD, who reserves the sole discretion to determine if and to what extent any change in our document will be made (by BOYD). Unauthorized change to or use of the information being provided voids any and all BOYD responsibility and/or liability associated with this work product and could result in legal action by BOYD regarding improper use of privileged information and/or deliberate misrepresentation.       

Prepared For

ATLAS ENERGY SOLUTIONS, INC

By

John T. Boyd Company

Mining and Geological Consultants

Pittsburgh, Pennsylvania, USA


LOGO

Report No. 3871.006

MAY 2022


LOGO  

John T. Boyd Company

Mining and Geological Consultants


Chairman    May 13, 2022
James W. Boyd    File: 3871.006
President and CEO   
John T. Boyd II   
Managing Director and COO    Atlas Energy Solutions, Inc
Ronald L. Lewis    5918 W. Courtyard Drive, #500


Vice Presidents

   Austin, TX 78730
Robert J. Farmer   
Matthew E. Robb    Attention:  Mr. John Turner
John L. Weiss                      Chief Financial Officer
Michael F. Wick   
William P. Wolf   
   Subject:    Technical Report Summary
Managing Director - Australia                     Frac Sand Resources and Reserves
George Cumplido   

                 Kermit and Monahans Mines


                 Winkler and Ward Counties, Texas

Managing Director - China   
Jisheng (Jason) Han   
Managing Director - South America    Dear Sirs:
Carlos F. Barrera   
Managing Director - Metals    This SK-1300-compliant technical report summary provides the results of John T. Boyd Company’s (BOYD) independent estimate of the frac sand (proppant) resources and reserves for Atlas Energy Solutions, Inc. (Atlas) Kermit and Monahans mines as of December 31, 2021.
Gregory B. Sparks


Assistant to the President

Mark P. Davic
Pittsburgh   
4000 Town Center Boulevard, Suite 300   

Canonsburg, PA 15317

(724) 873-4400

(724) 873-4401 Fax

jtboydp@jtboyd.com


Denver

(303) 293-8988

jtboydd@jtboyd.com


Brisbane

61 7 3232-5000

jtboydau@jtboyd.com

   We wish to acknowledge the cooperation of Atlas’ management and staff for providing the technical, financial, and legal information used in completing this project. Our findings are based on BOYD’s extensive experience in preparing frac sand resource and reserve estimates used in US Securities and Exchange Commission (SEC) filings, and our knowledge of frac sand mining in Texas and throughout North America.
Beijing   
86 10 6500-5854    Respectfully submitted,
jtboydcn@jtboyd.com   
Bogota    JOHN T. BOYD COMPANY
+57-3115382113    By:
jtboydcol@jtboyd.com   
www.jtboyd.com   
   John T. Boyd II
   President and CEO


TABLE OF CONTENTS


Page

LETTER OF TRANSMITTAL   
TABLE OF CONTENTS   
GLOSSARY AND ABBREVIATIONS   
1.0    EXECUTIVE SUMMARY    1-1
   1.1    Introduction    1-1
   1.2    Property Description and Control    1-2
   1.3    Geology    1-4
   1.4    Exploration    1-4
   1.5    Frac Sand Reserves and Quality    1-5
   1.6    Operations    1-9
      1.6.1    Mining    1-9
      1.6.2    Processing    1-9
      1.6.3    Infrastructure    1-10
   1.7    Financial Analysis    1-10
      1.7.1    Market Analysis    1-10
      1.7.2    Capital and Operating Costs    1-12
      1.7.3    Sales, Production, and Cost Forecast    1-13
      1.7.4    Economic Analysis    1-15
   1.8    Regulation and Liabilities    1-17
   1.9    Conclusions    1-19
2.0    INTRODUCTION    2-1
   2.1    Registrant and Purpose    2-1
   2.2    Terms of Reference    2-1
   2.3    Expert Qualifications    2-2
   2.4    Principal Sources of Information    2-3
      2.4.1    Site Visits    2-3
      2.4.2    Reliance on Information Provided by the Registrant    2-4
   2.5    Effective Date    2-4
   2.6    Units of Measure    2-4
3.0    PROPERTY OVERVIEW    3-1
   3.1    Description and Location    3-1
      3.3.1 Kermit Operation    3-1
      3.3.2 Monahans Operation    3-1
   3.2    History       3-4
   3.3    Property Control    3-4
      3.3.1    Kermit Property    3-4
      3.3.2    Monahans Property    3-4


JOHN T. BOYD COMPANY


TABLE OF CONTENTS - Continued


Page

   3.4    Adjacent Properties    3-5
   3.5    Regulation and Liabilities    3-5
   3.6    Accessibility, Local Resources, and Infrastructure    3-6
      3.6.1 Kermit Property    3-6
      3.6.2 Monahans Property    3-6
   3.7    Physiography    3-7
   3.8    Climate    3-7
      3.8.1 Kermit Operation    3-7
      3.8.2 Monahans Operation    3-8
4.0    GEOLOGY       4-1
   4.1    Regional Geology    4-1
   4.2    Local Stratigraphy    4-1
      4.2.1    Quaternary Sheet and Dune Sands    4-5
      4.2.2    Ogallala Formation    4-5
   4.3    Frac Sand Geology    4-6
5.0    EXPLORATION DATA    5-1
   5.1    Background    5-1
   5.2    Exploration Procedures    5-1
      5.2.1    Drilling and Sampling    5-1
      5.2.2    Frac Sand Quality Testing    5-4
      5.2.3    Other Exploration Methods    5-5
   5.3    Laboratory Testing Results    5-5
      5.3.1    Laboratory Testing    5-5
      5.3.2    Quality Summary    5-11
   5.4    Data Verification    5-12
6.0    FRAC SAND RESOURCES AND RESERVES    6-1
   6.1    Applicable Standards and Definitions    6-1
   6.2    Frac Sand Resources    6-2
      6.2.1    Methodology    6-2
      6.2.2    Classification    6-6
      6.2.3    Frac Sand Exploration Results Areas    6-6
      6.2.4    Frac Sand Resource Estimate    6-7
      6.2.5    Validation    6-8
   6.3    Frac Sand Reserves    6-8
      6.3.1    Methodology    6-8
      6.3.2    Classification    6-9
      6.3.3    Frac Sand Reserve Estimate    6-9


JOHN T. BOYD COMPANY


TABLE OF CONTENTS - Continued


Page

7.0    MINING OPERATIONS    7-1
   7.1    Mining Method    7-1
   7.2    Mine Schedule, Equipment, and Staffing    7-1
   7.3    Mine Historical and Forecast Production    7-2
      7.3.1    Historical Mine Production    7-2
      7.3.2    Forecasted Production    7-2
   7.4    Mine Plan (Life-of-Mine)    7-2
      7.4.1    Kermit    7-2
      7.4.2    Monahans    7-4
      7.4.3    Mining Risk    7-4
8.0    PROCESSING OPERATIONS    8-1
   8.1    Overview    8-1
   8.2    Wet Process Plant    8-2
   8.3    Dry Process Plant    8-2
   8.4    Product Storage/Truck Loadout    8-3
9.0    MINE INFRASTRUCTURE    9-1
   9.1    Utilities (Power and Natural Gas)    9-1
   9.2    Process Water    9-1
10.0    MARKET ANALYSIS    10-1
11.0    CAPITAL, REVENUES, AND OPERATING COSTS    11-1
   11.1    Introduction    11-1
   11.2    Kermit Operation    11-1
      11.2.1 Historical Capital Expenditures    11-1
      11.2.2 Historical Revenues and Sales    11-1
      11.2.3 Historical Cost of Production    11-2
      11.2.4 Projected Production, Sales, and Costs    11-2
   11.3    Monahans Operation    11-3
      11.3.1 Historical Capital Expenditures    11-3
      11.3.2 Historical Revenues and Sales    11-4
      11.3.3 Historical Operating Costs    11-4
      11.3.4 Projected Production, Sales, and Costs    11-4
12.0    ECONOMIC ANALYSIS    12-1
   12.1    Introduction    12-1
   12.2    Kermit Operation    12-2
      12.2.1 Economic Analysis    12-2
      12.2.2 Cash Flow Analysis    12-2
      12.2.3 Sensitivity Analysis    12-5
   12.3    Monahans Operation    12-7
      12.3.1 Economic Analysis    12-7
      12.3.2 Cash Flow Analysis    12-7
      12.3.3 Sensitivity Analysis    12-10


JOHN T. BOYD COMPANY


TABLE OF CONTENTS - Continued


Page

      12.3.3 Sensitivity Analysis    12-10
13.0    PERMITTING AND COMPLIANCE    13-1
   13.1    Permitting    13-1
   13.2    Compliance    13-2
14.0    INTERPRETATION AND CONCLUSIONS    14-1
   14.1    Findings    14-1
   14.2    Significant Risks and Uncertainties    14-1


JOHN T. BOYD COMPANY


TABLE OF CONTENTS - Continued


          Page  

List of Tables


1.1

   Atlas Drilling and Sampling Program      1-5  

1.2

   Atlas Sand Company, Kermit and Monahans Reserves (as of December 31, 2021)      1-7  

1.3

   Proppant Performance Test Results for Kermit and Monahans      1-8  

1.4

   Kermit Historical Capital Expenditures      1-12  

1.5

   Kermit Historical Sales Data      1-13  

1.6

   Monahans Historical Capital Expenditures      1-13  

1.7

   Monahans Historical Sales Data      1-13  

1.8

   Kermit Sales Projections      1-14  

1.9

   Kermit Annual $ per Ton Sold Cash Cost Projections      1-14  

1.10

   Monahans Sales Projections      1-15  

1.11

   Monahans Annual $ per Ton Sold Cash Cost Projections      1-15  

1.12

   Summary Cash Flow Statement, Kermit      1-16  

1.13

   DCF-NPV, Kermit      1-16  

1.14

   Summary Cash Flow Statement, Monahans      1-17  

1.15

   DCF-NPV, Monahans      1-17  

3.1

   Climate Data for Kermit, Texas      3-8  

3.2

   Climate Data for Monahans, Texas      3-8  

5.1

   Atlas Drilling and Sampling Program      5-4  

5.2

   Grain Size Distribution      5-5  

5.3

   Proppant Performance Test Results for Kermit and Monahans      5-12  

6.1

   Kermit and Monahans Property Drill Hole Spacing Parameters      6-6  

6.2

   Exploration Target Area Deposit Characteristics, Monahans Property      6-7  

6.3

   In-Place Frac Sand Resources, Kermit and Monahans Operations      6-8  

6.4

   Reserves as of December 31, 2021, Atlas’ Kermit and Monahans Operations      6-10  

7.1

   Historic Frac Sand Sales      7-2  

7.2

   Forecasted ROM Production Tons      7-2  

11.1

   Kermit Historical Capital Expenditures      11-1  

11.2

   Kermit Historical Sales Data      11-2  

11.3

   Kermit Historical Cost of Production      11-2  

11.4

   Kermit Sales Projections      11-3  

11.5

   Kermit Annual Cash Cost of Production Projections      11-3  

11.6

   Monahans Historical Capital Expenditures      11-3  

11.7

   Monahans Historical Sales Data      11-4  

11.8

   Monahans Historical Cost of Production      11-4  

11.9

   Monahans Sales Projections      11-5  

11.10

   Monahans Annual Cash Cost Projections      11-5  

12.1

   Summary Cash Flow Statement, Kermit      12-2  

12.2

   DCF-NPV, Kermit      12-3  

12.3

   Pre-Tax and After-Tax Cash Flow Analysis, Kermit      12-4  

12.4

   Sensitivity Analysis – Weighted Average Sales Price, Kermit      12-5  

12.5

   Pre-Tax DCF-NPV at 8%, Kermit      12-5  


JOHN T. BOYD COMPANY


TABLE OF CONTENTS - Continued


          Page  

12.6

   Pre-Tax DCF-NPV at 10%, Kermit      12-6  

12.7

   Pre-Tax DCF-NPV at 12%, Kermit      12-6  

12.8

   After-Tax DCF-NPV at 8%, Kermit      12-6  

12.9

   After-Tax DCF-NPV at 10%, Kermit      12-7  

12.10

   After-Tax DCF-NPV at 12%, Kermit      12-7  

12.11

   Summary Cash Flow Statement, Monahans      12-8  

12.12

   DCF-NPV, Monahans      12-8  

12.13

   Pre-Tax and After-Tax Cash Flow Analysis, Monahans      12-9  

12.14

   Sensitivity Analysis – Weighted Average Sales Price, Monahans      12-10  

12.15

   Pre-Tax DCF-NPV at 8% Monahans      12-10  

12.16

   Pre-Tax DCF-NPV at 10% Monahans      12-11  

12.17

   Pre-Tax DCF-NPV at 12% Monahans      12-11  

12.18

   After-Tax DCF-NPV at 8%, Monahans      12-11  

12.19

   After-Tax DCF-NPV at 10%, Monahans      12-12  

12.20

   After-Tax DCF-NPV at 12%, Monahans      12-12  


JOHN T. BOYD COMPANY


TABLE OF CONTENTS - Continued


          Page  

List of Figures


1.1

   General Location Map      1-3  

1.2

   Permian Basin HZ Permit Submissions vs. Rigs      1-11  

1.3

   Permian Oil Production and Natural Gas Production      1-11  

1.4

   Permian Wide In-Basin Mine Operating Hours (Quarterly)      1-12  

3.1

   Topographic Map Showing General Layout of the Kermit Property      3-2  

3.2

   Topographic Map Showing General Layout of the Monahans Property      3-3  

4.1

   Cross Section A-A’, Kermit      4-2  

4.2

   Cross Section B-B’, Monahans      4-3  

4.3

   Stratigraphic Columns of Drill Holes AT1-1585 AT2-1751, Kermit and Monahans      4-4  

4.4

   Generalized Stratigraphic Chart, Surficial Deposits of Ward and Winkler Counties, TX      4-5  

5.1

   Drill Hole Sand Sample      5-2  

5.2

   Map Showing In-Place Frac Sand Isopleths (%) 40/70-Mesh Material Kermit Property      5-7  

5.3

   Map Showing In-Place Frac Sand Isopleths (%) 70/140-Mesh Material Kermit Property      5-8  

5.4

   Map Showing In-Place Frac Sand Isopleths (%) 40/70-Mesh Material Monahans Property      5-9  

5.5

   Map Showing In-Place Frac Sand Isopleths (%) 70/140-Mesh Material Monahans Property      5-10  

6.1

   Relationship Between Frac Sand Resources and Frac Sand Reserves      6-2  

6.2

   Map Showing Frac Sand Mineable Thickness Isopachs, Kermit Property      6-4  

6.3

   Map Showing Frac Sand Mineable Thickness Isopachs, Monahans Property      6-5  

7.1

   Simple Mining Flow Diagram      7-1  

7.2

   Kermit Dredge      7-3  

7.3

   Monahans Dredge – Idreco Series ISD400      7-5  

8.1

   General Arrangement Layout of Plant      8-2  

8.3

   Kermit Plant with Truck Loadouts      8-3  

8.4

   Monahans Plant with Truck Loadouts      8-3  

10.1

   WTI Crude Oil CME Futures Price      10-2  

10.2

   Permian Basin HZ Permit Submissions vs. Rigs      10-2  

10.3

   Permian Oil Production and Natural Gas Production      10-3  

10.4

   Permian Drilled but Uncompleted Wells      10-3  

10.5

   Permian Wide In-Basin Mine Hours (Quarterly)      10-4  


JOHN T. BOYD COMPANY


GLOSSARY OF ABBREVIATIONS AND DEFINITIONS


$   

:   US dollar(s)

%   

:   Percent or percentage

Atlas   

:   Atlas Energy Solutions, Inc.

API   

:   American Petroleum Institute

BOYD   

:   John T. Boyd Company

CapEx   

:   Capital expenditures

COGS   

:   Cost of goods sold

Constant Dollar   

:   A monetary measure that is not influenced by inflation and used to compare time periods. Sometimes referred to as “real dollars”.

CY   

:   Cubic yards

DCF   

:   Discounted Cash Flow

Discount Rate   

:   A rate of return used to discount future cash flows based on the return investors expect to receive from their investment.

DUC   

:   Drilled but uncompleted gas or oil well.

FOB   

:   Free-on-Board

Frac Sand   

:   Frac sand is a naturally occurring, high silica content quartz sand, with grains that are generally well rounded and exhibit high compressive strength characteristics relative to other silica sand. It is utilized as a prop or “proppant” in unconventional shale frac well completions.


JOHN T. BOYD COMPANY


Frac Sand Resource   

:   Frac sand resource is a concentration or occurrence of sand material of economic interest in or on the Earth’s crust in such form, grade or quality, and quantity that there are reasonable prospects for economic extraction. A mineral resource is a reasonable estimate of mineralization, taking into account relevant factors such as quality specifications, likely mining dimensions, location or continuity, that, with the assumed and justifiable technical and economic conditions, is likely to, in whole or in part, become economically extractable. It is not merely an inventory of all mineralization drilled or sampled.

Frac Sand Reserve   

:   Frac sand reserve is an estimate of tonnage and grade or quality of mineral resources that, in the opinion of the qualified person, can be the basis of an economically viable project. More specifically, it is the economically mineable part of a mineral resource, which includes diluting materials and allowances for losses that may occur when the material is mined or extracted.

gpm   

:   Gallons per minute

Indicated Sand Resource   

:   An Indicated Sand Resource is that part of a Sand Resource for which quantity, grade or quality, densities, shape, and physical characteristics are estimated with sufficient confidence to allow the application of Modifying Factors in sufficient detail to support mine planning and evaluation of the economic viability of the deposit. Geological evidence is derived from adequately detailed and reliable exploration, sampling and testing, and is sufficient to assume geological and grade or quality continuity between points of observation. An Indicated Sand Resource has a lower level of confidence than that applying to a Measured Sand Resource and may only be converted to a Probable Sand Reserve.

IRR   

:   Internal rate-of-return

ISO   

:   International Organization for Standardization


JOHN T. BOYD COMPANY


lb   

:   Pound

LOM   

:   Life-of-Mine

Measured Sand Resource   

:   A Measured Sand Resource is that part of a Sand Resource for which quantity, grade or quality, densities, shape, and physical characteristics are estimated with confidence sufficient to allow the application of Modifying Factors to support detailed mine planning and final evaluation of the economic viability of the deposit. Geological evidence is derived from detailed and reliable exploration, sampling, and testing and is sufficient to confirm geological and grade or quality continuity between points of observation. A Measured Sand Resource has a higher level of confidence than that applying to either an Indicated Sand Resource or an Inferred Sand Resource. It may be converted to a Proven Sand Reserve or to a Probable Sand Reserve.

Mesh   

:   A measurement of particle size often used in determining the size distribution of granular material.

Mineral Reserve   

:   See “Frac Sand Reserve

Mineral Resource   

:   See “Frac Sand Resource”

Modifying Factors   

:   The factors that a qualified person must apply to indicated and measured sand resources and then evaluate to establish the economic viability of sand reserves. A qualified person must apply and evaluate modifying factors to convert measured and indicated resources to proven and probable reserves. These factors include, but are not restricted to: mining; processing; metallurgical; infrastructure; economic; marketing; legal; environmental compliance; plans, negotiations, or agreements with local individuals or groups; and governmental factors. The number, type and specific characteristics of the modifying factors applied will necessarily be a function of and depend upon the mineral, mine, property, or project.


JOHN T. BOYD COMPANY


Mscf   

:   Thousand standard cubic feet per day

MSHA   

:   Mine Safety and Health Administration. A division of the U.S. Department of Labor.

NOAA   

:   National Oceanic and Atmospheric Administration

NSR   

:   New Source Review

NTU   

:   Nephelometric turbidity units

NPV   

:   Net Present Value

Permian Basin   

:   A large sedimentary shale basin in the southwestern part of the United States in mainly Texas and New Mexico. The basin produces approximately 5 million barrels per day of oil and holds some of the largest oil and gas reserves in the world.

Probable Sand Reserve   

:   A Probable Sand Reserve is the economically mineable part of an Indicated and, in some circumstances, a Measured Sand Resource. The confidence in the Modifying Factors applying to a Probable Sand Reserve is lower than that applying to a Proven Sand Reserve.

Proppant Sand   

:   See “Frac Sand”

Proven Sand Reserve   

:   A Proven Mineral Reserve is the economically mineable part of a Measured Sand Resource. A Proven Sand Reserve implies a high degree of confidence in the Modifying Factors.

PSI   

:   Pounds per square inch


JOHN T. BOYD COMPANY


ROM   

:   Run-of-Mine. The as-mined including in-seam clay partings mined with the sand, and out-of-seam dilution.

Rotosonic Drilling   

:   A type of core drilling combining rotary drilling with ultrasonic frequency to drill through loosely consolidated soil and rock.

SEC   

:   U.S. Securities and Exchange Commission

S-K 1300   

:   Subpart 1300 and Item 601(b)(96) of the U.S. Securities and Exchange Commission’s Regulation S-K

S&S   

:   The Sealey and Smith Foundation

Surficial   

:   Relating to the earths surface or the geology that is on the surface.

TCEQ   

:   Texas Commission on Environmental Quality

Ton   

:   Short Ton. A unit of weight equal to 2,000 pounds

tph   

:   Tons per Hour

Westward   

:   Westward Environmental Inc


JOHN T. BOYD COMPANY


1-1


1.0 EXECUTIVE SUMMARY

1.1 Introduction

BOYD was retained by Atlas to complete an independent technical audit of mineral resource and mineral reserve estimates-hereafter referred to as frac sand resource and frac sand reserve estimates-for their active mining operations located near Kermit, Texas (the “Kermit Mine”) and Monahans, Texas (the “Monahans Mine”). Throughout the report, the Kermit and Monahans mines may also be referred to as the Kermit and Monahans “operations”, “plants”, “properties”, or “facilities”. This report summarizes the results of our resource and reserve estimate and satisfies the requirements for Atlas’ disclosure of frac sand resources and reserves set forth in Subpart 1300 and Item 601(b)(96) of the SEC’s Regulation S-K (S-K 1300). This is the first technical report summary filed by Atlas for the Kermit and Monahans Mines.

BOYD’s findings are based on our detailed examination of the supporting geologic, technical, and economic information obtained from: (1) Atlas provided files, (2) discussions with Atlas personnel, (3) records on file with regulatory agencies, (4) public sources, and (5) nonconfidential BOYD files. Our analysis was performed to obtain reasonable assurance that Atlas’s frac sand resource and reserve statements are free from material misstatement. This report provides an independent estimate of the frac sand resources and reserves underlying the Kermit and Monahans controlled properties. The basis for these estimates is BOYD’s recent volumetric estimation of the resources and reserves.

This report provides a summary of primary information contained within this technical report summary and is supported by remaining portions of this report including text, figures, and tables. The Economic Analysis and resulting Net Present Value (NPV) estimate in this report were made for the purpose of confirming the economic viability of the reported sand reserves and not for the purposes of valuing Atlas or its assets. Internal Rate of Return (IRR) and project payback were not calculated, as there was no initial investment considered in the financial model.

Weights and measurements are expressed in US customary units. Unless noted, the effective date of the information, including estimates of frac sand reserves, is December 31, 2021.


JOHN T. BOYD COMPANY


1-2


1.2 Property Description and Control

Atlas has two mines located within the Permian basin of Texas. In June 2018, Atlas received a Mine Safety and Health Administration (MSHA) identification number (41-05367) for the Kermit Mine, and in July 2018 they received Monahans’ MSHA identification number (41-05369). Both mines have been operating continuously since that time.

The Kermit operation, in Winkler County, Texas, is located approximately seven miles northeast of the town of Kermit and is a surface frac sand mining and processing facility, located on approximately 5,826 “gross” acres (the “Kermit Property”) of which 5,341 “net” acres are controlled (leases and fee-owned). After applying requisite mining offsets, approximately 4,521 acres (or 78% of the property) have been explored and are considered as either mineable resources or reserves.

Atlas owns a portion of the Kermit property in fee (including the property on which the Kermit mine is located) and leases the remaining land from various lessors and as such pays either a royalty or delay rental to the lessors to retain the leased property.

The Monahans operation, in Winkler and Ward Counties Texas, is a surface frac sand mining and processing facility, located on approximately 32,224 “gross” acres (the “Monahans Property”) which is entirely leased by Atlas. After applying requisite mining offsets, a total area covering approximately 11,187 acres (or 35%) of the Monahans Property has had exploration work completed, with dense enough drill hole coverage to be considered as frac sand resources and reserves, as of the date of this report. Atlas has also completed a reconnaissance-level of exploration drilling and sampling work on an additional 9,575 acres (or an additional 30%) outside of the resource and reserve areas of the Monahans Property. This “exploration target” area has a more widely spaced drilling density than the aforementioned resource and reserve areas, however drilling and testing indicates this portion of the deposit exhibits similar characteristics, both in thickness and frac sand quality. The mine, located in Ward and Winkler counties, Texas is approximately three miles northeast of the town of Monahans.

The general location of both mines is provided in Figure 1.1, following this page.


JOHN T. BOYD COMPANY


1-3


LOGO


1-4


1.3 Geology

Frac sand is a naturally occurring, high silica content quartz sand with grains that are generally well-rounded and monocrystalline. The main difference between frac sand and other sands is that frac sand grains are relatively pure in composition, consisting almost entirely of quartz; other sands have numerous impurities that may be cemented to the quartz grains. The pure quartz composition of frac sand grains, along with being well-rounded and spherical in shape, gives these sands the characteristics (crush strength, high acid solubility, low turbidity) that are sought after by oil and gas producers for use in developing wells.

Surficial geologic units overlying the properties and surrounding areas are predominantly Quaternary age unconsolidated deposits, ranging from windblown dunes and sheet sands to alluvial sands, silts, clays, and caliche. The Llano Estacado Caprock marks the eastern-most extent of the surficial sand deposits. Winds transporting particles into the area are thought to have collided with the escarpment, which slows the velocity of the particles and drops particles out of suspension, where they have accumulated over time. Winnowing processes have caused some degree of particle sorting to occur. Due to the mechanisms and long distances of particle transport, sand grains were abraded and rounded as they reached their current locations. Quaternary unconsolidated deposition covers nearly all of the subject properties, with the surficial deposits noted as generally ranging from 60-ft to over 100-ft in thickness. Both the Kermit and Monahans properties contain no discernable overburden materials except for sparse areas of vegetation and roots that are removed during processing and are mineable from the surface down to the total defined depth of the deposits. Data from extensive crush testing along with the API testing performed on the composite samples by Atlas indicate little variability within the overall mineable deposits on each property.

1.4 Exploration

Atlas contracted Westward Environmental Inc (Westward) to perform a series of drilling and sampling programs on the Kermit and Monahans properties, which occurred over the period June 2017 through March 2018.

The drilling and sampling programs were executed in equivalent manner on each property as Westward supervised the field work and sampled each hole. Holes were drilled using a rotosonic drill rig, and each hole was sampled on 5-ft increments from the surface on the initial exploration drill programs and 10-ft increments on the follow up infill drilling programs. Westward geologists and geological technicians determined the


JOHN T. BOYD COMPANY


1-5


terminus of the sampling interval of a hole, as drilling would be stopped when the amount of sand in a recovered interval was neither the first nor second most abundant material present in a given sample interval. All drilled intervals were geologically logged, photographed, and sampled in duplicate. One set of samples was retained by Atlas for archival purposes, while the other set of samples was sent to a lab for grain size analyses and proppant sand quality testing.

In 2017, an initial drilling and sampling program utilized widely spaced exploration and drill holes, with nominal spacing of 3,000-ft to 4,500-ft between drill holes (one hole drilled per section of controlled property), in order to determine the depth and lateral extent of the sand deposits across the Kermit and Monahans properties. There were 36 holes drilled and sampled on the Kermit Property in June and July 2017. 53 holes were drilled and sampled on the Monahans Property from June to August 2017. Sample analyses were performed by PropTester in Cyprus, Texas and FracTAL in St. Paul, Minnesota.

An infill drilling program was subsequently initiated in March 2018 to increase geologic confidence on each of the subject properties. This consisted of completing an additional 25 drill holes on the Kermit Property and 27 drill holes on the Monahans Property. Upon completion of the infill drilling programs, each property now had a nominal 1,500-ft drill hole spacing within their respective initial mining areas, which provided enough geoscientific information to be able to classify the infill drilled areas as Proven and Probable Reserves. A summary of both drilling campaigns is summarized in Table 1.1.


Table 1.1: Atlas Drilling and Sampling Program

 
     Rotosonic Holes Drilled and Sampled  
     Initial*      Infill**      Combined  

Kermit Property

     36        25        61  

Monahans Property

     53        27        80  


Total

     89        52        141  


*

Drilled and sampled June to August 2017

**

Drilled and sampled March 2018

1.5 Frac Sand Reserves and Quality

This technical report summary provides an estimate of frac sand reserves for Atlas’ Kermit and Monahans mines in accordance with the requirements set forth in S-K 1300. These estimates were independently prepared by BOYD and utilized in conjunction with information provided by Atlas including: a life-of-mine (LOM) plan, the relevant processing, economic (including independent estimates of capital, revenue, and cost), marketing, legal, environmental, socio-economic, and regulatory factors for each operation.


JOHN T. BOYD COMPANY


1-6


Estimates of mineral resources and reserves are always subject to a degree of uncertainty. The level of confidence that can be applied to a particular estimate is a function of, among other things: the amount, quality, and completeness of exploration data; the geological complexity of the deposit; and economic, legal, social, and environmental factors associated with mining the resource/reserve. BOYD used the definitions provided in S-K 1300 to describe the varying degree of certainty associated with the estimates reported here.

Estimates of frac sand resource are subdivided to reflect the different levels of geological confidence into measured (highest geological confidence), indicated, and inferred (lowest geological assurance). Upon application of modifying factors that include adjustments for mining loss, processing loss, and economic factors. A measured resource may be converted to either a proven or probable reserve, while an indicated resource may only be converted to a probable reserve. An inferred resource may not be converted to a reserve without further drilling, due to the lower level of geological confidence.

A mineral reserve is the economically mineable part of a measured or indicated mineral resource, which includes diluting materials and allowances for losses that may occur when the material is mined or extracted. Estimates of mineral reserves are subdivided to reflect geologic confidence, and potential uncertainties in the modifying factors, into proven (highest assurance) and probable.

In this report, the term “frac sand reserves” represents the tonnage and quality of product sand that will be available for sale after washing and drying the run-on-mine (ROM) sand. When material variation in thickness, depth, and/or sand quality occur between drill holes, the allowable spacing distance is reduced. The following drill hole spacing criteria were determined by the Qualified Person and used in this report to define the sand resources within Atlas’ properties:


Classification

   Spacing Requirement (ft)
(Nominal Maximum)
 

Measured

     1,500  

Indicated

     2,500  

Inferred

     5,000  


JOHN T. BOYD COMPANY


1-7


BOYD’s estimate of frac sand reserves for the Kermit and Monahans mines as of December 31, 2021, total 368 million tons of saleable product (i.e., greater than 140-mesh and less than 40-mesh in size). There are 198 million tons underlying the Kermit Property and 170 million tons underlying the Monahans Property.

Table 1.2 presents the estimated frac sand reserves by product mesh size, reserve classification, and mineral ownership status for the Kermit and Monahans mines:

Table 1.2: Atlas Energy Solutions Reserves (As of December 31, 2021)


Atlas Energy Solutions, Kermit and Monahans Reserves (As of December 31, 2021)


Tons (000) By Classification and Mesh Size

   Total     
    

Proven


Probable


By Mesh Size


Control


40/70


70/140


Total


40/70


70/140


Total


40/70


70/140


Total

Kermit Operation

Owned

   78,955    61,217    140,172    —      —      —      78,955    61,217    140,172

Leased

   28,580    24,433    53,013    2,599    2,232    4,831    31,179    26,665    57,844


Total

   107,535    85,650    193,185    2,599    2,232    4,831    110,134    87,882    198,016

Monahans Operation

Leased

   71,886    46,739    118,625    32,041    19,057    51,098    103,927    65,796    169,723

Projecting sales volumes of approximately 5 million tons per year per facility, the expected LOM of the Kermit operation’s reserves is approximately 40 years and the Monahans operation is approximately 34 years.

The additional in-place resources consist of the Measured and Indicated resources that have not been formally included in a mine plan by Atlas but have adequate geoscientific information to be converted to reserves in the future. The Inferred Resources consist of areas that generally need additional exploration drilling on a closer spacing to classify them as a Measured or Indicated Resource. These resources that are estimated at 1.665 billion tons (398 million tons Kermit, 1,267 million tons Monahans) represent the in-ground material prior to applying any mining and processing losses. As additional mine planning is developed and additional drilling is performed on the resource areas of the properties, the in-place material may be converted to reserves by factoring in the mining and process loss. A detailed accounting of the resource and reserve estimates are contained in Chapter 6.


JOHN T. BOYD COMPANY


1-8


Concerning the frac sand quality of the properties, PropTester performed API RP-19C/ISO 13503-2 tests on composite samples created from sample material collected during the drilling programs on the Kermit and Monahans properties. A composite of the entire depth drilled from each hole selected was created, and for each composite sample, the testing labs created 40/70-mesh and 40/140-mesh product samples which were then analyzed for the full suite of API RP-19C/ISO 13503-2 proppant sand tests. Overall, this extensive testing indicated that a relatively uniform range of crush values exist through the entire depth of the deposit, except for one or two intervals where the caliche interval was not completely removed before performing the crush tests. These caliche intervals were about 1,000 psi less than all other intervals, and as such were not included in the summary quality data.

Combining the extensive crush testing conducted with the API testing performed on the composite samples, Atlas has completed a comprehensive review of grain characteristics for each of the reserve areas within each property. The data indicate little variability within the overall mineable deposit on each property.

Sample testing results are summarized in Table 1.3 below for each product size analyzed within each property:


Table 1.3: Proppant Performance Test Results for Kermit and Monahans

Test

   Average ISO/API Test Results By Product Size and Property
   40/70-mesh    40/140-mesh*,**
   Kermit    Monahans    Recommended
Specification
   Kermit    Monahans

Sphericity

   0.7    0.7    ≥ 0.6    0.7    0.7

Roundness

   0.8    0.7    ≥ 0.6    0.7    0.7

Acid Solubility (%)

   1.1    0.9    ≤ 3.0    2.6    1.6

Turbidity (NTU)

   15.0    7.0    ≤ 250    15.0    13.0

K-Value (000 psi)

   7 - 8    7 - 8    —      10 - 11    10 - 11


*

100-mesh proppant sand material currently does not have an API/ISO specification.

**

Test results were for a single 40/140-mesh product.

The extent to which the frac sand reserves may be affected by any known geological, operational, environmental, permitting, legal, title, variation, socio-economic, marketing, political, or other relevant issues has been reviewed as warranted. It is the opinion of BOYD that Atlas has appropriately mitigated, or has the operational acumen to mitigate, the risks associated with these factors. BOYD is not aware of any additional risks that could materially affect the development of the frac sand reserves.


JOHN T. BOYD COMPANY


1-9


Based on our independent estimate and operations review, we have a high degree of confidence that the estimates shown in this report accurately represent the available frac sand reserves controlled by Atlas, as of December 31, 2021.

1.6 Operations

1.6.1 Mining

The Kermit and the Monahans mines both employ dredging as the primary sand extraction method. Most of the mineable area at both locations has minimal overburden and vegetation; as such, sand excavation normally begins at the surface throughout most of the mine plan area. BOYD has reviewed the LOM plans for both operations and they appear to be representative of the Reserve tonnage estimates reported herein. Both mines operate continuously 24/7. The water forming the dredge ponds is sourced from a shallow aquifer which lies below each property. The dredge is a floating barge that lowers an arm or “ladder” with an attached submersible pump to the bottom of the deposit. Sand is pumped through poly pipe to the mine skid where waste material is removed. The sand is then further pumped to the wet plant with tailings and excess water retuning to the dredge pit. A conceptual mine plan with sequencing is illustrated in Chapter 7 of this report. Both mine sites operate continuously.

1.6.2 Processing

Each plant has a nominal capacity of approximately 5.5 million tons per year of finished product. The Kermit Plant was commissioned in July 2018 and the Monahans Plant was commissioned in October 2018. The predominant frac sand products produced at the operations include 40/70-mesh and 40/140-mesh products. Since the commissioning of the wet plants in 2018 through the end of 2021, the actual process yield for both plants is approximately 90%. In general, for every 100 tons of ROM material fed into the plant, 90 tons of saleable product is produced. It should be noted that these actual process yields are slightly different than the overall process yields used to estimate the entire Reserve and that Resources that have been estimated prior to applying a process yield factor.

Once the material has been mined from the pit, it proceeds to the processing plants as follows:


Wet Process Plant- ROM material from the dredge is pumped to the wet plant and the greater than 40-mesh and less than 140-mesh sand and silt material is removed.


JOHN T. BOYD COMPANY


1-10


Dry Process Plant- The wet 40/140-mesh material produced by the wet process plant is dried and screened into finished products. An on-site quality laboratory samples and monitors production and shipping sand quality daily.


Storage and Loadout- Finished products are stored in silos and gravity loaded from under the silos into highway trucks for transport to the customer. The Atlas loadout operates 24 hours per day, 7 days per week every day of the year.

1.6.3 Infrastructure

Each plant is supplied three-phase line power. Substations access 138 kV line and step voltage down to a 12.5 kV line which delivers power to the plants. Line natural gas is supplied to both plants. Natural gas line capacity and substation capacity at both plants is sufficient to serve much more than 100% of Atlas’s current requirements.

Plant process water is recycled within the plants and is pumped from the dredge pond reservoir. Additional makeup water is obtained from a wellfield containing 14 water wells having an approximate capacity of 1,600 gallons per minute (gpm) at Kermit, and 21 water wells having an approximate capacity of 2,500 gpm at Monahans. The wells at both plants are only utilized as a backup water supply.

On-site facilities at each site include a scale house, office, shop, and a quality laboratory located in the dry process plant. The surface facilities currently located at the mine are well constructed and have the necessary capacity/capabilities to support both of the operations. Operational preference may constitute the upgrading of some existing facilities if the operation expands in the future.

1.7 Financial Analysis

1.7.1 Market Analysis

Permit submissions for horizontal oil and gas wells in the Permian Basin indicate a continuation of strong drilling ahead. Utilizing data from Baker Hughes and The Railroad Commission of Texas (RRC of TX), the total number of permits filed per average annual working rig for 2021 is tracking at multi-year highs as evidenced in the chart below. For calendar year 2021, there was a total of 4,413 permit submissions with an average 227 horizontal rigs active in the Permian Basin (ratio of 19.5).


JOHN T. BOYD COMPANY


1-11


LOGO

Figure 1.2: Permian Basin HZ Permit Submissions vs. Rigs

Rig counts in the Permian Basin are up approximately 64% as of year-end 2021 versus 2020. This has led to increased production for both crude oil and natural gas. Over the same time-period, crude oil production (barrels per day) and natural gas production (thousand cubic feet per day) in the Permian Basin are up 13% and 16%, respectively. Both Permian Basin daily crude oil production and daily natural gas production continue to exceed pre-pandemic peaks and reach new records. As of year-end 2021, crude oil production in the basin is nearly 5.0 million barrels per day while basin natural gas production stands at 19.8 billion cubic feet per day.


LOGO LOGO

Figure 1.3: Permian Oil Production and Natural Gas Production


JOHN T. BOYD COMPANY


1-12


Consequently, with increases in production and well completions, activity at frac sand mines in the region have increased. According to MSHA, operating hours for the third quarter of 2021 for Permian Basin frac sand mines were up 36% since year-end 2020.


LOGO

Figure 1.4: Permian Wide In-Basin Mine Operating Hours (Quarterly)

According to industry reports, all but one frac sand mine in the Permian Basin is currently fully operational. However, total in-basin mine operating hours are still about 45% below their historical peak. Generally, mine operating hours correlate well with crude oil and natural gas production and drilling and uncompleted (DUC) well data. Current frac sand production in the Permian Basin is estimated to be nearing prior peak production of about 70 million tons leading to stable pricing in the basin. BOYD anticipates stable frac sand pricing with a slight upside bias due to potential supply chain disruptions and high commodity input costs.

1.7.2 Capital and Operating Costs

1.7.2.1 Kermit

Table 1.4 presents Kermit’s Annual CapEx for years 2020 and 2021 and is based on the fixed asset data provided by Atlas.


Table 1.4: Kermit Historical Capital Expenditures


CapEx ($000)


Year 2020

     1,297  

Year 2021*

     4,820  


Total

     6,117  


*

Includes Construction in Progress (CIP)


JOHN T. BOYD COMPANY


1-13


Table 1.5 presents Kermit’s historical sales data for years 2020 and 2021. Table 1.5 presents Atlas’ historical sales data for years 2020 and 2021. Prices have improved in Year 2021 from the low prices experienced in Year 2020. Atlas’ Year 2021 sales were 4.2 million tons, a 31% increase from Year 2020, which was impacted by the COVID-19 pandemic.


Table 1.5: Kermit Historical Sales Data

 
     Year 2020      Year 2021  

Tons sold (000)

     3,208        4,204  

Revenues ($000)

     38,728        73,836  

Product Pricing ($ per ton sold)

     12.07        17.56  

1.7.2.2 Monahans

Table 1.6 presents Monahans’ Annual CapEx for years 2020 and 2021 and is based on the fixed asset data provided by Atlas.


Table 1.6: Monahans Historical Capital Expenditures


CapEx ($000)


Year 2020

     949  

Year 2021*

     4,646  


Total

     5,596  


*

Includes Construction in Progress (CIP)

Table 1.7 presents Monahans’ historical sales data for years 2020 and 2021. Year 2021 prices have improved from low prices experienced in Year 2020. Atlas’ Year 2021 sales were approximately 4.1 million tons, a 30% increase from Year 2020, which was impacted by the COVID-19 pandemic.


Table 1.7: Monahans Historical Sales Data

 
     Year 2020      Year 2021  

Tons sold (000)

     3,160        4,093  

Revenues ($000)

     41,213        68,631  

Product Pricing ($ per ton sold)

     13.04        16.77  

1.7.3 Sales, Production, and Cost Forecast

1.7.3.1 Kermit

Annual forecasted ROM production of approximately 6.0 Mtpy is based on the dry plant producing 4.9 Mtpy of saleable product after a processing (wet and dry processing plant) loss of approximately 18%, as discussed in Chapter 6. Forecasted dry processing plant production is within the operation’s current infrastructure capacities and capabilities.


JOHN T. BOYD COMPANY


1-14


As noted in Table 1.8, the dry processing plant is projected to product approximately 4.9 Mtpy of saleable product consisting of 40/70-mesh and 40/140-mesh products, as discussed in Chapter 6.

The forecasted sales price of $30 per ton sold, for all products, presented in Table 1.8 is based on current average product prices for the first two months of 2022, as provided by Atlas, and reflects a significant rebound from years 2020 and 2021 prices. We opine that this is a reasonable price projection.


Table 1.8: Kermit Sales Projections

 
     Year 2022      Year 2023      Year 2024      Year 2025      Year 2026  

Tons Sold (000)

     4,900        4,900        4,900        4,900        4,900  

Revenues ($000)

     147,000        147,000        147,000        147,000        147,000  

Product Pricing ($ per ton sold)

     30.00        30.00        30.00        30.00        30.00  

Table 1.9 below, presents the cash cost projections for the period 2022 through 2026. Operating cost projections were provided by Atlas and are based on prior year and current year actuals. BOYD considered their estimates to be reasonable. However, adjustments were made based on our review of historical operating costs as well other information and our experience with such operations.


Table 1.9: Kermit Annual Cash Cost of Production Projections

 
     Summary Cash Cost of Production ($000)  
     Year 2022      Year 2023      Year 2024      Year 2025      Year 2026  

Operating Costs with Royalty

     33,524        32,250        31,956        31,956        31,956  

Final Reclamation Escrow

     111        111        111        111        111  


Total Cash Cost of Production

     33,636        32,362        32,068        32,068        32,068  

$ per ton sold

     6.86        6.60        6.54        6.54        6.54  

1.7.3.2 Monahans

Annual forecasted ROM production of approximately 5.6 Mtpy is based on the dry plant producing 4.9 Mtpy of saleable product after a processing (wet and dry processing plant) loss of approximately 13%, as discussed in Chapter 6. Forecasted dry processing plant production is within the operation’s current infrastructure capacities and capabilities.

As noted in Table 1.10, the dry processing plant is projected to product approximately 4.9 Mtpy of saleable product consisting of 40/70-mesh and 40/140-mesh products, as discussed in Chapter 6.


JOHN T. BOYD COMPANY


1-15


The forecasted sales price of $30 per ton sold, for all products, presented in Table 1.10 is based on current average product prices for the first two months of 2022, as provided by Atlas, and reflects a significant rebound from years 2020 and 2021 prices. We opine that this is reasonable average price.


Table 1.10: Monahans Sales Projections

 
     Year 2022      Year 2023      Year 2024      Year 2025      Year 2026  

Tons Sold (000)

     4,900        4,900        4,900        4,900        4,900  

Revenues ($000)

     147,000        147,000        147,000        147,000        147,000  

Product Pricing ($ per ton sold)

     30.00        30.00        30.00        30.00        30.00  

Table 1.11 presents the cash cost projections for the period 2022 through 2026. Operating cost projections were provided by Atlas and are based on prior year and current year actuals. BOYD considered their estimates to be reasonable. However, adjustments were made based on our review of historical operating costs as well other information and our experience with such operations.


Table 1.11: Monahans Annual Cash Cost of Production Projections

 
     Summary Cash Cost of Production ($000)  
     Year 2022      Year 2023      Year 2024      Year 2025      Year 2026  

Operating Costs with Royalty

     33,396        32,171        31,877        31,877        31,877  

Final Reclamation Escrow

     130        130        130        130        130  


Total Cash Cost of Production

     33,526        32,301        32,007        32,007        32,007  

$ per ton sold

     6.85        6.60        6.54        6.54        6.54  

1.7.4 Economic Analysis

The Discounted Cash Flow - Net Present Value (DCF-NPV) estimates presented were made for purposes of confirming the general economic viability of the reported frac sand reserves and not for purposes of valuing Atlas, the Kermit and Monahans operations, or its assets. Internal rate-of-return (IRR) and project payback were not calculated, as there were no initial investments considered in the Kermit and Monahans financial models.

All DCF-NPV values are as of January 1, 2022, for the Kermit and Monahans operations. The intent of this exercise is to demonstrate that the operations generate positive cash flows (based on a 10% discount rate), on a pre-tax and after-tax basis, which supports the statement of frac sand reserves herein.

Resource tons have not been included in the DCF-NPV analyses, although substantial additional saleable product will be available as the in-place resources and other exploration target areas are converted to reserves.


JOHN T. BOYD COMPANY


1-16


1.7.4.1 Kermit

Table 1.12 below presents the pre-tax and after-tax cash flow projections based on the proposed LOM production schedule and revenue, cost of production, and CapEx estimates discussed above for the Kermit operation.


Table 1.12: Kermit Summary Cash Flow Statement

 
     Summary Cash Flow Statement ($ 000)  
     2022      2032      2042      2052      2062         
     to 2031      to 2041      to 2051      to 2061      to 2062      Total  

Total Tons Sold (000)

     49,000        49,000        49,000        49,000        2,016        198,016  

Revenues

     1,470,000        1,470,000        1,470,000        1,470,000        60,480        5,940,480  

Cost of Production

     322,538        323,126        325,576        327,277        17,920        1,316,436  

CapEx

     20,000        20,000        20,000        19,000        —          79,000  


Net Pre-Tax Cash Flow

     1,127,462        1,126,874        1,124,424        1,123,723        42,560        4,545,044  

Federal Income and State Franchise Taxes

     227,676        234,419        236,866        237,130        8,373        944,464  


Net After-Tax Cash Flow

     899,786        892,455        887,558        886,593        34,187        3,600,579  

Three DCF-NPVs on a pre-tax basis and three DCF-NPVs on a after-tax basis, using discount rates of 8%, 10%, and 12%, were calculated utilizing the cash flows above. The DCF-NPV values used mid-year discounting and all cash flows were on a constant dollar basis.

The pre-tax DCF-NPVs range from approximately $983 million to $1,398 million, and the after-tax DCF-NPVs range from approximately $783 million to $1,112 million. Table 1.13 summarizes the results of the pre-tax analyses:


Table 1.13: Kermit DCF-NPV

 
     DCF-NPV ($ millions)  
     8%      10%      12%  

Pre-Tax

     1,398        1,156        983  

After-Tax

     1,112        920        783  

Refer to Table 12.3 in Chapter 12 for the LOM cash flow analysis and corresponding pre-tax and after-tax DCF-NPV analyses at a 10% discount rate.


JOHN T. BOYD COMPANY


1-17


1.7.4.2 Monahans

Table 1.14 below presents the pre-tax cash flow projections based on the proposed LOM production schedule and revenue, cost of production, and CapEx estimates discussed above for the Monahans operation.


Table 1.14: Monahans Summary Cash Flow Statement

 
     Summary Cash Flow Statement ($ 000)  
     2022      2032      2042      2052         
     to 2031      to 2041      to 2051      to 2056      Total  

Total Tons Sold (000)

     49,000        49,000        49,000        22,723        169,723  

Revenues

     1,470,000        1,470,000        1,470,000        681,690        5,091,690  

Cost of Production

     321,883        322,520        324,970        155,573        1,124,946  

CapEx

     20,000        20,000        20,000        7,000        67,000  


Net Pre-Tax Cash Flow

     1,128,117        1,127,480        1,125,030        519,117        3,899,744  

Federal Income and State Franchise Taxes

     248,822        248,688        248,174        114,063        859,748  


Net After-Tax Cash Flow

     879,295        878,792        876,856        405,054        3,039,997  

Three DCF-NPVs on a pre-tax basis and three DCF-NPVs on an after-tax basis, using discount rates of 8%, 10%, and 12%, were calculated utilizing the cash flows above. The DCF-NPV values used mid-year discounting and all cash flows were on a constant dollar basis.

The pre-tax DCF-NPV ranges from approximately $974 million to $1,362 million, and the after-tax DCF-NPVs range from approximately $759 million to $1,062 million. Table 1.15 summarizes the results of the pre-tax and after-tax analyses:


Table 1.15: Monahans DCF-NPV

 
     DCF-NPV ($ millions)  
     8%      10%      12%  

Pre-Tax

     1,362        1,138        974  

After-Tax

     1,062        887        759  

Refer to Table 12.13 in Chapter 12 for the LOM cash flow analysis and corresponding pre-tax and after-tax DCF-NPV analyses at a 10% discount rate.

1.8 Regulation and Liabilities

The Kermit and Monahans operations are predominantly regulated by the Texas Commission on Environmental Quality (TCEQ) with respect to environmental compliance. The predominant permitting requirement is an active New Source Review (NSR) permit for air pollution control. Both operations have a current NSR permit which is renewable in 2028. Other permits held for the operations include Stormwater, Above


JOHN T. BOYD COMPANY


1-18


Ground Storage Tank, Aggregate Production Operation, and a septic permit. A SPCC plan (spill prevention plan) is also active at each operation. A summary of the permits for both operations is as follows:


Permit Number


Permit type


Plant


Status


Expires

149761    Air Permit (NSR)    1 - Kermit    Active    6/29/2028
AP0002721    Aggregate Production Operation (APO Registration)    1 - Kermit    Active   
2480014    Water Well 1 - CN605406776, RN109897975 -is temporarily approved for use for the period of two years from this letter date based on the conditions    1 - Kermit    Pending    3/6/2022
n/a    SPCC (Spill Plan)    1 - Kermit    Active   
148572    Permit By Rule    2 - Monahans    Active   
148113    Permit By Rule    1 - Kermit    Active   
150399    Air Permit    2 - Monahans    Active    6/29/2028
AP0002804    Aggregate Production Operation (APO Registration)    2 - Monahans    Active   
2480015    Water Well 2 - CN605406776, RN109954511 - temporarily in service    2 - Monahans    Pending   
n/a    SPCC (Spill Plan) -Oi and Gas    2 - Monahans    Active   
NOA WKP-14-17    septic Tank - North - Kermit         
   septic Tank - South - Monahans         

Although there are no formal state or federal reclamation obligations required for the operation, the Lessor of the property controlled by lease at Monahans has reclamation requirements for post mining land use. An excerpt from the lease document pertaining to these requirements is presented in Chapter 13.

Additionally, Atlas participates in a voluntary Candidate Conservation Agreement with Assurances for the Dune Sagebrush Lizard (DSL). This mitigates DSL regulatory risk for both mining operations. Atlas has the option to either set aside acreage for the DSL habitat or contribute cash based on the acreage within the habitat area. Atlas has significant acreage without sand reserves to set aside for this purpose and can continue mining based on the agreement. The agreement lasts for 23 years starting in January 2021.

Mine safety is regulated by the federal government by MSHA as are all surface mining operations. MSHA inspects the facilities a minimum of twice yearly. Atlas’ safety record compares favorably with its regional peers. For clarity, MSHA refers to Kermit and Monahans as Kermit North (MSHA Id# 4105367) and Kermit South (MSHA Id# 4105359), respectively. Data indicate that during the mines operational lives (2018 through 2021), Non-Fatal Lost Days injury rates have been on the decline. Atlas’ incident rate has trended below average in comparison with other west Texas regional frac sand mining operations during the past three years (2018 through 2021).


JOHN T. BOYD COMPANY


1-19


Based on our review of information provided by Atlas and available public information, it is BOYD’s opinion that Atlas’ record of compliance with applicable mining, water quality, and environmental regulations is generally typical for the industry. BOYD is not aware of any regulatory violation or compliance issue that would materially impact the frac sand reserve estimate.

1.9 Conclusions

It is BOYD’s overall conclusion that Atlas’ frac sand reserves, as reported herein: (1) were prepared in conformance with accepted industry standards and practices, and (2) are reasonably and appropriately supported by technical evaluations, which consider all relevant modifying factors. We do not believe there is other relevant data or information material to the properties that would render this technical report summary misleading. Our conclusions represent only informed professional judgment.

Given the operating history and actual performance of Atlas through the COVID-19 pandemic and volatile energy market conditions, we consider the going concern to be viable under the current and foreseeable operating environment. A general assessment of risk is presented in the relevant sections of this report.

The ability of Atlas, or any mine operator, to recover all of the reported frac sand reserves is dependent on numerous factors that are beyond the control of, and cannot be anticipated by, BOYD. These factors include mining and geologic conditions, the capabilities of management and employees, the securing of required approvals and permits in a timely manner, future sand prices, etc. Unforeseen changes in regulations could also impact performance. Opinions presented in this report apply to the site conditions and features as they existed at the time of BOYD’s investigations and those reasonably foreseeable.


JOHN T. BOYD COMPANY


2-1


2.0 INTRODUCTION

2.1 Registrant and Purpose

This technical report summary was prepared for Atlas in support of their disclosure of frac sand reserves for the Kermit and Monahans mines in accordance with S-K 1300 Regulations.

Atlas is a private, US-based mining company headquartered in Austin, Texas. Atlas commenced operations at the Kermit Mine in June 2018 and the Monahans Mine in July 2018. Atlas provides in-basin frac sand to the surrounding energy drilling market within the Permian basin. All of Atlas’ products are trucked to the surrounding energy projects from both of their Permian based mines. Atlas’ website is found at www.atlassand.com.

2.2 Terms of Reference

Atlas initially retained BOYD to complete an independent technical report for both mines which was issued in December 2018 (BOYD Report No. 3871.000). Subsequently, Atlas retained BOYD to prepare a SEC-compliant technical report summary to support their disclosure of frac sand reserves following S-K 1300 requirements. Our objective is to utilize the original report as a basis and incorporate additional information that we have reviewed into compiling an updated compliant technical report summary contained herein. The estimates within this report are adjusted to reflect an “as of’ date of December 31, 2021.

The results of our review, presented in report form herein, were prepared in accordance with the disclosure requirements set forth in Subpart 1300 and Item 601(b)(96) of the SEC’s Regulation S-K. The purpose of this report is threefold: (1) to summarize available information for the subject mining properties, (2) to provide the conclusions of our technical audit, and (3) to provide a statement of frac sand resources and reserves for the Kermit and Monahans mines. This is the first technical report summary filed by Atlas for the mines.

BOYD’s findings are based on our detailed examination of the supporting geologic, technical, and economic information provided by Atlas in formulating the estimates of frac sand resources and reserves disclosed in this report. We independently estimated the frac sand resources and reserves from first principles based on third-party exploration information provided to BOYD.


JOHN T. BOYD COMPANY


2-2


We used standard engineering and geoscience methods, or a combination of methods, that we considered to be appropriate and necessary to establish the conclusions set forth herein. As in all aspects of mining property evaluation, there are uncertainties inherent in the interpretation of engineering and geoscience data; therefore, our conclusions necessarily represent only informed professional judgment.

The ability of Atlas, or any mine operator, to recover all of the estimated frac sand reserves presented in this report is dependent on numerous factors that are beyond the control of, and cannot be anticipated by, BOYD. These factors include mining and geologic conditions, the capabilities of management and employees, the securing of required approvals and permits in a timely manner, future sand prices, etc. Unforeseen changes in regulations could also impact performance. Opinions presented in this report apply to the site conditions and features as they existed at the time of BOYD’s investigations and those reasonably foreseeable.

This report is intended for use by Atlas subject to the terms and conditions of its engagement agreement with BOYD. The agreement permits Atlas to file this report as a technical report summary with the SEC pursuant to Subpart 1300 and Item 601(b)(96) of Regulation S-K. Except for the purposes legislated under US securities law, any other uses of or reliance on this report by any third party is at that party’s sole risk. The responsibility for this disclosure remains with Atlas. The user of this document should ensure that this is the most recent disclosure of frac sand resources and reserves for the Kermit and Monahans mines as it is no longer valid if more recent estimates have been issued.

2.3 Expert Qualifications

BOYD is an independent consulting firm specializing in mining-related engineering and financial consulting services. Since 1943, BOYD has completed over 4,000 projects in the United States and more than 90 other countries. Our full-time staff comprises mining experts in: civil, environmental, geotechnical, and mining engineering; geology; mineral economics; and market analysis. Our extensive experience in frac sand resources/reserve estimation and our knowledge of the subject property, provides BOYD an informed basis on which to opine on the frac sand reserves available at the Atlas mines. An overview of BOYD can be found on our website at www.jtboyd.com.

The individuals primarily responsible for this audit and the preparation of this report are by virtue of their education, experience, and professional association considered Qualified Persons as defined in Subpart 1300 of Regulation S-K.


JOHN T. BOYD COMPANY


2-3


Neither BOYD nor its staff employed in the preparation of this report have any beneficial interest in Atlas, and are not insiders, associates, or affiliates of Atlas. The results of our resource/reserve estimate and subsequent audit were not dependent upon any prior agreements concerning the conclusions to be reached, nor were there any undisclosed understandings concerning any future business dealings between Atlas and BOYD. This report was prepared in return for fees based upon agreed commercial rates, and the payment for our services was not contingent upon our opinions regarding the project or approval of our work by Atlas and its representatives.

2.4 Principal Sources of Information

Information used in this assignment was obtained from: (1) Atlas files, (2) discussions with Atlas personnel, (3) records on file with regulatory agencies, (4) public sources, and (5) nonconfidential BOYD files. The basis for this report is the previously compiled BOYD technical report (BOYD Report No. 3871.000 issued in December 2018) which provided an independent estimate of frac sand reserves for the Kermit Mine and the Monahans Mine as of the commencement of mining in 2018.

Additional information was provided by Atlas including:


Financial forecasting models.


Historical information, including:


Production reports and reconciliation statements.


Financial statements.


Product sales and pricing.


Mine plans.


Site plans.


Operational data.

The data and work papers used in the preparation of this report are on file in our offices.

2.4.1 Site Visits

A personal inspection of the Atlas operation was made by two of BOYD’s senior geology and mining staff-both qualified persons and co-authors of this report-on April 4, 2018. The site visit included: (1) observation of the active mining operations, (2) a tour of the mine site’s surface infrastructure, and (3) a tour of the process plant and truck loadouts. BOYD’s representatives were accompanied by Atlas’ General Manager who openly and cooperatively answered questions regarding, but not limited to: site geology, mining conditions and operations, equipment usage, labor relations, operating and capital costs, current and proposed processing operations, and frac sand marketing. The predominant significant operational change to the operations since the time of our site visit has been the transition to a dredge mining scheme. The dredges were not in operation at the time of the visit.


JOHN T. BOYD COMPANY


2-4


2.4.2 Reliance on Information Provided by the Registrant

In the preparation of this report we have relied, without independent verification, upon information furnished by Atlas with respect to: property interests; exploration results; current and historical production from such properties; current and historical costs of operation and production; and agreements relating to current and future operations and sale of production.

BOYD exercised due care in reviewing the information provided by Atlas within the scope of our expertise and experience (which is in technical and financial mining issues) and concluded the data are valid and appropriate considering the status of the subject properties and the purpose for which this report was prepared. BOYD is not qualified to provide findings of a legal or accounting nature. We have no reason to believe that any material facts have been withheld, or that further analysis may reveal additional material information. However, the accuracy of the results and conclusions of this report are reliant on the accuracy of the information provided by Atlas.

While we are not responsible for any material omissions in the information provided for use in this report, we do not disclaim responsibility for the disclosure of information contained herein which is within the realm of our expertise.

2.5 Effective Date

The frac sand reserves presented in this technical report summary are effective as of December 31, 2021. The report effective date is December 31, 2021.

2.6 Units of Measure

The US customary measurement system has been used throughout this report. Tons are dry short tons of 2,000 pounds. Unless otherwise stated, all currency is expressed in constant 2021 US Dollars ($).


JOHN T. BOYD COMPANY


3-1


3.0 PROPERTY OVERVIEW

3.1 Description and Location

Referring to Figure 1.1 (General Location Map), the Kermit and Monahans properties are approximately 15 miles apart. From the Kermit Property, it is approximately a 40-mile drive southeast to reach the Monahans Property.

3.1.1 Kermit Operation

The Kermit Operation, in Winkler County, Texas, is a surface frac sand mining and processing facility, located on approximately 5,826 “gross” acres (the “Kermit Property”) of which 5,341 “net” acres are controlled (leases and fee-owned) by Atlas. It is approximately seven miles northeast of the town of Kermit, with a majority of the property on the north side of State Route 115. The southeast corner of the Texas-New Mexico border is less than five miles from the northwest corner of the property.

Geographically, Kermit’s frac sand processing plant is located at approximately 31° 58’ 6.29” N latitude and 103° 0’ 39.46” W longitude. Refer to Figure 3.1, which illustrates the general layout of the Kermit operation.

3.1.2 Monahans Operation

The Monahans operation, in Ward and Winkler Counties, Texas, is a surface frac sand mining and processing facility, located on approximately 32,224 “gross” acres (the “Monahans Property”) which is entirely leased by Atlas. The property is approximately three miles northeast of the town of Monahans and is situated on the north side of Highway 20. Monahans Sand Hills State Park borders the southeastern corner of the property.

Geographically, Monahans’ frac sand processing facility is located at approximately 31° 39’ 32.53” N latitude and 102° 52’ 55.46” W longitude. Refer to Figure 3.2 which illustrates the general layout of the Monahans operation.


JOHN T. BOYD COMPANY


3-2


LOGO


3-3


LOGO


3-4


3.2 History

Over the past four years, extensive surface mining of frac sand has been conducted in the West Texas region. In August 2017, the first “in-basin” mine began selling frac sand into the Permian Basin oil and gas industry. Since then, frac sand mines have been opened in the general vicinity of the Kermit and Monahans operations.

In June 2018, Atlas received a MSHA identification number (41-05367) for the Kermit Mine, and in July 2018 they received Monahans’ MSHA identification number (41-05369).

3.3 Property Control

Property control data provided for the Kermit and Monahans properties included maps, mining lease agreements, and royalty agreements furnished to BOYD, which have been accepted as being true and accurate for the purpose of this report.

Atlas has entered into a royalty agreement associated with its leased properties with a related party, under which they have committed to pay royalties on products sold from their production facilities. Royalty expense is recorded as products are sold, and is included in cost of sales, totaling less than 5% of costs of sales for the years ending December 31, 2020 and 2021.

Under the Monahans Lease and the Kermit Royalty Agreement, Atlas makes monthly royalty payments to Permian Dunes based on a percentage of their gross monthly proppant sand sales. The lease also includes an annual minimum royalty payment in the amount of $1,000,000 (the “Minimum Annual Royalty Payment”) in any year of the term following an occurrence of a Capital Event.

3.3.1 Kermit Property

The Kermit Property comprises approximately 5,826 “gross” acres of which 5,341 “net” acres are controlled by Atlas (3,887 acres leased and 1,454 acres owned in fee). After applying requisite mining offsets, approximately 4,521 acres (or 78% of the property) have been explored and are considered as either mineable resources or reserves.

3.3.2 Monahans Property

The Monahans Property comprises approximately 32,224 “gross” acres which is entirely leased by Atlas. After applying requisite mining offsets, a total area covering approximately 11,187 acres (or 35%) of the Monahans Property has had exploration work completed, with dense enough drill hole coverage to be considered as frac sand


JOHN T. BOYD COMPANY


3-5


resources and reserves, as of the date of this report. Atlas has also completed a reconnaissance-level of exploration drilling and sampling work on an additional 9,575 acres (or an additional 30%) outside of the resource and reserve areas of the Monahans Property. This “exploration target” area has a more widely spaced drilling density than the aforementioned resource and reserve areas, however drilling and testing indicates this portion of the deposit exhibits similar characteristics, both in thickness and frac sand quality.

3.4 Adjacent Properties

The region has seen mining of the surficial sand deposits for purposes of producing frac sand. In the general vicinity of the Kermit and Monahans operations, other existing frac sand mining operations have been opened in Ward and Winkler counties, as well as in surrounding counties. The Kermit operation is closer to the New Mexico oil and gas fields than the Monahans operation.

3.5 Regulation and Liabilities

Mining and related activities for the Atlas operations are predominantly regulated by the TCEQ.

The Kermit Operation has a Permit-By-Rule number of 148113, and their current NSR air pollution control permit is renewable in 2028. Other permits include Aggregate Production Operation, SPCC (Spill Plan), Septic Tank, and Water Well (temporary approval which expires in March 2022).

The Monahans Operation has a Permit-By-Rule number of 148572, and their current NSR air pollution control permit is renewable in 2028. Other permits include Aggregate Production Operation, SPCC (Spill Plan), Septic Tank, and Water Well (temporarily in service waiting approval of the permit).

Atlas participates in a voluntary Candidate Conservation Agreement with Assurances (CCAA) for the Dune Sagebrush Lizard (DSL). The agreement, which Atlas signed in January 2021, lasts for 23 years. Their voluntary participation in the CCAA effectively mitigates DSL regulatory risk for the Atlas Kermit and Monahans mining operations. Atlas can either set aside acreage for DSL habitat or contribute cash to continue participating in the CCAA. Atlas holds significant sand acreage outside of their current resources and reserves that would be able to be contributed or set aside for the CCAA, allowing them to continue mining operations, even if the DSL is listed as an endangered species. Atlas did not inform BOYD of any issues related to the DSL with regards to mining of the Kermit and Monahans properties.


JOHN T. BOYD COMPANY


3-6


3.6 Accessibility, Local Resources, and Infrastructure

3.6.1 Kermit Property

The Kermit Property is located near small rural towns in western Texas and southeastern New Mexico. The surrounding region has a well-established history of oil and gas production, being located within the center of the Permian Basin. Winkler and the surrounding counties have a combined population of over 280,000 people, according to 2020 population estimates by the Texas Demographic Center and Lea County, New Mexico.

General access to the Kermit Property is via a well-developed network of primary and secondary roads serviced by state and local governments. These roads offer direct access to the mine and processing facilities and are generally open year-round. Primary vehicular access to the property is via SR 115, running north-south. Various state highways (302, 115, 18, 128) in Texas and New Mexico are accessible to the subject property and provide primary access to various portions of the oil and gas fields.

The Midland International Air and Space Port is located approximately 45 miles southeast of the Kermit Operation, and there are additional local/regional airports located within a 65-mile radius of the Kermit Property.

With regards to utilities, three phase electrical power is supplied to the property from a local utility, a natural gas line supplies gas to the dry plant, and other miscellaneous services are readily available. Water is gathered in a central collection pond or mine pit reservoir which acts as the primary source of water. In addition, 14 water wells drilled throughout the property function as a backup source of water.

3.6.2 Monahans Property

The Monahans Property is located near small rural towns in western Texas. The region has a well-established history of oil and gas production, being located within the center of the Permian Basin. Ward, Winkler, and the surrounding counties have a combined population of over 225,000 people, according to 2020 population estimates by the Texas Demographic Center.


JOHN T. BOYD COMPANY


3-7


General access to the Monahans Property is via a network of primary and secondary roads serviced by state and local governments. These roads offer direct access to the mine and processing facilities and are generally open year-round. Primary vehicular access to the property is via SH 18, which runs northeast-southwest, and Interstate 20 which also runs northeast-southwest below the southern boundary of the property. These roads provide access to various portions of the oil and gas fields. In addition, a connection to the UP railroad via the Texas-New Mexico railroad branch line is located in the city of Monahans.

The Midland International Air and Space Port is approximately 40 miles east of the Monahans operation, and there are additional local/regional airports located within a 50-mile radius of the Monahans property.

Regarding utilities to the property, three phase electrical power is supplied from a local utility, a natural gas line supplies gas to the dry plant, and other miscellaneous services are available. Water is gathered in a central collection pond which acts as the primary source of water. In addition, 21 water wells drilled throughout the property provide a backup supply of water.

3.7 Physiography

The Kermit Property and the Monahans Property are situated within the Texas Great Plains physiographic province, a region encompassing much of northwestern and western Texas. The surrounding areas generally consist of desert valleys covered with windblown sheet and dune sands, high plains covered with thick alluvium (the Llano Estacado or Staked Plains), or plateaus consisting of thin carbonate-based soils (the Caprock Escarpment). The two properties encompass a majority of the active dune complexes found in this area. The plateau areas, typically covered by a weathering-resistant caliche (a hardened natural cement of calcium carbonate that binds other materials-such as gravel, sand, clay, and silt), may abruptly stand up to 1,000 ft above the plains. Much of the region may be covered by various types of desert scrub grasses, sages, yuccas, junipers, shin oaks, and mesquites.

3.8 Climate

3.8.1 Kermit Operation

Climate for the Kermit operation is generally arid with mild winters and hot summers. Average monthly high temperatures range from 59°F to 95°F, with June, July, and August being the hottest months. Average monthly low temperatures range from 28°F to 69°F, with the winter months of December, January, and February exhibiting average lows at or below freezing (32°F). Average annual precipitation is about 15 in. Table 3.1 provides monthly temperature and precipitation climate statistics from the National Oceanic and Atmospheric Administration (NOAA) for the period 2004 through 2020 for the Kermit area.


JOHN T. BOYD COMPANY


3-8


Table 3.1: Climate Data for Kermit, Texas

Averages (2004-2020)

   Units    Jan    Feb    Mar    Apr    May    Jun    Jul    Aug    Sep    Oct    Nov    Dec

High Temperature

   ºF    59    65    72    81    88    94    95    94    88    80    69    61

Low Temperature

   ºF    28    32    40    48    57    67    69    68    61    50    38    29

Average Precipitation

   inches    0.40    0.60    0.87    0.63    1.72    1.87    1.90    1.66    2.17    1.53    0.68    0.58

Source: National Oceanic and Atmospheric Administration

https://www.weather.gov/maf/cli_maf_coop_annprecip_kermit

3.8.2 Monahans Operation

Climate for the Monahans operation is generally arid with mild winters and hot summers. Average monthly high temperatures range from 60°F to 97°F, with June, July, and August being the hottest months. Average monthly low temperatures range from 28°F to 69°F, with the winter months of December, January, and February exhibiting average lows at or below freezing (32°F). Average annual precipitation is about 14 in. Table 3.2 provides monthly temperature and precipitation climate statistics from NOAA for the period 1981 through 2010 for the Monahans area.


Table 3.2: Climate Data for Monahans, Texas

Averages (1981-2010)


Units

   Jan    Feb    Mar    Apr    May    Jun    Jul    Aug    Sep    Oct    Nov    Dec

High Temperature

   ºF    60    65    73    82    91    97    97    96    90    81    70    60

Low Temperature

   ºF    28    33    40    47    58    67    69    68    61    50    37    28

Average Precipitation

   inches    0.58    0.70    0.59    0.64    1.44    1.37    1.94    1.68    2.16    1.66    0.60    0.79

Average Snowfall

   inches    0.20    0.00    0.20    0.00    0.00    0.00    0.00    0.00    0.00    0.00    0.10    0.50

Source: National Oceanic and Atmospheric Administration

https://www.weather.gov/maf/cli_maf_coop_annprecip_monahans


JOHN T. BOYD COMPANY


4-1


4.0 GEOLOGY

4.1 Regional Geology

Quaternary-aged sand formations are present across the surface of much of the area in and around the Kermit and Monahans properties. Both properties contain active dune complexes, consisting of large and open dunes exposed at the surface, which are constrained by the Llano Estacado Caprock to the east, and caliche outcrops to the west. Much of the surrounding areas contain surficial deposits consisting primarily of windblown sheet sands, ancient dunes, and dune ridges.

4.2 Local Stratigraphy

Surficial geologic units overlying the properties and surrounding areas are predominantly Quaternary age unconsolidated deposits, ranging from windblown dunes and sheet sands to alluvial sands, silts, clays, and caliche. Origins of these deposits are believed to be a combination of eroded bedrock material from the southern Rocky Mountains, and locally eroded Ogallala Formation sandstone. As portions of the southern Rockies were eroded via weathering, particles were carried to the Pecos River. Ancient flooding events of the Pecos River resulted in the suspended particles being deposited into flood plains. Once flood waters receded, winds took over, drying and further transporting these particles into the western Texas region.

The Llano Estacado Caprock Escarpment marks the eastern-most extent of the surficial sand deposits. Winds transporting particles into the area are thought to have collided with the escarpment, causing them to slow and drop particles out of suspension, where they have accumulated over time. Winnowing processes caused a further degree of particle sorting to occur. Due to the mechanisms and long distances of particle transport, sand grains were abraded and rounded as they reached their current locations.

These processes resulted in the formation of the Kermit and Monahans dune fields, covering an area of approximately 5-10 miles wide, and 60 miles long, extending primarily through Winkler and Ward counties in west Texas. Cross sections created from the geologic models of each property are presented for the Kermit and Monahans properties in Figures 4.1 and 4.2, respectively, with locations of each cross section shown on Figures 3.1 and 3.2, respectively. Also, a representative stratigraphic column from 1 drill hole completed within each of the subject properties is also presented in Figure 4.3 for reference.


JOHN T. BOYD COMPANY


4-2


LOGO


4-3


LOGO


4-4


LOGO


4-5


The present-day dune system and surrounding sheet sands are largely vegetated, however the active dune fields, on which Atlas’ Kermit and Monahans operations are located, contain no discernable overburden materials except for sparse areas of vegetation and roots that are removed during processing. The Kermit and Monahans deposits are mineable from the surface down, to the total defined depth of the dune and sheet sand deposit as is further defined by the drilling and sampling campaigns explained in Chapter 5.

Quaternary unconsolidated dune deposits cover the subject properties, generally ranging in thickness from 60-ft to over 100-ft, which is above average thicknesses seen in other surficial sand deposits of the area. A generalized stratigraphic chart of the geologic units in Ward and Winkler counties, Texas is presented in Figure 4.4.


LOGO

Figure 4.4: Generalized Stratigraphic Chart, Surficial

Deposits of Ward and Winkler Counties, TX

4.2.1 Quaternary Sheet and Dune Sands

The Kermit and Monahans properties are uniformly covered by Quaternary dune and sheet sands generally consisting of fine-to medium-grained quartz sand grains mixed with varying degrees of silts, calcareous sands, and caliche nodules. Surficial sand deposition may range in thickness from less than 10-ft of windblown sheet sands to over a hundred feet of dune sands. Unconsolidated alluvial deposits consisting of pebble-to cobble-sized limestone and chert nodules overlain by silts are found to the east of the properties.

4.2.2 Ogallala Formation

The Ogallala Formation is predominantly comprised of weakly cemented to unconsolidated fine-to medium-grained sands, which may be silty and calcareous in places. A caliche caprock is frequently exhibited, which resists weathering and forms ledges. Thickness of this formation has been recorded up to 550 ft.


JOHN T. BOYD COMPANY


4-6


4.3 Frac Sand Geology

Frac sand is a naturally occurring, high silica content quartz sand, with grains that are generally well-rounded and monocrystalline. The main difference between frac sand and other sands is that frac sand grains are relatively pure in composition, consisting almost entirely of quartz; other sands have numerous impurities that may be cemented to the quartz grains. The pure quartz composition of frac sand grains, along with being well-rounded and spherical in shape, gives these sands the characteristics (crush strength, high acid solubility, low turbidity) that are sought after by oil and gas producers for use in developing wells.


JOHN T. BOYD COMPANY


5-1


5.0 EXPLORATION DATA

5.1 Background

In-basin frac sand mines, such as the Kermit and Monahans mines in west Texas, are a relatively new extension of the frac sand mining industry. The first in-basin frac sand mines in the United States opened in the Permian Basin of Texas in late-2017. As these operations began fulfilling contracts to in-basin oil and gas exploration and production (E&P) companies, producers noted favorable results using the locally sourced proppants. Since in-basin mining and sales began in the Permian Basin, nearly every other energy basin has gone through a period of frenzied exploration to locate suitable local sources of frac sands. Many E&Ps shifted their approach from requiring only premium branded frac sands, such as Northern White Sand, to using higher quantities of locally sourced and lower-priced frac sands, with positive results.

5.2 Exploration Procedures

5.2.1 Drilling, Sampling, and Sample Security

Atlas, in developing the Kermit and Monahans properties, contracted Westward to perform a series of drilling and sampling campaigns on the Kermit and Monahans properties, which occurred over the period June 2017 through March 2018. The two main goals of the campaigns were to: (1) define the lateral extent and thickness of the potentially mineable deposit, and (2) obtain samples through the total depth of mineable sand found on each property for the purpose of determining grain size distribution and for testing to determine proppant performance qualities.

The drilling and sampling campaigns were executed in equivalent manner on each property, as Westward supervised the field work and geologically logged, photographed, and sampled each drill hole. Drilling was conducted utilizing track-mounted rotosonic drilling rig, which was selected not only as it would provide highest potential core recoveries in the loosely deposited dune and sheet sand formations found on the subject properties, but also because the loose surface material required track mounted vehicles to traverse most areas within the subject properties as well.


JOHN T. BOYD COMPANY


5-2


Each drill hole was completed by advancing the 6.25-inch outside diameter core barrel 10-ft at a time and recovering a 4.50-inch diameter core sample for each drilling run. Each recovered core was extruded into two 5-ft sample bags, with depths written on each bag by the driller. After logging and photographing an interval, cores were then sampled, generally on 5-ft or 10-ft increments, from the surface through the total mineable depth of sand. Sample material was obtained from each recovered core interval by gathering material along the entire length of the core with a hand trowel, in order to obtain a representative sample of the entire length of core. Sample material was placed into burlap sample bags as it was gathered from the core, and each bag was labeled with the drill hole name and the top and bottom sample depth. This process was completed a second time to create a duplicate sample set of each interval drilled.

Westward geologists and geological technicians determined the terminus of the sampling interval of a drill hole when the amount of sand in a recovered interval was neither the first nor second most abundant material present. All drilled intervals were geologically logged, photographed, and sampled in duplicate though the duration of each of the drilling campaigns.

Drilling samples were kept on-site in a secure location until the laboratory set was shipped to the respective labs, at which time Atlas obtained the duplicate set of samples was for archival purposes.


LOGO

Figure 5.1: Drill Hole Sand Sample

5.2.1.1 Initial Drilling and Sampling Campaigns

The initial drilling and sampling campaigns were conducted in 2017 and utilized widely spaced exploration drill holes, with nominal spacing of 3,000 ft to 4,500 ft between drill holes (one hole drilled per section of controlled property). These exploration campaigns were aimed at determining the depth and lateral extent of the sand deposits across the Kermit and Monahans properties. Drilling and sampling results for each property were reviewed, and areas were identified as potential locations to commence mining operations.


JOHN T. BOYD COMPANY


5-3


Westward retained Boart Longyear to drill the Kermit and Monahans properties, resulting in 36 holes drilled and sampled on the Kermit Property over the period of June to July 2017, and 53 holes drilled and sampled on the Monahans Property over the period June to August 2017.

All sample analyses conducted in the initial drilling and sampling campaigns were performed by PropTester in Cyprus, Texas.

5.2.1.2 Infill Drilling and Sampling Campaigns

When the initial drilling and sampling campaigns were completed and the associated lab testing results were reviewed, Atlas retained BOYD to design an infill drilling campaign within the designated initial mining areas of each property. The ultimate goal of the 2018 infill drilling campaigns was to be able to classify the designated initial mining areas of each property as Proven and Probable Reserves.

Westward supervised the drilling activities and performed geological logging and sampling. In order to expedite the infill drilling and sampling campaigns, two drilling companies were used, both utilizing very similar track mounted Rotosonic drilling rigs. Boart Longyear performed drilling work on the Kermit Property, and Yellow Jacket Drilling performed drilling work on the Monahans Property.

Both infill drilling campaigns were completed in March 2018, with an additional 25 holes being drilled and sampled on the Kermit Property, and 27 holes being drilled and sampled on the Monahans Property. As a result of the infill drilling program, each property now had a nominal 1,500-ft drill hole spacing within their designated initial mining areas.

Sieve (gradation) analyses on the samples collected were performed by PropTester, FracTAL, and Lonquist. Crush testing and API RP-19C/ISO 13503-2 testing (proppant characteristic testing) was performed by PropTester on three separate entire hole composite samples created from select drill hole samples for each property.


JOHN T. BOYD COMPANY


5-4


Table 5.1 below presents a summary of the drilling and sampling programs completed on each property.

Table 5.1: Atlas Drilling and Sampling Summary


     Rotosonic Holes Drilled and Sampled  
     Initial*      Infill**      Combined  

Kermit Property

     36        25        61  

Monahans Property

     53        27        80  


Total

     89        52        141  


*

Drilled and sampled June to August 2017

**

Drilled and sampled March 2018

Refer to Figures 3.1 and 3.2, which show drill hole locations within the Kermit and Monahans properties, respectively.

5.2.2 Frac Sand Quality Testing

Sample preparation and testing was completed in generally the same manner for each property and each drilling campaign. After samples were delivered to the respective testing laboratory, they were catalogued and then prepared for analysis. Sample preparation generally consisted of thoroughly mixing a sample and obtaining a large enough amount of material to perform the required analysis. Prepare samples were dried, weighed, washed over a 200-mesh sieve, dried again, and then weighed again in order to determine the percentage of material that may remain after going through a wash plant. The remaining sample material was further split through a riffle splitter to create multiple samples that may be used for individual sieve analyses, and any further testing required.

For the initial drilling and sampling campaigns, PropTester performed the sieve (gradation) analyses on samples from both the Kermit and Monahans Properties.

The infill drilling and sampling campaign lab testing was split up between different labs, in order to expedite analyses of drilling samples. The Kermit Property infill drilling and sampling sieve (gradations) analyses were performed by both PropTester and FracTAL. PropTester created composite samples and performed the crush tests and API RP-19C/ISO 13503-2 testing. The Monahans property infill drilling and sampling sieve analyses were performed by Lonquist, while PropTester again prepared composite samples and performed the crush tests and the API RP-19C/ISO 13503-2 testing.


JOHN T. BOYD COMPANY


5-5


5.2.3 Other Exploration Methods

No other methods of exploration, such as airborne or ground geophysical surveys, were reported to BOYD by Atlas for either the Kermit Property or the Monahans Property.

5.3 Laboratory Testing Results

The relatively uniform and clean nature of the sampled dune deposits underlying the Kermit and Monahans properties, combined with laboratory testing results, indicated that the subject properties would yield a combination of 40/70-mesh and 70/140-mesh proppant sand products that meet customer specifications for in-basin proppant sand applications within the Permian basin.

5.3.1 Laboratory Testing

5.3.1.1 Grain Size Distribution

Grain size distribution was analyzed according to API RP-19C /ISO 13503-2, Section 6. The weighted average grain size distribution, based on laboratory testing results, as contained within the in-place sand resources for each property is presented in Table 5.2.


Table 5.2: Grain Size Distribution

 
     Approximate In-Place Product Distribution  
     % Retained By Mesh Size      % Product  

Property

   + 40      40/70      70/140      -140      40/70      70/140  

Kermit

     1.6        46.6        37.1        14.7        54.9        45.1  

Monahans

     2.9        54.4        34.4        8.3        61.2        38.8  

The grain size distribution data highlights the relative fineness of the sand found within Atlas’ properties and indicates that a majority of the sand particles are concentrated between the passing 40-mesh and retained 140-mesh size fraction. Accordingly, the predominant marketable product from Atlas’ Kermit and Monahans properties consist of the 40/140-mesh size sands. Refer to Figures 5.2 and 5.3 for percent of in-place frac sand material isopleths, 40/70-mesh and 70/140-mesh respectively, for the Kermit Property, and Figures 5.4 and 5.5 for percent of in-place frac sand material isopleths, 40/70-mesh and 70/140-mesh respectively, for the Monahans Property.

5.3.1.2 Grain Shape (Sphericity and Roundness)

Grain shape was analyzed according to API RP-19C /ISO 13503-2, Section 7. Under this standard, recommended sphericity and roundness values for proppants are 0.6 or greater. As part of the grain shape analysis, the presence of grain clusters (weakly cemented grain aggregates) and their approximate proportion in the sample were reported.


JOHN T. BOYD COMPANY


5-6


5.3.1.3 Crush Resistance

Crush resistance is a key test that determines the amount of pressure a sand grain can withstand under laboratory conditions for a two-minute duration. It is analyzed according to API RP-19C /ISO 13503-2, Section 11. Under this standard, the highest stress level (psi) in which the proppant produces no more than 10% crushed fine material is rounded down to the nearest 1,000 psi and reported as the “K-value” of the material.

5.3.1.4 Acid Solubility

Acid solubility was analyzed according to API RP-19C /ISO 13503-2, Section 8. Under this standard, 5 grams of proppant is treated with 100 ml of 12:3 HCI: HF at 150oF for 30 minutes. The recommended maximum acid solubility for proppants in the 40/70 size range and finer is 3.0%.

5.3.1.5 Turbidity

Turbidity was analyzed according to API RP-19C/ISO 13503-2, Section 9. Under this standard, the suggested maximum frac sand turbidity should be equal to or less than 250 nephelometric turbidity units (NTU).


JOHN T. BOYD COMPANY


5-7


LOGO


5-8


LOGO


5-9


LOGO


5-10


LOGO


5-11


5.3.2 Quality Summary

PropTester and Lonquist performed API RP-19C/ISO 13503-2 tests on composite samples created from sample material collected during the drilling campaigns on the Kermit and Monahans properties. The purpose of this testing was to obtain an indication of the “overall quality” characteristics of the mineable sand materials contained on the subject properties. Three drill holes located within the infill drilling areas of each property were selected to create composite samples, which consisted of samples from the entire depth drilled from each hole selected. The testing labs then created a 40/70-mesh and 40/140-mesh product cut from each drill hole composite, which were analyzed for the full suite of API RP-19C/ISO 13503-2 proppant sand characteristics.

Atlas also performed additional crush testing to check for variability in grain strength throughout the total depth of the mineable sand interval. These additional crush tests were conducted on every 10-ft sample interval from two additional drill holes on each property. Overall, this extensive testing indicated relatively uniform range of crush values through the entire depth of the deposit, with the exception of one or two intervals where a caliche interval was not completely removed before performing the crush tests. Results from the intervals containing caliche were about 1,000 psi less than all other intervals tested, and as such were not included in the summary quality data.

Combining the extensive crush testing conducted with the API testing performed on the composite samples, Atlas has completed a comprehensive review of grain characteristics for each of the reserve areas within the subject properties. The data indicate little variability within the overall mineable deposit of each property.

BOYD opines that the methodologies utilized during exploration, sampling, handling, security, preparation, and testing procedures generally meet standard industry practice, and present an unbiased overview of the deposits contained in the subject properties.


JOHN T. BOYD COMPANY


5-12


Sample testing results are summarized in Table 5.3 below for each product size analyzed within each property:


Table 5.3: Proppant Performance Test Results for Kermit and Monahans
     Average ISO/API Test Results By Product Size and Property
     40/70-mesh    40/140-mesh*,**

Test

   Kermit    Monahans    Recommended
Specification
   Kermit    Monahans

Sphericity

   0.7    0.7    ≥ 0.6    0.7    0.7

Roundness

   0.8    0.7    ≥ 0.6    0.7    0.7

Acid Solubility (%)

   1.1    0.9    ≤ 3.0    2.6    1.6

Turbidity (NTU)

   15.0    7.0    ≤ 250    15.0    13.0

K-Value (000 psi)

   7 - 8    7 - 8    —      10 - 11    10 - 11


*

100-mesh proppant sand material currently does not have an API/ISO specification.

**

Test results were for a single 40/140-mesh product.

5.4 Data Verification

While BOYD was not involved in the field work portions of the drilling and testing campaigns, the procedures used in each phase are considered to be appropriate. The resulting data provided from these campaigns, combined with subsequent laboratory testing results, are deemed to be adequate for the purposes of the technical report summary, and serve as the basis of BOYD’s estimate of resources and reserves underlying the Atlas Kermit and Monahans properties. In April 2018, BOYD representatives visited and toured both Atlas properties, at which time we reviewed a sample of exploration drilling locations, examined core samples, observed plant construction activities, and discussed various aspects of operating plans for each of the subject properties.


JOHN T. BOYD COMPANY


6-1


6.0 FRAC SAND RESOURCES AND RESERVES

6.1 Applicable Standards and Definitions

Unless otherwise stated, frac sand resource and frac sand reserve estimates disclosed herein are completed in accordance with the standards and definitions provided by S-K 1300. It should be noted that BOYD considers the terms “mineral” and “frac sand” to be generally interchangeable within the relevant sections of S-K 1300.

Estimates of any mineral resources and reserves are always subject to a degree of uncertainty. The level of confidence that can be applied to a particular estimate is a function of, among other things: the amount, quality, and completeness of exploration data; the geological complexity of the deposit; and economic, legal, social, and environmental factors associated with mining the resource/reserve. By assignment, BOYD used the definitions provided in S-K 1300 to describe the degree of uncertainty associated with the estimates reported herein.

The definition of mineral (frac sand) resource provided by S-K 1300 is:

Mineral resource is a concentration or occurrence of material of economic interest in or on the Earth’s crust in such form, grade or quality, and quantity that there are reasonable prospects for economic extraction. A mineral resource is a reasonable estimate of mineralization, taking into account relevant factors such as cut-off grade, likely mining dimensions, location or continuity, that, with the assumed and justifiable technical and economic conditions, is likely to, in whole or in part, become economically extractable. It is not merely an inventory of all mineralization drilled or sampled.

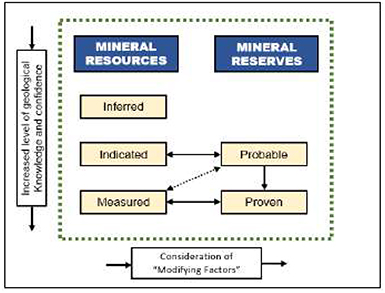
Estimates of frac sand resources are subdivided to reflect different levels of geological confidence into measured (highest geologic assurance), indicated, and inferred (lowest geologic assurance)

The definition of mineral (frac sand) reserve provided by S-K 1300 is:

Mineral reserve is an estimate of tonnage and grade or quality of indicated and measured mineral resources that, in the opinion of the qualified person, can be the basis of an economically viable project. More specifically, it is the economically mineable part of a measured or indicated mineral resource, which includes diluting materials and allowances for losses that may occur when the material is mined or extracted.


JOHN T. BOYD COMPANY


6-2


Estimates of frac sand reserves are subdivided to reflect geologic confidence, and potential uncertainties in the modifying factors, into proven (highest assurance) and probable.

Figure 6.1 shows the relationship between frac sand resources and frac sand reserves.


LOGO

Figure 6.1: Relationship Between Frac Sand Resources and Frac Sand Reserves

In this report, the term “frac sand reserves” represent the tonnage of frac sand products that meets customer specifications and will be available for sale after processing of the ROM sand.

6.2 Frac Sand Resources

6.2.1 Methodology

BOYD independently prepared separate estimates of in-place frac sand resources for Atlas’ Kermit and Monahans operations by performing the following tasks:


  1.

Available drilling logs and laboratory testing results were compiled and reviewed to check for accuracy and to support development of each operation’s geologic model. The geologic databases utilized for modeling and estimation consist of results from 61 drill holes completed on the Kermit Property, and 80 drill holes completed on the Monahans Property. The geologic data were imported into Carlson Software, a geologic modeling and mine planning software suite that is widely used and accepted by the mining industry.


JOHN T. BOYD COMPANY


6-3


  2.

A geologic model of each deposit was created in Carlson Software using industry-standard grid modeling methods well-suited for simple stratigraphic deposits. Each geologic model delineates the top and bottom of the mineable sand horizon and the distribution of the product size fractions across the deposits. The top and bottom of the mineable frac sand interval were established as follow:


  a.

As there is minimal overburden material across the subject properties, the top of the mineable sand interval was defined as the current ground surface, as provided by a combination of originally flown aerial topographic surveys and recently surveyed active mining pits.


  b.

The bottom of the mineable sand interval on both Atlas properties was determined by Westward geologists and geological technicians present during the various exploration and sampling campaigns. Westward defined the bottom of the mineable sand interval as the depth at which a drilled interval no longer contained sand as either the first or second most abundant material present.

Overall mineable frac sand thicknesses based on the defined top and bottom noted above, are presented in Figures 6.2 and 6.3, for the Kermit and Monahans properties, respectively.


  3.

After reviewing the continuity and variability of the deposit, suitable resource classification criteria were developed and applied as per the discussion in Section 6.2.2.


  4.

BOYD then reviewed the proposed initial mining regions identified by Atlas management. Estimation of the in-place frac sand resources for the Kermit and Monahans properties assumes mining operations using a combination of standard surface excavation equipment for the near-surface initial operations and dredging equipment once initial excavation had reached appropriate depths. This sequence of operating is widely utilized for mining of similar deposit types. As such, the estimates were subject to the following setbacks and slope requirements:


  a.

50 ft inside of property lines.


  b.

100 ft from pipelines.


  c.

50 ft around the wet and dry process plant areas and main access road/right of way.


  d.

An overall pit wall slope of 3:1 (approximately 19 degrees).


  5.

In-place volumes for each property were estimated from the geologic model within Carlson Software. A dry, in-place, bulk density of 100 pounds per cubic foot was used to calculate the in-place tonnage of frac sand.


JOHN T. BOYD COMPANY


6-4


LOGO


6-5


LOGO


6-6


BOYD utilized the provided updated pit survey information for each of Atlas’ subject properties to estimate in-place frac sand resources as of June 30, 2021, which were then updated using actual Q3 and Q4 2021 reported production data to determine frac sand resources for the Kermit and Monahans properties as of December 31, 2021.

6.2.2 Classification

Geologic assuredness is established by the availability of both structural (thickness and elevation) and quality (size fraction) information for the deposit. Resource classification is generally based on the concentration or spacing of exploration data which can be used to demonstrate the geologic continuity of the deposit. When material variations in thickness, depth, and/or sand quality occur between drill holes, the allowable spacing distance between drill holes is reduced. The following drill hole spacing criteria were established by the Qualified Person after review of the available exploration data and geologic models and used to classify the frac sand resources of the Kermit and Monahans mines:

Table 6.1: Kermit and Monahans Properties Drill Hole Spacing Parameters


Classification

   Spacing Requirement (ft)
(Nominal Maximum)
 

Measured

     1,500  

Indicated

     2,500  

Inferred

     5,000  

The Qualified Person has determined that all of the estimated frac sand resources within the Kermit and Monahans mine plan areas are classified as either Measured or Indicated Resources. However, due to the extensive size of each of the subject properties, additional reportable Inferred Resource areas, as well as Exploration Results areas also exist within each property boundary.

BOYD is of the opinion that there is a low degree of uncertainty associated with each of the resource classifications.

6.2.3 Frac Sand Exploration Results Areas

Due to the extensive acreage of land that Atlas has secured mineral rights to on the Monahans Property (approximately 32,224 “gross” acres in total), there are significant areas within this property that, while some exploration was performed, the distance between drill holes falls outside of the defined parameters noted in Section 6.2.2. These Exploration Results Areas are isolated to the outer-most portions of the Monahans Property; no Exploration Results Areas exist on the Kermit Property.


JOHN T. BOYD COMPANY


6-7


Exploration Results Areas have less geologic confidence than Inferred Resources and are not quantifiable or reportable under the S-K 1300 guidelines. The intent of disclosing the acreage in Table 6.2 is generally to let the reader know that even beyond the extensive quantity of reportable resources and reserves, there is a high likelihood of additional sand available once additional exploration is complete. Exploration results from this portion of the deposit exhibits similar characteristics, both in thickness and frac sand quality to the resources and reserve areas. The following table presents a summary of characteristics of the Monahans Property Exploration Results Areas, based on drilling and sampling data completed to date.

Table 6.2: Exploration Results Area Deposit Characteristics, Monahans Property


            Total Drill      Sand Thickness (ft)  

Property

   Acres      Hole Count      Min      Max      Average  

Monahans

     9,575        8        13        115        58  

6.2.4 Frac Sand Resource Estimate

Significant amounts of reportable frac sand resources, excluding those being converted to frac sand reserves within each property’s mine plan area, exist for both the Kermit and Monahans properties. These quantities of reportable frac sand resources fall within the defined boundaries of the Kermit and Monahans properties and are not reported as frac sand reserves, however they are considered to be potentially material to each operation. Reportable resources must have demonstrated geoscientific information based on varying levels of drilling, sampling, and laboratory testing results. The quantities of frac sand resources are presented in the following table, as an estimate of In-Place Resources, contained in both the Kermit and Monahans properties.


JOHN T. BOYD COMPANY


6-8


Table 6.3: In-Place Frac Sand Resources, Kermit and Monahans Operations

Resource

Category


Acres


Average

Sand

Thick. (ft)


Estimated ln-Place Frac Sand Tons (000)


Owned


Leased


Adverse


Total


Kermit Operation

Measured

   65       —      9,700    —      9,700

Indicated

   603       —      95,390    —      95,390

Inferred

   1,719       38,904    197,750    56,636    293,290


   2,387    79    38,904    302,840    56,636    398,380

Monahans Operation

Measured

   454          64,144    —      64,144

Indicated

   809       —      108,726    —      108,726

Inferred

   8,906       —      1,093,869    —      1,093,869


   10,169    60    —      1,266,739    —      1,266,739

6.2.5 Validation

BOYD independently estimated in-place Exploration Results Areas and Resources for the Kermit and Monahans operations based on the provided drilling, sampling, and testing data obtained by Atlas. Utilizing industry-standard grid modeling techniques we have estimated volumes of frac sand present on each property, as indicated by such data. Based on our review of Atlas’ well-documented geologic exploration and sampling methods, we are of the opinion that the data provided are reasonable and appropriate. Furthermore, it is our opinion that the estimation methods employed are both appropriate and reasonable for the deposit type and proposed extraction methods.

6.3 Frac Sand Reserves

6.3.1 Methodology

Estimates of frac sand reserves for the Kermit and Monahans operations were derived contemporaneously with estimates of frac sand resources. To derive an estimate of saleable product tons (proven and probable frac sand reserves), the following modifying factors were applied to the in-place measured and indicated frac sand resources underlying the respective mine plan areas:


A 95% mining recovery factor which assumes that 5% of the mineable (in-place) frac sand resource will not be recovered for various reasons. Applying this recovery factor to the in-place resource results in the estimated ROM sand tonnage that will be delivered to the wet process plant.


JOHN T. BOYD COMPANY


6-9


Overall processing recoveries, based on exploration sample gradation testing, are 80.9% for the Kermit Operation, and 87.6% for the Monahans Operation. These recovery factors account for removal of out-sized (i.e., larger than 40-mesh and smaller than 140-mesh) sand and losses in the wet processing plant, and minor dry processing plant inefficiencies.

The overall product yields (after mining and processing losses) for the Kermit and Monahans operations is estimated at 77% and 83%, respectively. That is, for every 100 tons of in-place frac sand resources mined, approximately 77 tons will be recovered and sold as product from the Kermit Operation, while approximately 83 tons will be recovered and sold as product from the Monahans Operation.

BOYD estimated reserves on the subject properties utilizing provided current mining pit depths as of June 30, 2021, together with third quarter 2021 actual production data. At the request of Atlas, BOYD applied projected mining for fourth quarter 2021, to arrive at an estimate of frac sand reserves for the Kermit and Monahans operations, as of December 31, 2021.

6.3.2 Classification

Proven and probable frac sand reserves are derived from measured and indicated frac sand resources, respectively, which have a life-of-mine projected mine plan developed in accordance with S-K 1300. BOYD is satisfied that the frac sand reserve classifications reflect the outcome of technical and economic studies. Figures 6.3 and 6.4 illustrate the reserve classifications of the Kermit and Monahans Operations, respectively.

6.3.3 Frac Sand Reserve Estimates

Atlas’ estimated surface mineable frac sand reserves for the Kermit Operation totals approximately 198 million saleable product tons, as of December 31, 2021.

Estimated surface mineable frac sand reserves for Atlas’ Monahans Operation total approximately 170 million saleable product tons, as of December 31, 2021.

A forecasted sales price of $30.00 per ton sold was used for all products sold from the Kermit and Monahans operations (refer to Chapter 11, Sections 11.2.4.1 and 11.3.4.1 for additional information). The economic analyses performed on the Kermit and Monahans operations support the statement of frac sand reserves herein for the Kermit and Monahans operations (refer to Chapter 12 for additional information pertaining to the respective economic analyses).


JOHN T. BOYD COMPANY


6-10


The following table presents the estimated Reserve tons by product (size), that are anticipated to be produced at Atlas’ Kermit and Monahans Operations.


Table 6.4: Reserves as of December 31, 2021, Atlas’ Kermit and Monahans Operations

Atlas Energy Solutions, Kermit and Monahans Reserves (As of December 31, 2021)


Tons (000) By Classification and Mesh Size

   Total     
    

Proven


Probable


By Mesh Size


Control


40/70


70/140


Total


40/70


70/140


Total


40/70


70/140


Total

Kermit Operation

Owned

   78,955    61,217    140,172    —      —      —      78,955    61,217    140,172

Leased

   28,580    24,433    53,013    2,599    2,232    4,831    31,179    26,665    57,844


Total

   107,535    85,650    193,185    2,599    2,232    4,831    110,134    87,882    198,016

Monahans Operation

Leased

   71,886    46,739    118,625    32,041    19,057    51,098    103,927    65,796    169,723

The reported reserves include only frac sand which is reportedly leased or owned as of December 31, 2021.

Atlas owns approximately 140.2 million product tons on the Kermit Operation, or 71% of the current frac sand reserves for this operation, with the remainder held under lease agreements.

At the Monahans Operation, Atlas holds leases for all reported reserves.

The frac sand reserves contained in Atlas’ Kermit and Monahans operations are well-explored and defined. It is our conclusion that over 97% of the stated reserves at the Kermit Operation, and nearly 70% of the stated reserves at the Monahans Operation, can be classified in the proven reliability category (the highest level of assurance) with the remainder classified as probable.

The estimated product distribution of the frac sand reserves is based on a combination of available laboratory gradation test data and actual production yields provided by Atlas. Grain size distribution and overall yields may vary based on the depth and location at which mining occurs.


JOHN T. BOYD COMPANY


6-11


The subject operations, and other fracs and operations in the area, have a well-established history of mining and selling frac sand products into the local Permian Basin energy fields. BOYD has assessed that sufficient studies have been undertaken to enable the frac sand resources to be converted to frac sand reserves based on current and proposed operating methods and practices. Changes in the factors and assumptions employed in these studies may materially affect the frac sand reserve estimate.

The extent to which the frac sand reserves may be affected by any known geological, operational, environmental, permitting, legal, title, variation, socio-economic, marketing, political, or other relevant issues has been reviewed as warranted. It is the opinion of BOYD that Atlas has appropriately mitigated, or has the operational acumen to mitigate, the risks associated with these factors. BOYD is not aware of any additional risks that could materially affect the development of the frac sand reserves.

Based on our independent estimate and operations review, we have a high degree of confidence that the estimates shown in this report accurately represent the available frac sand reserves controlled by Atlas, as of December 31, 2021.


JOHN T. BOYD COMPANY


7-1


7.0 MINING OPERATIONS

7.1 Mining Method

The Kermit and the Monahans mines both employ dredging as the primary sand extraction method. Most of the mineable area at both locations has minimal overburden and vegetation; as such, sand excavation normally begins at the surface throughout most of the mine plan area. Traditional excavator/truck dry mining methods are used as a backup to dredge mining. A general flow diagram of the dredging operation is illustrated in Figure7.1. The dry mining method is typically employed on the higher areas at the surface of the deposit where removal by dredging is difficult. The water forming the dredge ponds is sourced from a shallow aquifer which lies below each property. Both properties utilize a common suction dredge. The dredge is a floating barge that lowers an arm or “ladder” with an attached submersible pump to the bottom of the deposit. Sand is pumped through poly pipe to the mine skid where material greater than 1.5mm in size is removed. The sand is then further pumped to the wet plant with tailings and excess water retuning to the dredge pit.


LOGO

Figure 7.1: Simple Mining Flow Diagram

7.2 Mine Schedule, Equipment, and Staffing

Both mine sites operate continuously the entire year.

Between the two mine sites and the remote operations and loadout functions performed in Austin, there are 113 employees as of the effective date of this report.

Although the two dredges are the primary means of mining the deposit, additional support equipment is needed for various functions throughout the mine and plant. The primary mobile equipment involved in the sand excavation, processing, and loading (other than the dredges) includes excavators, dozers, front-end loaders, skid steers, telehandlers, water trucks, personnel lifts, motor graders, sweepers and vac trailers.


JOHN T. BOYD COMPANY


7-2


Various fuel tanks, lube tanks, and other storage tanks are also located throughout each of the operations.

7.3 Mine Historical and Forecast Production

7.3.1 Historical Mine Production

Atlas produces predominantly 40/70-mesh and 100-mesh (70/140-mesh) frac sand products for sale into the Permian Basin. All of the products are trucked to their final destination.

The sand is mined, processed, stored, and shipped from both of the facilities by highway truck. Production from the operations commenced in July 2018 at Kermit and October 2018 at Monahans. Historic production for years 2020 and 2021 is presented in Table 7.1 below:

Table 7.1: Historic Frac Sand Production (ROM ‘000)


     Year 2020      Year 2021  

Kermit

     3,496        4,862  

Monahans

     3,805        4,418  

7.3.2 Forecasted Production

Forecasted ROM sand production is estimated as follows:

Table 7.2: Forecasted ROM Production Tons


ROM tons (000)    Year 2022      Year 2023      Year 2024      Year 2025      Year 2026  

Kermit

     5,972        5,972        5,972        5,972        5,972  

Monahans

     5,630        5,630        5,630        5,630        5,630  

7.4 Mine Plan (Life-of-Mine)

7.4.1 Kermit

As of December 31, 2021, the reserve estimate for the Kermit site is estimated at 198,016,000 tons. Atlas has developed a long range mine plan, as illustrated in Figure 7.2, for the extraction of these reserves. The plan utilizes the following assumptions:


Dredge depth ranging from 78 ft to 104 ft below land surface.


Pumping approximately 6.1 to 6.3 million ROM tons per year.


Mine life of currently planned reserve of approximately 41 years to 2063.


Additional controlled Resource property not outlined in current mine plan.


JOHN T. BOYD COMPANY


7-3


Figure 7.2


LOGO


JOHN T. BOYD COMPANY


7-4


7.4.2 Monahans

As of December 31, 2021, the reserve estimate for the Monahans site is estimated at 169,723,000 tons. The current mine plan is illustrated in Figure 7.3.


Dredge depth ranging from 67 ft to 91 ft below land surface.


Pumping approximately 5.8 million ROM tons per year.


Mine life of currently planned reserve of approximately 28 years to 2050.


Approximately six years (2050 to 2056) of additional Reserve available not shown on plan.

Additional controlled Resource property not outlined in current mine plan.

7.4.3 Mining Risk

Surface mines face two primary types of operational risks. The first category of risk includes those daily variations in physical mining conditions, mechanical failures, and operational activities that can temporarily disrupt production activities. Several examples are as follows:


Process water spot shortages.


Power curtailments.


Variations in grain size consistency.


Encountering excessive clay and other waste material.


Failures or breakdowns of operating equipment and supporting infrastructure.


Adverse weather disruptions (power outages, dust storms, excessive heat etc.)

The above conditions/circumstances can adversely affect production on any given day but are not regarded as “risk issues” relative to the long-term operation of a mining entity. Instead, these are considered “nuisance items” that, while undesirable, are encountered on a periodic basis at many mining operations. BOYD does not regard the issues listed above as being material to both mining operations or otherwise compromising its forecasted performance.

The second type of risk is categorized as “event risk.” Items in this category are rare, but significant occurrences that are confined to an individual mine, and ultimately have a pronounced impact on production activities and corresponding financial outcomes. Examples of event risks are major fires or extreme droughts, floods, or unforeseen geological anomalies that disrupt extensive areas of proposed or operating mine workings and require alterations of mining plans. Such an event can result in the cessation of production activities for an undefined but extended period (measured in months, and perhaps years) and/or result in the sterilization of frac sand reserves. This type of risk is minimal in a relatively simple surface sand mining operation.


JOHN T. BOYD COMPANY


7-5


Figure 7.3


LOGO


8-1


8.0 PROCESSING OPERATIONS

8.1 Overview

The two process plants were constructed internally by Atlas with work directed and supervised by experienced project managers having frac sand plant process and erection experience. Each plant has a nominal capacity of approximately 5.5 Mtpy of finished product. The Kermit Plant was commissioned in July 2018 and the Monahans Plant was commissioned on October 31, 2018. The predominant frac sand products produced at the operations include 40/70-mesh and 40/140-mesh products. The Kermit process plant, both wet and dry, has an overall process yield of approximately 81%. For every 100 tons ton of ROM dredged material fed into the wet plant, approximately 81 tons of finished product is produced. Similarly, the Monahans process plant has an approximate process yield of 88%. The estimated process yields reported are the average laboratory yield from the drill hole samples representative of entire property. Actual reported operating yields may be higher or lower based on the location and depth of mining. Current reported process yields are estimated at approximately 90%.

Both process operations are similar and consist of the following activities:


Wet Process Plant- ROM material from the dredge is pumped to the wet plant and the greater than 40-mesh and less than 140-mesh sand and silt material is removed.


Dry Process Plant- The wet 40/140-mesh material produced by the wet process plant is dried and screened into finished products.


Storage and Loadout- Finished products are stored in silos and gravity loaded from under the silos into highway trucks for transport to the customer. The Atlas loadout operates 24 hours per day, 7 days per week every day of the year.


JOHN T. BOYD COMPANY


8-2


A general layout of both operations is illustrated in Figure 8.1:


LOGO

Figure 8.1: General Arrangement Layout of Plant

8.2 Wet Process Plant

The wet process plant does not crush the material, but predominantly washes and classifies (i.e., sizes) the sand. The resultant 40/140-mesh material is stockpiled as a feed for the dry plant. Sand is pumped from the dredge pit to the wet plant where it is dewatered and deslimed. Material is then liberated of clays and other deleterious material from the sand grains. Rinse water is added and then removed carrying away any contamination and the water is recycled. The closed loop process water circuit should allow for efficient use of water as the majority is collected and recycled in the process. Water conservation is a high priority at the operation. Washed sand is stored in two large, washed sand stockpiles where it naturally decants in preparation for dry processing.

8.3 Dry Process Plant

The dry process utilizes three dryers operating in parallel to complete the drying process. The dryers are fueled by line natural gas. After drying, the sand is conveyed to the screen tower where multi-deck screeners remove oversized material as well as segregate the 40/70-mesh and 40/140-mesh products.


JOHN T. BOYD COMPANY


8-3


An on-site quality laboratory samples and monitors production and shipping sand quality daily.

8.4 Product Storage/Truck Loadout

The Atlas loadout operates 24 hours per day, 7 days per week every day of the year. Both of the facilities have seven under silo product loadouts with truck scales. Figures 8.3 and 8.4 illustrate the overall layout of each plant including the truck under silo product loadouts. All of the frac sand products are trucked to the well site from the facilities.


LOGO

Figure 8.3: Kermit Plant with Truck Loadouts


LOGO

Figure 8.4: Monahans Plant with Truck Loadouts


JOHN T. BOYD COMPANY


9-1


9.0 MINE INFRASTRUCTURE

On-site facilities at each site include a scale house, office, shop, and a quality laboratory located in the dry process plant. The surface facilities currently located at the mine are well constructed and have the necessary capacity/capabilities to support both of the operations. Operational preference may constitute the upgrading of some existing facilities if the operation expands in the future.

9.1 Utilities (Power and Natural Gas)

Each plant is supplied three-phase line power. Substations access 138 kV line and step voltage down to a 12.5 kV line which delivers power to the plants. Line natural gas is supplied to both plants. Natural gas line capacity and substation capacity at both plants is sufficient to serve much more than 100% of Atlas’s current requirements.

9.2 Process Water

Plant process water is recycled within the plants and is pumped from the dredge pond reservoir. Additional makeup water is obtained from wellfields near the plants. The wells are only utilized as a backup water supply.


10-1


10.0 MARKET ANALYSIS

The Permian Basin’s (Permian) frac sand market is driven by unconventional horizontal drilling in the oil and gas industry. In the late 1990s, rapid advances in horizontal drilling and hydraulic fracturing (fracking) in North America ushered in large-scale commercial oil and gas production. This fracking technique has been increasingly successful and modified over time to extract oil and gas held in dense layers of shale rocks, whose low permeability had previously prevented the flow of hydrocarbons.

Hydraulic fracturing uses a mixture of water, chemicals, and proppant (natural sand or man-made sand-like substances) to fracture shale rock and release hydrocarbons such as oil, natural gas, and natural gas liquids. The proppant acts to keep the fractures open (prop) while the pressurized fluids flow back up the well piping. Wells have become more productive with the addition of horizontal drilling capabilities, longer lateral lengths, and multi-stage fracks.

North America’s shale oil industry’s growing competitiveness gained through continuous technology improvement and falling production costs have had major implications on the global energy market. Oilfield service companies, including frac sand producers, made significant cuts in 2020 to survive lower commodity prices because of the COVID-19 pandemic. Figure 10.1 illustrates the CME Group’s West Texas Intermediate (WTI) Crude Oil Annual Average Futures Price. We estimate breakeven pricing for unconventional oil wells in the Permian to be in the $30 to $40 per barrel range, with some areas in the mid $20s per barrel. 2021 WTI futures pricing showed a strong recovery following the 2020 COVID-19 impact.


JOHN T. BOYD COMPANY


10-2


LOGO

Figure 10.1: WTI Crude Oil CME Futures Price

Permit submissions for horizontal oil and gas wells in the Permian indicate a continuation of strong drilling ahead. According to industry analysts, the number of permits filed per working rig this summer is tracking at multi-year highs as evidenced in Figure 10.2 below.


LOGO

Figure 10.2: Permian Basin HZ Permit Submissions vs. Rigs


JOHN T. BOYD COMPANY


10-3


Over the previous 52 weeks, rig counts in the Permian are up approximately 111%. This has led to increased production for both crude oil and natural gas. For the same time period, crude oil (barrels per day) and natural gas production (thousand cubic feet per day) in the Permian are up 10% and 9%, respectively. As Figure 10.3 illustrates, Permian daily crude oil production is nearing its pre-pandemic impacted peak, while daily natural gas production in the Permian continues to make new records and now stands at 18.6 billion cubic feet per day.


LOGO

LOGO


Figure 10.3: Permian Oil Production and Natural Gas Production

The U.S. Energy Information Administration Drilling Productivity Report reports that the inventory of drilled but uncompleted wells (DUCs) in the Permian Basin have declined 43% since peaking in July 2020 (refer to Figure 10.4). This data dovetails with increased crude oil and natural gas production in the basin.


LOGO

Figure 10.4: Permian Drilled but Uncompleted Wells


JOHN T. BOYD COMPANY


10-4


Consequently, with increases in production and well completions, activity at frac sand mines in the Permian Basin have increased. According to MSHA, operating hours for the second quarter of 2021 for Permian Basin frac sand mines were up 20% sequentially. In fact, only two mines saw a material decrease in hours from Q1 2021 to Q2 2021 while several had increases of more than 80% sequentially.


LOGO

Figure 10.5: Permian Wide In-Basin Mine Hours (Quarterly)

Industry research posits that all but one frac sand mine in the Permian Basin is fully operational. However, total in-basin mine hours are still about 45% below peak. Mine hours serve as a directional indicator which dovetails with previous crude oil and natural gas production and DUC data. Current frac sand production in the Permian Basin is estimated to be nearing its prior peak production of about 70 million tons per year leading to stable pricing in the basin. BOYD anticipates stable frac sand pricing with a slight upside bias due to potential supply chain disruptions and high commodity input costs.


JOHN T. BOYD COMPANY


11-1


11.0 CAPITAL, REVENUES, AND OPERATING COSTS

11.1 Introduction

This chapter will contain two main sections, one for the Kermit operation and one for the Monahans operation. Each section will address similar topics in their respective subsections.

Atlas commenced processing operations at the Kermit Operation in July 2018 and at the Monahans Operation in October 2018. Atlas provided BOYD with financial data for the years 2020 and 2021.

BOYD reminds the reader of this document of the significant effect the COVID-19 pandemic had on drilling and fracking activities in the Permian Basin and the oil & gas industry in 2020. As such, the reader should consider this point when reviewing Year 2020.

11.2 Kermit Operation

11.2.1 Historical Capital Expenditures

Table 11.1 presents Kermit’s annual CapEx for years 2020 and 2021 and is based on fixed asset data provided by Atlas.


Table 11.1: Kermit Historical Capital Expenditures  


CapEx ($000)  


Year 2020

     1,297  

Year 2021*

     4,820  


Total

     6,117  


*

Includes Construction in Progress (CIP)

11.2.2 Historical Revenues and Sales

Table 11.2 presents Atlas’ historical sales data for years 2020 and 2021. Prices have improved in Year 2021 from the low prices experienced in Year 2020. Atlas’ Year 2021 sales were 4.2 million tons, a 31% increase from Year 2020, which was impacted by the COVID-19 pandemic.


JOHN T. BOYD COMPANY


11-2


Table 11.2: Kermit Historical Sales Data  


     Year 2020      Year 2021  

Tons sold (000)

     3,208        4,204  

Revenues ($000)

     38,728        73,836  

Product Pricing ($ per ton sold)

     12.07        17.56  

11.2.3 Historical Cost of Production

Table 11.3 presents Kermit’s historical Cash Cost of Production for years 2020 and 2021.


Table 11.3: Kermit Historical Cost of Production  


     Year 2020      Year 2021  

Cash Cost of Production ($ 000)

     23,032        28,942  

$ per ton sold

     7.18        6.88  

Cost of Production represents the costs incurred in the association with the mining, wet processing, dry processing, product loadout, maintenance, quality control, property taxes, and other related operating costs, and includes royalty expense (as discussed in Chapter 3, section 3.3).

11.2.4 Projected Production, Sales, and Costs

BOYD was provided production, sales, and cost projections for the Kermit Operation. Forecasted financial data, product pricing, and costs are in 2021 constant dollars. BOYD opines that the production and financial projections are reasonable and are likely to be within ± 20% accuracy level.

11.2.4.1 Production and Sales Projections

Annual forecasted ROM production of approximately 6.0 Mtpy is based on the dry plant producing 4.9 Mtpy of saleable product after a processing (wet and dry processing plant) loss of approximately 18%, as discussed in Chapter 6. Forecasted dry processing plant production is within the operation’s current infrastructure capacities and capabilities.

As noted in Table 11.4, the dry processing plant is projected to product approximately 4.9 Mtpy of saleable product consisting of 40/70-mesh and 40/140-mesh products, as discussed in Chapter 6.


JOHN T. BOYD COMPANY


11-3


The forecasted sales price of $30 per ton sold, for all products, presented in Table 11.4 is based on average product prices for the first two months of 2022, as provided by Atlas, and reflects a significant rebound from years 2020 and 2021 prices. We opine that this is a reasonable price projection.


Table 11.4: Kermit Sales Projections  


     Year 2022      Year 2023      Year 2024      Year 2025      Year 2026  

Tons Sold (000)

     4,900        4,900        4,900        4,900        4,900  

Revenues ($000)

     147,000        147,000        147,000        147,000        147,000  

Product Pricing ($ per ton sold)

     30.00        30.00        30.00        30.00        30.00  

11.2.4.2 Operating Cost Projections

Table 11.5 below, presents the cash cost projections for the period 2022 through 2026. Operating cost projections were provided by Atlas and are based on prior year and current year actuals. BOYD considered their estimates to be reasonable. However, adjustments were made based on our review of historical operating costs as well other information and our experience with such operations.


Table 11.5: Kermit Annual Cash Cost of Production Projections  


     Summary Cash Cost of Production ($000)  
     Year 2022      Year 2023      Year 2024      Year 2025      Year 2026  

Operating Costs with Royalty

     33,524        32,250        31,956        31,956        31,956  

Final Reclamation Escrow

     111        111        111        111        111  

Total Cash Cost of Production

     33,636        32,362        32,068        32,068        32,068  

$ per ton sold

     6.86        6.60        6.54        6.54        6.54  

11.2.4.3 Projected Capital Expenditures

Atlas projected sustaining CapEx, which includes maintenance of production equipment as well as other items, to be $2 million per year. The projected annual CapEx is a reasonable estimate.

11.3 Monahans Operation

11.3.1 Historical Capital Expenditures

Table 11.6 presents Monahan’s CapEx for years 2020 and 2021 and is based on fixed asset data provided by Atlas.


Table 11.6: Monahans Historical Capital Expenditures  


CapEx ($000)  


Year 2020

     949  

Year 2021*

     4,646  


Total

     5,596  


*

Includes Construction in Progress (CIP)


JOHN T. BOYD COMPANY


11-4


11.3.2 Historical Revenues and Sales

Table 11.7 presents Monahans’ historical sales data for years 2020 and 2021. Year 2021 prices have improved from the low prices experienced in Year 2020. Atlas’ Year 2021 sales were approximately 4.1 million tons, a 30% increase from Year 2020, which was impacted by the COVID-19 pandemic.


Table 11.7: Monahans Historical Sales Data  


     Year 2020      Year 2021  

Tons sold (000)

     3,160        4,093  

Revenues ($000)

     41,213        68,631  

Product Pricing ($ per ton sold)

     13.04        16.77  

11.3.3 Historical Operating Costs

Table 11.8 presents Monahans’ historical Cash Cost of Production data for years 2020 and 2021.


Table 11.8: Monahans Historical Cost of Production  


     Year 2020      Year 2021  

Cash Cost of Production ($ 000)

     23,126        28,533  

$ per ton sold

     7.32        6.97  

Cost of Production represents the costs incurred in the association with the mining, wet processing, dry processing, product loadout, maintenance, quality control, property taxes, and other related operating costs, and includes royalty expense (as discussed in Chapter 3, section 3.3).

11.3.4 Projected Production, Sales, and Costs

BOYD was provided production, sales, and cost projections for the Monahans Operation. Forecasted financial data, product pricing, and costs are in 2021 constant dollars. BOYD opines that the production and financial projections are reasonable and are likely to be within ± 20% accuracy level.

11.3.4.1 Production and Sales Projections

Annual forecasted ROM production of approximately 5.6 Mtpy is based on the dry plant producing 4.9 Mtpy of saleable product after a processing (wet and dry processing plant) loss of approximately 13%, as discussed in Chapter 6. Forecasted dry processing plant production is within the operation’s current infrastructure capacities and capabilities.


JOHN T. BOYD COMPANY


11-5


As noted in Table 11.9, the dry processing plant is projected to product approximately 4.9 Mtpy of saleable product consisting of 40/70-mesh and 40/140-mesh products, as discussed in Chapter 6.

The forecasted sales price of $30 per ton sold, for all products, presented in Table 11.9 is based on average product prices for the first two months of 2022, as provided by Atlas, and reflects a significant rebound from years 2020 and 2021 prices. We opine that this is reasonable average price.


Table 11.9: Monahans Sales Projections  


     Year 2022      Year 2023      Year 2024      Year 2025      Year 2026  

Tons Sold (000)

     4,900        4,900        4,900        4,900        4,900  

Revenues ($000)

     147,000        147,000        147,000        147,000        147,000  

Product Pricing ($ per ton sold)

     30.00        30.00        30.00        30.00        30.00  

11.3.4.2 Operating Cost Projections

Table 11.10 below, presents the cash cost projections for the period 2022 through 2026. Operating cost projections were provided by Atlas and are based on prior year and current year actuals. BOYD considered their estimates to be reasonable. However, adjustments were made based on our review of historical operating costs as well other information and our experience with such operations.


Table 11.10: Monahans Annual Cash Cost of Production Projections  


     Summary Cash Cost of Production ($000)  
     Year 2022      Year 2023      Year 2024      Year 2025      Year 2026  

Operating Costs with Royalty

     33,396        32,171        31,877        31,877        31,877  

Final Reclamation Escrow

     130        130        130        130        130  


Total Cash Cost of Production

     33,526        32,301        32,007        32,007        32,007  

$ per ton sold

     6.85        6.60        6.54        6.54        6.54  

11.3.4.3 Projected Capital Expenditures

Atlas projected sustaining CapEx, which includes maintenance of production equipment as well as other items, to be $2 million per year. The projected annual CapEx is a reasonable estimate.


JOHN T. BOYD COMPANY


12-1


12.0 ECONOMIC ANALYSIS

12.1 Introduction

This chapter will contain two main sections, one for the Kermit Operation and one for the Monahans Operation. Each section will address similar topics in their respective subsections.

Cash flow projections for the Kermit and Monahans operations have been generated from their respective proposed LOM production schedules and revenues, cost of production (COP), and CapEx estimates discussed in Chapter 11. A summary of the key assumptions used is provided below.


LOM ROM frac sand tons and product tons sold were based on the respective total frac sand reserve estimates discussed in Chapter 6 of this report. The Kermit Operation is estimated to be depleted in Year 2062 and the Monahans Operation is estimated to be depleted in Year 2056.


Forecasted revenues at the respective on-site loadouts (mine gate) are based on sales of both 40/70 and 40/140-mesh size products to be delivered by truck to various sites in the Permian Basin.


Projected Operating Costs and Other Costs (as discussed in Chapter 11) include:


Employee wages, benefits, and other employee expenses.


Contract mining.


Maintenance.


Mobile Equipment and Fuel.


Utilities (including dryer fuel) and Waste Disposal.


Other Operating Expenses (includes Property Taxes).


Royalty.


Reclamation costs include:


Final reclamation cost to reclaim each respective site.


Capital Expenditures (as discussed in Chapter 11) include:


Sustaining/Maintenance.


JOHN T. BOYD COMPANY


12-2


Taxes are based on:


Federal Business Income Tax Rate of 21%.


State Franchise (Margin) Tax Rate of 0.75% applied to the margin (total revenues less cost of goods sold).


Adjustments used to determine After-Tax cash flows:


Current fixed assets, by asset class, are depreciated based on their respective Year 2021 average monthly expense.


Depreciation expense for new fixed assets (from sustaining/maintenance CapEx) are based on a straight-line depreciation calculation using a 10-year asset life.


Operating losses, if any, are carried forward in the tax computation.

12.2 Kermit Operation

12.2.1 Economic Analysis

BOYD prepared an economic analysis, as of January 1, 2022, for the Kermit Operation using the production, sales, and financial projections presented in this report. Our analysis confirms that the operation generates positive cash flows (based on a 10% discount rate), on a pre-tax and after-tax basis, that supports the statement of frac sand reserves herein.

12.2.2 Cash Flow Analysis

Table 12.1 below presents the pre-tax and after-tax cash flow projections based on the proposed LOM production schedule and revenue, cost of production, and CapEx estimates discussed above for the Kermit operation.


Table 12.1: Summary Cash Flow Statement  


     Summary Cash Flow Statement ($ 000)  
     2022
to 2031
     2032
to 2041
     2042
to 2051
     2052
to 2061
     2062
to 2062
     Total  

Total Tons Sold (000)

     49,000        49,000        49,000        49,000        2,016        198,016  

Revenues

     1,470,000        1,470,000        1,470,000        1,470,000        60,480        5,940,480  

Cost of Production

     322,538        323,126        325,576        327,277        17,920        1,316,436  

CapEx

     20,000        20,000        20,000        19,000        —          79,000  


Net Pre-Tax Cash Flow

     1,127,462        1,126,874        1,124,424        1,123,723        42,560        4,545,044  

Federal Income and State Franchise Taxes

     227,676        234,419        236,866        237,130        8,373        944,464  


Net After-Tax Cash Flow

     899,786        892,455        887,558        886,593        34,187        3,600,579  

Three DCF-NPVs on a pre-tax basis and three DCF-NPVs on an after-tax basis, using discount rates of 8%, 10%, and 12%, were calculated utilizing the cash flows above. The DCF-NPV values used mid-year discounting and all cash flows were on a constant dollar basis.


JOHN T. BOYD COMPANY


12-3


The pre-tax DCF-NPVs range from approximately $983 million to $1,398 million, and the after-tax DCF-NPVs range from approximately $783 million to $1,112 million. Table 12.2 summarizes the results of the pre-tax and after-tax analyses:


Table 12.2: DCF-NPV  


     DCF-NPV ($ millions)  
     8%      10%      12%  

Pre-Tax

     1,398        1,156        983  

After-Tax

     1,112        920        783  

Refer to Table 12.3 for the detailed LOM cash flow analysis and corresponding pre-tax and after-tax DCF-NPV analyses at a 10%% discount rate.

BOYD notes that the DCF-NPV estimate was made for purposes of confirming the economic viability of the reported frac sand reserves and not for purposes of valuing Atlas, the Kermit Operation, or its assets. IRR and project payback were not calculated, as there


JOHN T. BOYD COMPANY


12-4


TABLE 12.3

PRE-TAX AND AFTER-TAX CASH FLOW ANALYSIS

AES - KERMIT OPERATION

Winkler County, Texas

Prepared For

ATLAS ENERGY SOLUTIONS, INC


By

John T. Boyd Company

Mining and Geological Consultants

May 2022


     2022      2023      2024      2025      2026      2027      2028      2029      2030      2031      2032
to 2041
     2042
to 2051
     2052
to 2061
     2062
to 2062
     Total  

Production/Processing Statistics (Tons 000):


ROM Production

     5,972        5,972        5,972        5,972        5,972        5,972        5,972        5,972        5,972        5,972        59,718        59,718        59,718        2,459        241,333  

Overall Processrig Recovery (%)

     82.1        82.1        82.1        82.1        82.1        82.1        82.1        82.1        82.1        82.1        82.1        82.1        82.1        82.0        82.1  

Dry Plant Product

     4,900        4,900        4,900        4,900        4,900        4,900        4,900        4,900        4,900        4,900        49,000        49,000        49,000        2,016        198,016  

Sales and Financial Data:


Saleable Product Tons Sold (000)

     4,900        4,900        4,900        4,900        4,900        4,900        4,900        4,900        4,900        4,900        49,000        49,000        49,000        2,016        198,016  

Product Pricing ($ per ton)

     30.00        30.00        30.00        30.00        30.00        30.00        30.00        30.00        30.00        30.00        30.00        30.00        30.00        30.00        30.00  

Revenues ($ 000)

     147,000        147,000        147,000        147,000        147,000        147,000        147,000        147,000        147,000        147,000        1,470,000        1,470,000        1,470,000        60,480        5,940,480  

Cost of Production ($ 000)

     33,636        32,362        32,068        32,068        32,068        32,068        32,068        32,068        32,068        32,068        323,126        325,576        327,277        17,920        1,316,436  

$ per ton sold

     6.86        6.60        6.54        6.54        6.54        6.54        6.54        6.54        6.54        6.54        6.59        6.64        6.68        8.89        6.65  


Net Pre-Tax Cash Flow Before CapEx

     113,364        114,638        114,932        114,932        114,932        114,932        114,932        114,932        114,932        114,932        1,146,874        1,144,424        1,142,723        42,560        4,624,044  

$ per ton sold

     23.14        23.40        23.46        23.46        23.46        23.46        23.46        23.46        23.46        23.46        23.41        23.36        23.32        21.11        23.35  

CapEx ($ 000):


Total CapEx

     2,000        2,000        2,000        2,000        2,000        2,000        2,000        2,000        2,000        2,000        20,000        20,000        19,000        —          79,000  


Net Pre-Tax Cash Flow

     111,364        112,638        112,932        112,932        112,932        112,932        112,932        112,932        112,932        112,932        1,126,874        1,124,424        1,123,723        42,560        4,545,044  

Federal Income and State Franchise Taxes

     22,096        22,405        22,550        22,737        22,991        22,949        22,907        23,033        23,025        22,983        234,419        236,866        237,130        8,373        944,464  


After-Tax Net Cash Flow

     89,268        90,234        90,382        90,195        89,942        89,984        90,026        89,900        89,907        89,949        892,455        887,558        886,593        34,187        3,600,579  

DCF-NPV Analysis:


Pre-Tax Discounted Cash Flows at 10%

     106,182        97,633        88,989        80,899        73,545        66,859        60,781        55,255        50,232        45,665        279,986        107,712        41,478        897        1,156,113  

Cumulative Pre-Tax Discounted Cash Flows at 10%

     106,182        203,815        292,804        373,703        447,248        514,107        574,888        630,143        680,375        726,040        1,006,026        1,113,738        1,155,217        1,156,113     

After-Tax Discounted Cash Flows at 10%

     85,114        78,213        71,220        64,611        58,572        53,273        48,452        43,986        39,991        36,372        221,889        85,022        32,729        720        920,164  

Cumulative After-Tax Discounted Cash Flows at 10%

     105,229        200,259        285,329        361,284        429,100        489,651        543,714        591,985        635,084        673,565        890,520        960,222        982,635        983,067     


JOHN T. BOYD COMPANY


12-5


was no initial investment considered in the financial model. Risk is subjective, as such, BOYD recommends that each reader should evaluate the project based on their own investment criteria.

12.2.3 Sensitivity Analyses

Sensitivity analyses for the pre-tax and after-tax cash flows considering changes to revenues and Cost of Production/CapEx were prepared using discount rates of 8%, 10%, and 12%. Revenues were adjusted in increments of 5% and range from minus 20% to plus 20% base revenues; the corresponding weighted average sales price would range from $24.00 per ton sold to $36.00 per ton sold, with the base price of $30.00 per ton sold as noted in Table 12.4 below.


Table 12.4: Sensitivity Analysis- Weighted Average Sales Prices
Weighted Average Sales Price $ per ton sold
-20%   -15%   -10%   -5%   0%    5%    10%    15%    20%
24.00   25.50   27.00   28.50   30.00    31.50    33.00    34.50    36.00

Costs were adjusted in increments of 5% and range from minus 20% to plus 20% base costs. BOYD notes that although the royalty expense is in Cost of Production, it changes with revenues as it is a function of revenue.

12.2.3.1 Pre-Tax Sensitivity Analyses

The following three tables (Tables 12.5-12.7) summarize the results of the pre-tax sensitivity analyses performed, which utilize discount rates of 8%, 10%, and 12% and incorporate the changes to revenue and Cost of Production/CapEx discussed above:

Table 12.5: Pre-Tax DCF-NPV at 8%

LOGO


JOHN T. BOYD COMPANY


12-6


Table 12.6: Pre-Tax DCF-NPV at 10%

LOGO

Table 12.7: Pre-Tax DCF-NPV at 12%

LOGO

12.2.3.2 After-Tax Sensitivity Analyses

The following three tables (Tables 12.8-12.10) summarize the results of the after-tax sensitivity analyses performed, which utilize discount rates of 8%, 10%, and 12% and incorporate the changes to revenue and Cost of Production/CapEx discussed above:

Table 12.8: After-Tax DCF-NPV at 8%

LOGO


JOHN T. BOYD COMPANY


12-7


Table 12.9: After-Tax DCF-NPV at 10%

LOGO

Table 12.10: After-Tax DCF-NPV at 12%

LOGO

12.3 Monahans Operation

12.3.1 Economic Analysis

BOYD prepared an economic analysis, as of January 1, 2022, for the Monahans Operation using the production, sales, and financial projections presented in this report. Our analysis confirms that the operation generates positive cash flows (based on a 10% discount rate), on a pre-tax and after-tax basis, that supports the statement of frac sand reserves herein.

12.3.2 Cash Flow Analysis

Table 12.11 below presents the pre-tax and after-tax cash flow projections based on the proposed LOM production schedule and revenue, cost of production, and CapEx estimates discussed above for the Monahans operation.


JOHN T. BOYD COMPANY


12-8


Table 12.11: Summary Cash Flow Statement

 
     Summary Cash Flow Statement ($ 000)  
     2022      2032      2042      2052         
     to 2031      to 2041      to 2051      to 2056      Total  

Total Tons Sold (000)

     49,000        49,000        49,000        22,723        169,723  

Revenues

     1,470,000        1,470,000        1,470,000        681,690        5,091,690  

Cost of Production

     321,883        322,520        324,970        155,573        1,124,946  

CapEx

     20,000        20,000        20,000        7,000        67,000  


Net Pre-Tax Cash Flow

     1,128,117        1,127,480        1,125,030        519,117        3,899,744  

Federal Income and State Franchise Taxes

     248,822        248,688        248,174        114,063        859,748  


Net After-Tax Cash Flow

     879,295        878,792        876,856        405,054        3,039,997  

Three DCF-NPVs on a pre-tax basis and three DCF-NPVs on an after-tax basis, using discount rates of 8%, 10%, and 12%, were calculated utilizing the cash flows above. The DCF-NPV values used mid-year discounting and all cash flows were on a constant dollar basis.

The pre-tax DCF-NPVs range from approximately $974 million to $1,362 million, and the after-tax DCF-NPVs range from approximately $759 million to $1,062 million Table 12.12 summarizes the results of the pre-tax and after-tax analyses:


Table 12.12: DCF-NPV

 
     DCF-NPV ($ millions)  
     8%      10%      12%  

Pre-Tax

     1,362        1,138        974  

After-Tax

     1,062        887        759  

Refer to Table 12.13 for the detailed LOM cash flow analysis and corresponding pre-tax and after-tax DCF-NPV analyses at a 10% discount rate.

BOYD notes that the NPV estimate was made for purposes of confirming the economic viability of the reported frac sand reserves and not for purposes of valuing Atlas, the Monahans operation, or its assets. IRR and project payback were not calculated, as there was no initial investment considered in the financial model. Risk is subjective, as such, BOYD recommends that each reader should evaluate the project based on their own investment criteria.


JOHN T. BOYD COMPANY


12-9


TABLE 12.13

PRE-TAX AND AFTER-TAX CASH FLOW ANALYSIS

AES - MONAHANS OPERATION

Ward and Winkler Counties, Texas

Prepared For

ATLAS ENERGY SOLUTIONS, INC


By

John T. Boyd Company

Mining and Geological Consultants

May 2022


                                                                           2032      2042      2052         
     2022      2023      2024      2025      2026      2027      2028      2029      2030      2031      to 2041      to 2051      to 2056      Total  

Production Statistics (Tons 000):


ROM Production off Fee Property

     5,630        5,630        5,630        5,630        5,630        5,630        5,630        5,630        5,630        5,630        56,298        56,298        26,108        195,002  

Overall Processing Recovery (%)

     87.0        87.0        87.0        87.0        87.0        87.0        87.0        87.0        87.0        87.0        87.0        87.0        87.0        87.0  

Dry Plant Product

     4,900        4,900        4,900        4,900        4,900        4,900        4,900        4,900        4,900        4,900        49,000        49,000        22,723        169,723  

Sales and Financial Data:


Saleable Product Tons Sold (000):

     4,900        4,900        4,900        4,900        4,900        4,900        4,900        4,900        4,900        4,900        49,000        49,000        22,723        169,723  

Product Pricing ($ per ton)

     30.00        30.00        30.00        30.00        30.00        30.00        30.00        30.00        30.00        30.00        30.00        30.00        30.00        30.00  

Revenues ($ 000)

     147,000        147,000        147,000        147,000        147,000        147,000        147,000        147,000        147,000        147,000        1,470,000        1,470,000        681,690        5,091,690  

Cost of Production ($ 000)

     33,526        32,301        32,007        32,007        32,007        32,007        32,007        32,007        32,007        32,007        322,520        324,970        155,573        1,124,946  

$ per ton sold

     6.84        6.59        6.53        6.53        6.53        6.53        6.53        6.53        6.53        6.53        6.58        6.63        6.85        6.63  


Net Pre-Tax Cash Flow Before CapEx

     113,474        114,699        114,993        114,993        114,993        114,993        114,993        114,993        114,993        114,993        1,147,480        1,145,030        526,117        3,966,744  

$ per ton sold

     23.16        23.41        23.47        23.47        23.47        23.47        23.47        23.47        23.47        23.47        23.42        23.37        23.15        23.37  

CapEx ($ 000):


Total CapEx

     2,000        2,000        2,000        2,000        2,000        2,000        2,000        2,000        2,000        2,000        20,000        20,000        7,000        67,000  


Net Pre-Tax Cash Flow

     111,474        112,699        112,993        112,993        112,993        112,993        112,993        112,993        112,993        112,993        1,127,480        1,125,030        519,117        3,899,744  

Federal Income and State Franchise Taxes

     24,601        24,859        24,920        24,920        24,920        24,920        24,920        24,920        24,920        24,920        248,688        248,174        114,063        859,748  


After-Tax Net Cash Flow

     86,873        87,840        88,073        88,073        88,073        88,073        88,073        88,073        88,073        88,073        878,792        876,856        405,054        3,039,997  

DCF-NPV Analysis:


Pre-Tax Discounted Cash Flows at 10%

     106,286        97,686        89,037        80,943        73,584        66,895        60,813        55,285        50,259        45,690        280,136        107,770        24,012        1,138,396  

Cumulative Pre-Tax Discounted Cash Flows at 10%

     106,286        203,972        293,009        373,951        447,536        514,430        575,244        630,529        680,788        726,478        1,006,614        1,114,384        1,138,396     

After-Tax Discounted Cash Flows at 10%

     82,830        76,139        69,400        63,091        57,355        52,141        47,401        43,092        39,175        35,613        218,347        83,997        18,733        887,313  

Cumulative After-Tax Discounted Cash Flows at 10%

     82,830        158,969        228,369        291,460        348,815        400,956        448,357        491,449        530,624        566,237        784,584        868,581        887,313     


JOHN T. BOYD COMPANY


12-10


12.3.3 Sensitivity Analyses

Sensitivity analyses for the pre-tax cash flows, considering changes to revenues and Cost of Production/CapEx, were prepared using discount rates of 8%, 10%, and 12%. Revenues were adjusted in increments of 5% and range from minus 20% to plus 20% base revenues; the corresponding weighted average sales price would range from $24.00 per ton sold to $36.00 per ton sold, with the base price of $30.00 per ton sold as noted in Table 12.14 below.


Table 12.14: Sensitivity Analysis- Weighted Average Sales Prices
Weighted Average Sales Price $ per ton sold
-20%   -15%   -10%   -5%   0%    5%    10%    15%    20%
24.00   25.50   27.00   28.50   30.00    31.50    33.00    34.50    36.00

Costs were adjusted in increments of 5% and range from minus 20% to plus 20% base costs. BOYD notes that although the royalty expense is in Cost of Production, it changes with revenues as it is a function of revenue.

12.3.3.1 Pre-Tax Sensitivity Analyses

The following three tables (Tables 12.15-12.17) summarize the results of the pre-tax sensitivity analyses performed, which utilize discount rates of 8%, 10% and 12% and incorporate the changes to revenue and Cost of Production/CapEx discussed above:

Table 12.15: Pre-Tax DCF-NPV at 8%

LOGO


JOHN T. BOYD COMPANY


12-11


Table 12.16: Pre-Tax DCF-NPV at 10%

LOGO

Table 12.17: Pre-Tax DCF-NPV at 12%

LOGO

12.3.3.2 After-Tax Sensitivity Analyses

The following three tables (Tables 12.18-12.20) summarize the results of the after-tax sensitivity analyses performed, which utilize discount rates of 8%, 10% and 12% and incorporate the changes to revenue and Cost of Production/CapEx discussed above:

Table 12.18: After-Tax DCF-NPV at 8%

LOGO


JOHN T. BOYD COMPANY


12-12


Table 12.19: After-Tax DCF-NPV at 10%

LOGO

Table 12.20: After-Tax DCF-NPV at 12%

LOGO


JOHN T. BOYD COMPANY


13-1


13.0 PERMITTING AND COMPLIANCE

13.1 Permitting

The Kermit and Monahans operations are predominantly regulated by the TDEQ with respect to environmental compliance. The predominant permitting requirement is an active NSR permit for air pollution control. Both operations have a current NSR permit which is renewable in 2028, (Kermit 149761) and (Monahans 150399). Other permits held for the operations include: Stormwater, Above Ground Storage Tank, Aggregate Production Operation, and a septic permit. A SPCC plan (spill prevention plan) is also active at each operation. A summary of the permits for both operations is as follows:


Permit Number


Permit type


Plant


Status


Expires

149761    Air Permit (NSR)    1 - Kermit    Active    6/29/2028
AP0002721    Aggregate Production Operation (APO Registration)    1 - Kermit    Active   
2480014    Water Well 1 - CN605406776, RN109897975 -is temporarily approved for use for the period of two years from this letter date based on the conditions    1 - Kermit    Pending    3/6/2022
n/a    SPCC (Spill Plan)    1 - Kermit    Active   
148572    Permit By Rule    2 - Monahans    Active   
148113    Permit By Rule    1 - Kermit    Active   
150399    Air Permit    2 - Monahans    Active    6/29/2028
AP0002804    Aggregate Production Operation (APO Registration)    2 - Monahans    Active   
2480015    Water Well 2 - CN605406776, RN109954511 - temporarily in service    2 - Monahans    Pending   
n/a    SPCC (Spill Plan) -Oi and Gas    2 - Monahans    Active   
NOA WKP-14-17    septic Tank - North - Kermit         
   septic Tank - South - Monahans         


13-2


Although there are no formal state or federal reclamation obligations required for the operation, the Lessor of the property controlled by lease at Monahans has reclamation requirements for post mining land use. An excerpt from the lease document pertaining to these requirements is as follows:

Maintenance, Security, and Restoration of the Leased Premises.


(a)

Lessee shall maintain the Leased Premises in a neat and orderly condition, free of loose trash and debris, and in keeping with industry standard practices in the sand mining industry. Lessee shall construct and maintain all roads constructed and/or used by Lessee in “all weather” condition such that they are capable of normal use by Lessee and others without significant damage during inclement weather.


(b)

To the extent deemed necessary by Lessor, Lessee shall construct and maintain a fence around the perimeter of Lessee’s facility (or portions thereof, as set forth in written notice to Lessee) in order to protect livestock belonging to Lessor’s grazing tenant(s). Such fences shall be constructed within ninety (90) days after written notice to Lessee. Lessee is solely responsible for the security of Lessee’s facility and improvements, but shall provide keys, lock combinations or access cards to Lessor as necessary for Lessor to access Lessee’s facility and all parts of the Leased Premises, Lessor may visit the Leased Premises at any time, but will provide at least forty-eight (48) hours’ verbal notice to Lessee’s on site manager before entering Lessee’s gated processing facility.


(c)

Lessee shall, within six (6) months after termination of this Lease for any reason, remove all equipment, structures, and other improvements placed by Lessee on the Leased Premises during the Term (including, without limitation, any pipelines), other than any supports placed in openings, any timbers, framework, or fences necessary to the use and maintenance of openings, approaches to operating pit, or dikes, water level control structures, and roads. Lessee further agrees with respect to any Materials stored or stockpiled on unmined portions of the Leased Premises to level such Materials. Notwithstanding the foregoing, after any termination of this Lease, Lessee may, for a period not to exceed six (6) months, and for no additional consideration, store on any unmined portions of the Leased Premises, any equipment and other Materials. Notwithstanding the foregoing, Lessee shall have the right at any time during the Term, or within six (6) months after the expiration of this Lease, to remove any improvements, structures, fixtures, machinery, equipment, supplies and other property and Materials placed by Lessee in. on or under the Leased Premises.

Additionally, Atlas voluntarily participates in a Candidate Conservation Agreement with Assurances for the DSL. This mitigates DSL regulatory risk for both of the mining operations. Atlas has the option to either set aside acreage for the DSL habitat or contribute cash based on the acreage within the habitat area. Atlas has significant acreage without sand reserves to set aside for this purpose and can continue mining based on the agreement. The agreement lasts for 23 years starting in January 2021.

13.2 Compliance

The Kermit and Monahans operations are regulated by TCEQ on matters involving air and water pollution and inspected periodically by the state if issues arise.


13-3


Mine safety is regulated by the federal government by MSHA as are all surface mining operations. MSHA inspects the facilities a minimum of twice yearly. Atlas’ safety record compares favorably with its regional peers. For clarity, MSHA refers to Kermit and Monahans as Kermit North (MSHA Id# 4105367) and Kermit South (MSHA Id# 4105359), respectively. Data indicate that during the mines operational lives (2018 through 2021), Non-Fatal Lost Days injury rates have been on the decline. Atlas’ incident rate has trended below average in comparison with other west Texas regional frac sand mining operations during the past three years (2018 through 2021).

Based on our review of information provided by Atlas and available public information, it is BOYD’s opinion that Atlas’ record of compliance with applicable mining, water quality, and environmental regulations is generally typical for the industry. BOYD is not aware of any regulatory violation or compliance issue that would materially impact the frac sand reserve estimate.


14-1


14.0 INTERPRETATION AND CONCLUSIONS

14.1 Findings

Based on our independent technical review and geoscientific study of the Kermit and Monahans mines, BOYD concludes:


Sufficient data have been obtained through the site exploration and sampling program and mining operations to support the geological interpretations of seam thickness, grain size distribution and API quality for the portions of the sand underlying the controlled property. The data are of sufficient quantity and reliability to reasonably support the sand resource and sand reserve estimates in this technical report summary.


Estimates of proppant sand reserves reported herein are reasonably and appropriately supported by technical studies, which consider mining plans, revenue, and operating and capital cost estimates.


The 368 million product tons of frac sand reserves (as of December 31, 2021) estimated for the two mines are economically extractable under reasonable expectations of market volumes and pricing for proppant sand products, estimated operation costs, and capital expenditures.


There are no other relevant data or information material to the Kermit or Monahans mine that is necessary to make this technical report summary not misleading.

14.2 Significant Risks and Uncertainties

As with any mining project there are certain inherent risks associated with the overall operation of a facility. Atlas has sufficiently mitigated operational risk through obtaining sufficient geologic sampling information and analysis. Additionally, Atlas has engineered the processing plant to include parallel duplicate process circuits which significantly increases plant availability. However, it should be noted that frac sand is generally marketed exclusively to the energy industry which has historically been a volatile industry.