Table of Contents

As filed with the U.S. Securities and Exchange Commission on February 24, 2023

Registration No. 333-269488


UNITED STATES

SECURITIES AND EXCHANGE COMMISSION

Washington, D.C. 20549


AMENDMENT NO. 3

FORM S-1

REGISTRATION STATEMENT

UNDER

THE SECURITIES ACT OF 1933


Atlas Energy Solutions Inc.

(Exact name of registrant as specified in its charter)


Delaware   1400   88-0523830
(State or other jurisdiction
of incorporation or organization)
  (Primary Standard Industrial
Classification Code Number)
  (I.R.S. Employer
Identification No.)

5918 W. Courtyard Drive, Suite 500

Austin, Texas 78730

(512) 220-1200

(Address, including zip code, and telephone number, including area code, of registrant’s principal executive offices)

John Turner

President and Chief Financial Officer

5918 W. Courtyard Drive, Suite 500

Austin, Texas 78730

(512) 220-1200

(Name, address, including zip code, and telephone number, including area code, of agent for service)


Copies to:


Douglas E. McWilliams

Thomas G. Zentner

Vinson & Elkins L.L.P.

200 West 6th Street, Suite 2500

Austin, Texas 78701

(512) 542-8400


David J. Miller

Monica E. White

Latham & Watkins LLP

301 Congress Avenue, Suite 900

Austin, Texas 78701

(737) 910-7300

Approximate date of commencement of proposed sale to the public:

As soon as practicable after the effective date of this registration statement.

If any of the securities being registered on this Form are to be offered on a delayed or continuous basis pursuant to Rule 415 under the Securities Act of 1933 check the following box:  

If this Form is filed to register additional securities for an offering pursuant to Rule 462(b) under the Securities Act, check the following box and list the Securities Act registration statement number of the earlier effective registration statement for the same offering.  

If this Form is a post-effective amendment filed pursuant to Rule 462(c) under the Securities Act, check the following box and list the Securities Act registration statement number of the earlier effective registration statement for the same offering.  

If this Form is a post-effective amendment filed pursuant to Rule 462(d) under the Securities Act, check the following box and list the Securities Act registration statement number of the earlier effective registration statement for the same offering.  

Indicate by check mark whether the registrant is a large accelerated filer, an accelerated filer, a non-accelerated filer, smaller reporting company, or an emerging growth company. See the definitions of “large accelerated filer,” “accelerated filer,” “smaller reporting company,” and “emerging growth company” in Rule 12b-2 of the Exchange Act.


Large accelerated filer      Accelerated filer  
Non-accelerated filer      Smaller reporting company  
     Emerging growth company  

If an emerging growth company, indicate by check mark if the registrant has elected not to use the extended transition period for complying with any new or revised financial accounting standards provided pursuant to Section 7(a)(2)(B) of the Securities Act.  


The registrant hereby amends this registration statement on such date or dates as may be necessary to delay its effective date until the registrant shall file a further amendment which specifically states that this registration statement shall thereafter become effective in accordance with Section 8(a) of the Securities Act of 1933, as amended, or until this registration statement shall become effective on such date as the U.S. Securities and Exchange Commission, acting pursuant to said Section 8(a), may determine.


Table of Contents

The information in this prospectus is not complete and may be changed. We may not sell the securities described herein until the registration statement filed with the Securities and Exchange Commission is effective. This prospectus is not an offer to sell such securities, and it is not soliciting an offer to buy such securities in any state or jurisdiction where the offer or sale is not permitted.


SUBJECT TO COMPLETION, DATED                     , 2023

             Shares

Atlas Energy Solutions Inc.

Class A Common Stock


This is the initial public offering of our Class A common stock. We are offering                  shares of our Class A common stock.

Prior to this offering, there has been no public market for our Class A common stock. It is currently anticipated that the initial public offering price for our Class A common stock will be between $                 and $                 per share. We have applied to list our Class A common stock on the New York Stock Exchange (the “NYSE”) under the symbol “AESI.”

We are an “emerging growth company” as the term is used in the Jumpstart Our Business Startups Act of 2012 and, as such, are eligible for reduced reporting requirements. Please see the section titled “Risk Factors” and “Summary—Emerging Growth Company Status.”

Because the Principal Stockholders (as defined herein) will hold approximately     % of the voting power of our Class A common stock and Class B common stock on a combined basis upon the closing of this offering, we will be a “controlled company” under the corporate governance rules of the NYSE. See “Management—Status as a Controlled Company” for additional information.

Investing in our Class A common stock involves risks. See “Risk Factors” beginning on page 39 to read about factors you should consider before investing in our Class A common stock.

Neither the U.S. Securities and Exchange Commission (“SEC”) nor any state securities commission has approved or disapproved of these securities or passed upon the adequacy or accuracy of this prospectus. Any representation to the contrary is a criminal offense.


     Per Share      Total  

Initial public offering price(1)

   $                    $                

Underwriting discounts and commissions(2)

   $                    $                

Proceeds, before expenses, to Atlas Energy Solutions Inc.

   $                    $                


(1)

The public offering price for the shares sold to the public was $             per share.

(2)

See “Underwriting” for information relating to underwriting compensation, including certain expenses of the underwriters to be reimbursed by us.

The underwriters will have an option to purchase, exercisable within 30 days from the date of this prospectus, a maximum of              additional shares of our Class A common stock from us, at the initial price to public less the underwriting discount and commissions.


The underwriters expect to deliver the shares of Class A common stock against payment in New York, New York on             , 2023.


Goldman Sachs & Co. LLC

  BofA Securities   Piper Sandler

RBC Capital Markets


Barclays


Citigroup

Raymond James     Johnson Rice & Company L.L.C.
  Stephens Inc.  
Capital One Securities     Pickering Energy Partners
  Drexel Hamilton  


Prospectus dated                     , 2023.


Table of Contents

TABLE OF CONTENTS


SUMMARY

     1  

RISK FACTORS

     39  

CAUTIONARY NOTE REGARDING FORWARD-LOOKING STATEMENTS

     81  

USE OF PROCEEDS

     84  

DIVIDEND POLICY

     85  

CAPITALIZATION

     87  

DILUTION

     89  

MANAGEMENTS DISCUSSION AND ANALYSIS OF FINANCIAL CONDITION AND RESULTS OF OPERATIONS

     91  

INDUSTRY

     108  

BUSINESS

     129  

MANAGEMENT

     168  

EXECUTIVE COMPENSATION

     176  

CORPORATE REORGANIZATION

     182  

SECURITY OWNERSHIP OF CERTAIN BENEFICIAL OWNERS AND MANAGEMENT

     185  

CERTAIN RELATIONSHIPS AND RELATED PARTY TRANSACTIONS

     187  

DESCRIPTION OF CAPITAL STOCK

     193  

SHARES ELIGIBLE FOR FUTURE SALE

     199  

MATERIAL U.S. FEDERAL INCOME TAX CONSIDERATIONS FOR NON-U.S. HOLDERS

     202  

CERTAIN ERISA CONSIDERATIONS

     207  

UNDERWRITING

     210  

LEGAL MATTERS

     219  

EXPERTS

     219  

WHERE YOU CAN FIND MORE INFORMATION

     219  

INDEX TO FINANCIAL STATEMENTS

     F-1  

GLOSSARY OF CERTAIN INDUSTRY TERMS

     A-1  


Neither we nor the underwriters have authorized anyone to provide you with information different from that contained in this prospectus and any free writing prospectus we have prepared. We take no responsibility for, and can provide no assurance as to the reliability of, any other information that others may give you. We and the underwriters are offering to sell shares of Class A common stock and seeking offers to buy shares of Class A common stock only in jurisdictions where offers and sales are permitted. The information in this prospectus is accurate only as of the date of this prospectus, regardless of the time of any sale of the Class A common stock. Our business, liquidity position, financial condition, prospects or results of operations may have changed since the date of this prospectus.

This prospectus contains forward-looking statements that are subject to a number of risks and uncertainties, many of which are beyond our control. See the sections titled “Risk Factors” and “Cautionary Note Regarding Forward-Looking Statements.”


i


Table of Contents

BASIS OF PRESENTATION

Unless otherwise indicated, the historical financial information presented in this prospectus is that of Atlas Sand Company, LLC (“Atlas LLC”), our “Predecessor” for financial reporting purposes. Further, the financial information and certain other information presented in this prospectus have been rounded to the nearest whole number or the nearest decimal. Therefore, the sum of the numbers in a column may not conform exactly to the total figure given for that column in certain tables in this prospectus. In addition, certain percentages presented in this prospectus reflect calculations based upon the underlying information prior to rounding and, accordingly, may not conform exactly to the percentages that would be derived if the relevant calculations were based upon the rounded numbers or may not sum due to rounding.

INDUSTRY AND MARKET DATA

This prospectus includes industry data and forecasts that we obtained from a variety of sources, including independent publications, government publications and publicly available information, as well as our good faith estimates, which have been derived from management’s knowledge and experience in the industry in which we operate. Although we believe that these third-party sources are reliable, we have not independently verified the data obtained from these sources and we cannot assure you of the accuracy or completeness of the data. Forecasts and other forward-looking information obtained from these sources are subject to the same qualifications and uncertainties as the other forward-looking statements in this prospectus.

The market data regarding supply and demand is difficult to quantify, as the proppant industry continues to evolve and many market participants are privately held, making accurate estimates of supply capacity and market demand difficult to qualify. While we are not aware of any misstatements regarding the market, industry or similar data presented herein, such data involves risks and uncertainties and are subject to change based on various factors, including those discussed in the sections titled “Cautionary Note Regarding Forward-Looking Statements” and “Risk Factors” in this prospectus. Please read the section titled “Industry” for additional information on the proppant industry.

TRADEMARKS AND TRADE NAMES

We own or have rights to various trademarks, service marks and trade names that we use in connection with the operation of our business. This prospectus may also contain trademarks, service marks and trade names of third parties, which are the property of their respective owners. Our use or display of third parties’ trademarks, service marks, trade names or products in this prospectus is not intended to, and does not imply, a relationship with, or endorsement or sponsorship by, us. Solely for convenience, the trademarks, service marks and trade names referred to in this prospectus may appear without the ®, TM or SM symbols, but the omission of such references is not intended to indicate, in any way, that we will not assert, to the fullest extent under applicable law, our rights or the right of the applicable owner of these trademarks, service marks and trade names.


ii


Table of Contents

LOGO

“Who We Are”: A Discussion of Corporate Integrity and our Mission to Increase Access to Affordable Energy, Which Thereby Enhances Human Flourishing, Society and the Environment

Since the founding of our first enterprise in 1990, Brigham Exploration Company, our mission has been to improve human beings’ access to the hydrocarbons that power our lives. It is by pursuing this mission that we fulfill our core responsibility to create value for our owners, the essence of our corporate integrity. We are proud of the role that we play in providing energy security throughout economic cycles and in bettering human lives, while also delivering differentiated social and environmental progress.

We have a long history of being good stewards of not only stockholder capital but also of the environments and communities in which we live and operate. Our core obligation is to our stockholders, and we recognize that maximizing value for our stockholders requires that we optimize the outcomes for our broader stakeholders, including our employees, as well as the communities and the environments in which we operate.

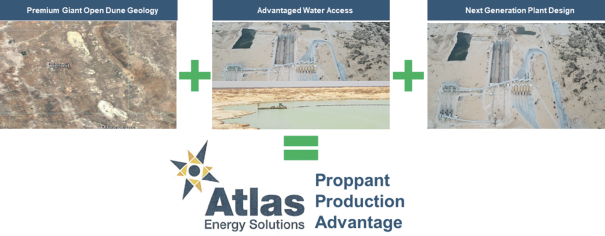
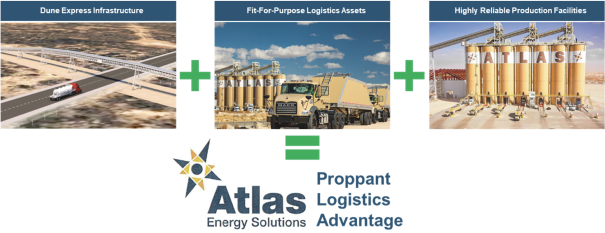
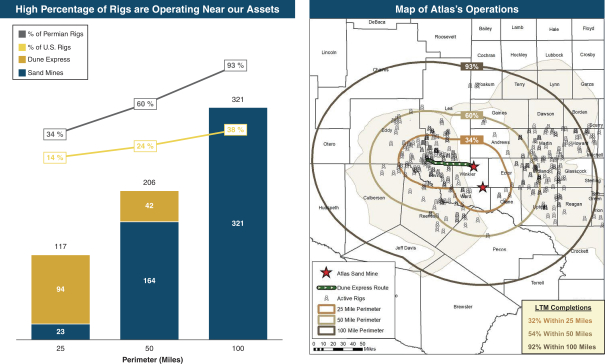
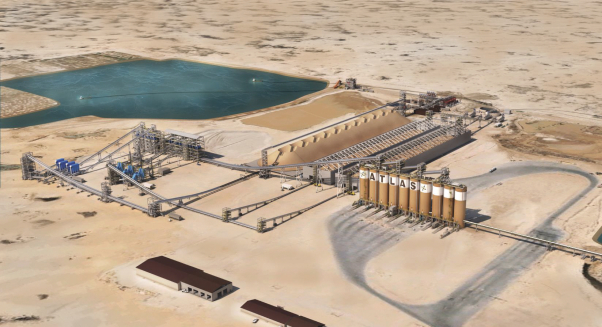
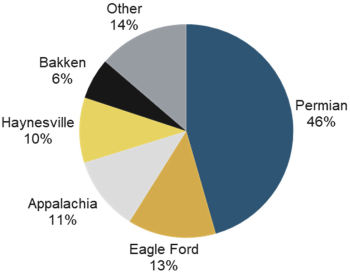
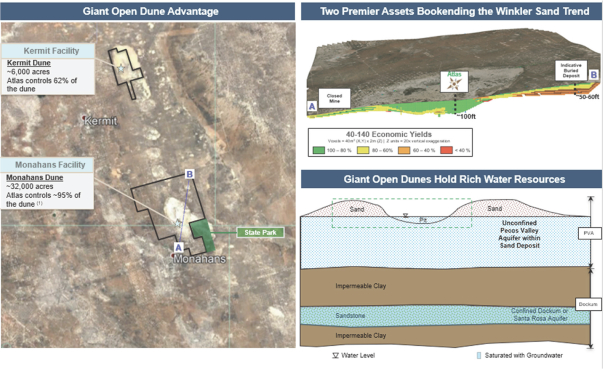
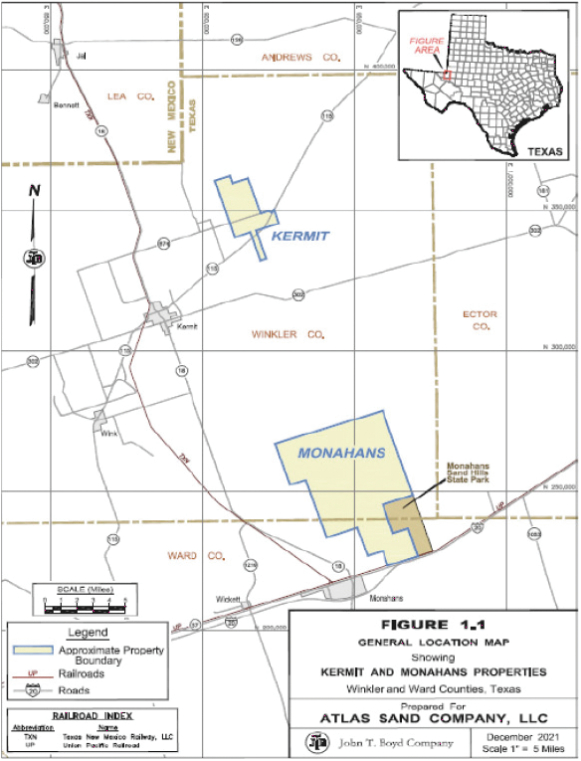
After leading Brigham Exploration Company, Brigham Resources Operating, LLC, and Brigham Minerals, Inc. through two successful initial public offerings and two substantial acquisition events, we recognized a compelling opportunity to capitalize on this track record and our experience by assembling the sand mining rights associated with approximately 38,000 acres in the Permian Basin—the most active basin in North America. So, we founded Atlas Sand Company, LLC (“Atlas Energy”) in 2017, led by an experienced team of entrepreneurs from the oil and natural gas, transportation, industrial and proppant industries who have an established history of value creation and positive disruption in the energy industry. As a result, we designed and constructed our operations through the lens of an E&P operator benefitting from our history and roots in the energy industry, and we firmly believe that this orientation and mindset are reflected in our differentiated results. We have a relentless focus on the needs of our customers, and by creating value for them, we ultimately create value for our shareholders.

We are builders, innovators and, at times, constructive disruptors. Our success has stemmed from our ability to (i) generate leading-edge business ideas (leveraging our knowledge and experience), (ii) hire great people and (iii) provide them with a collaborative and entrepreneurial environment. This approach has repeatedly created value for our owners, rewarding experiences for our employees, and attractive outcomes for our stakeholders, all while improving human beings’ access to the hydrocarbons that power our lives.

In order to attract, develop and retain top-tier talent and to optimize their innovation and productivity, we create an entrepreneurial and collaborative work environment and provide our employees with compensation incentives (including equity) that align their interests with our owners. This approach enables us to deliver industry-leading innovation that drives down costs while elevating performance and has created value for our owners, rewarding experiences for our employees and attractive outcomes for our stakeholders.

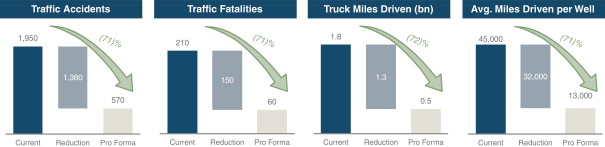
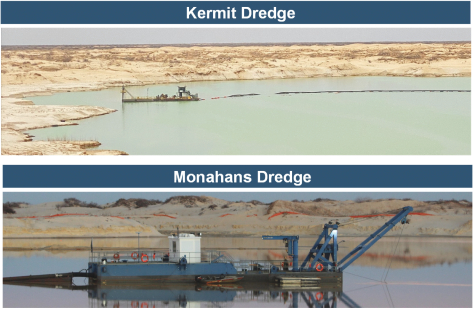
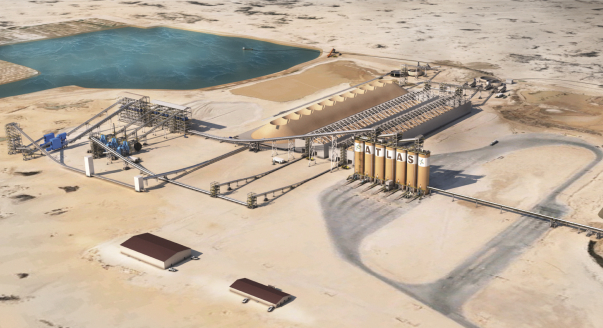
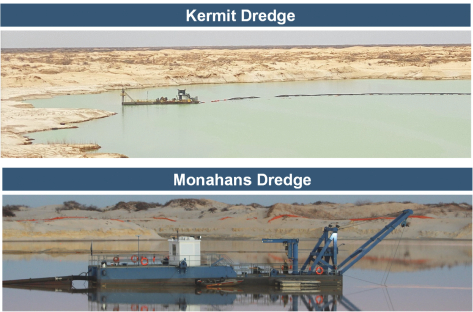
Our Atlas Energy team has driven innovation and has produced industry-leading environmental benefits by reducing energy consumption, emissions, and our aerial footprint. For example, our mining operations utilize an electrified dredging system, unique within the Permian Basin sand mining


iii


Table of Contents

industry, which significantly reduces our emissions1 by replacing the use of certain diesel-powered heavy machinery and equipment characteristic of traditional mining operations in the Permian Basin. The reputation for environmental leadership that we have earned through such innovations is essential to our ability to attract and retain talent, customers and capital, thereby creating value for our owners.

Supportive and constructive communities are essential to our people and our success. For this reason, we are invested in our communities, and we are proud that these communities are invested in our enterprises. For example, we have built strong relationships with regional high schools and military bases, from which many of our valuable personnel were sourced.

We operate with robust governance standards; this is a responsibility we owe our owners and one that is foundational to our value creation. We recognize that deficiencies in governance elevate corporate risks while mitigating positive optionality for value creation.

We have “walked the walk” when it comes to environmental and social progress by recognizing from day one that our long-term profitability depends on being good stewards of the environment, treating our employees well, being active members of the communities in which we operate, and maintaining a high standard of governance and diligence. Though most of the stakeholders who have benefitted from these initiatives are not owners of our business, their flourishing plays a key role in our success.

This is the harmony of capitalism: companies innovating in free markets to create value for their owners, thereby benefitting all their stakeholders. There is no better empirical validation of property rights and capitalism than the unprecedented prosperity of the United States, and we also enjoy the safest air and water of any major country in the world.

At Atlas Energy, we hold ourselves out as an example of how strict adherence to our fiduciary obligation to our owners generates superior and sustainable outcomes for all our stakeholders. We are focused on enabling the production of energy more cleanly and efficiently, in addition to maximizing reliability and reducing cost, which drives our profitability. Providing energy to North America and to the world is critical; Atlas Energy is proud to facilitate domestic energy production and enhance domestic energy security. Further and importantly, the obvious benefit to mankind has been immense and unprecedented, and those benefits are unmatched by any other energy source.

Our core businesses are fundamentally aligned with a lower emissions economy. We believe that we are well-positioned to help address shortages of raw materials and labor leading to supply shortages of critical fossil fuels, which we believe will contribute to helping individuals access the energy they need to sustain or improve their quality of life, in each case, in a socially and environmentally responsible manner. Because our industry has generated abundant and low-cost fossil fuel supplies, we have accelerated unprecedented human flourishing and have improved lives and extended lifespans well beyond that experienced in human history. Despite that progress, there are still over 1 billion people globally suffering from energy poverty (and, thus, economic poverty) without access to low-cost, reliable energy. Therefore, undeveloped nations and the world’s most vulnerable need more scalable and reliable energy-dense fossil fuel energy, not less. We believe that Atlas Energy is well-positioned, as part of the U.S. oil and gas industry, to continue enabling the supply of efficient, responsibly produced, and low emission intensity oil and gas supplies globally.

Atlas Energy is and will continue to be an industry leader in reducing emissions, importantly with regard to air pollutants that are known to be harmful to humans. We are undertaking our Dune Express initiative, which can be characterized as “electrified sand delivery” via an automated conveyor system.


1 

The types of emissions reduced by our electrified dredging system consist of those typically emitted by diesel engines, which commonly include: carbon monoxide (CO), nitrogen oxides (NOx), water vapor (H2O), carbon dioxide (CO2), particulate matter (PM) and unburned hydrocarbons, among other pollutants.


iv


Table of Contents

We believe the Dune Express will represent a first-of-its-kind, transformational energy logistics platform which, in conjunction with the scale of our asset base, will provide the Permian oil and gas industry with increased efficiencies and reliability while substantially reducing emissions. In addition to the emissions benefits of taking thousands of trucks off the commercial roads, the Dune Express will save thousands of lives due to a reduction in traffic and a lower risk of accidents. We call this Sustainable Environmental Progress (“SEP”).

In terms of societal (the “S” in ESG), we hire 100% based on merit, seeking individuals who further our mission described above. As Dr. Martin Luther King Jr. stated, people should “not be judged by the color of their skin, but by the content of their character.” In hiring based on merit, we seek individuals with excellent character, appropriate, diverse and complementary skills, backgrounds and perspectives that add value to our operating performance and culture as we work to achieve our mission. We call this Sustainable Social Progress (“SSP”).

We believe property rights are sacred, that creating value for our owners is virtuous, and that doing so creates positive outcomes for all our stakeholders. This is the essence of our corporate integrity. By delivering on our fiduciary responsibility to our owners we deliver long term profitability, making our business sustainable. Again, this is the harmony of capitalism. We are compounding value not only for our shareholders, but also for our other legitimate stakeholders. We are proud of the fact that our approach to innovation in the hydrocarbon industry while operating in an environmentally responsible manner creates immense value. The hydrocarbons we help produce enhance many aspects of human life due to hydrocarbon-based energy and products, including machines, medicines and vaccines, and we are therefore having a very positive impact on human flourishing.

All of our officers, our board of directors and our employees are committed to this mission and our principles.


Yours sincerely,
LOGO
Ben M. “Bud” Brigham


v


Table of Contents

SUMMARY

This summary highlights information contained elsewhere in this prospectus. This summary does not contain all of the information that you should consider before investing in our Class A common stock. You should read the entire prospectus carefully, including the information under the sections titled “Risk Factors,” “Cautionary Note Regarding Forward-Looking Statements” and “Management’s Discussion and Analysis of Financial Condition and Results of Operations,” and the financial statements and the notes thereto appearing elsewhere in this prospectus. The information presented in this prospectus assumes (i) an initial public offering price of $             per share (the midpoint of the price range set forth on the cover page of this prospectus) and, unless otherwise indicated, (ii) that the underwriters do not exercise their option to purchase additional shares of our Class A common stock.

Unless we state otherwise or the context otherwise requires, the terms “Company,” “Atlas,” “we,” “us” or “our” refer, prior to the corporate reorganization described in this prospectus, to Atlas LLC and its consolidated subsidiaries, and following the corporate reorganization described in this prospectus, to Atlas Energy Solutions Inc. and its consolidated subsidiaries. We have provided definitions for some of the terms we use to describe our business and industry and other terms used in this prospectus in the “Glossary of Certain Industry Terms” beginning on page A-1 of this prospectus.

The information appearing in this prospectus concerning estimates of our mineral reserves is based on the report of John T. Boyd Company, our independent mining engineers and geologists, as of December 31, 2021, and as updated for December 31, 2022. A summary of John T. Boyd Company’s report is included as an exhibit to the registration statement of which this prospectus forms a part.

Atlas Energy Solutions Inc.

Overview

We are a leading provider of proppant and logistics services to the oil and natural gas industry within the Permian Basin of West Texas and New Mexico, the most active oil and natural gas basin in North America. Our core mission is to maximize value for our stockholders by generating strong cash flow and allocating our capital resources efficiently, including providing a regular and durable return of capital to our investors through industry cycles. In our pursuit of this mission, we deploy innovative techniques and technologies to develop our high-quality resource base and efficiently deliver our products to customers through leading-edge logistics solutions. We believe that our uniquely-positioned asset base and our differentiated approach are distinct competitive advantages that make us a more reliable supplier than our competitors. We believe we have developed a strong brand recognition for reliability and strong customer service that has enabled us to increase the volume of proppant sold every year since the founding of the Company in 2017.

Our unique assets and market positioning, along with our innovation and demonstrated reliability, enables us to expand our business beyond proppant sales. We are launching a transformational logistics offering that we believe will bring a step change in efficiency, safety and sustainability benefits to the Permian Basin. This will include the “Dune Express,” an overland conveyor infrastructure solution, which, coupled with our fleet of fit-for-purpose trucks and trailers, we anticipate will remove a significant number of trucks from public roadways within the Permian Basin.

The Dune Express will be the first long-haul overland conveyor system to deliver proppant. We have secured the contiguous right-of-way for our initial system, which is expected to follow a 42-mile-long route from our facilities into the heart of the prolific Northern Delaware Basin. The Dune Express


1


Table of Contents

will significantly shorten the distance that proppant needs to travel by truck, which is expected to provide meaningful productivity gains while decreasing emissions. We expect the Dune Express to make public roadways safer by removing trucks from public roadways, thus reducing traffic, accidents and fatalities on public roadways in the region.

Our supplying partners are currently manufacturing fit-for-purpose equipment for our trucking fleet to be used in our existing logistics business. We have designed our trucking operations and delivery processes to significantly expand the daily payload capacity per truck compared to traditional assets. We believe these fit-for-purpose assets with expanded payload capacity are already driving productivity gains since their deployment in January 2023, and will continue to do so as we build our fleet. Our long-term goal is to bring autonomous wellsite delivery to the Permian Basin, which we expect to drive further productivity gains as the technology is developed over the next several years.

Each of these solutions independently represents a significant leap forward in the logistics space. Combined, we believe that our logistics offering will bring substantial benefits to our customers, investors and the local community in the Permian Basin. The relocation of commercial traffic from public roads to private roads creates a dynamic closed-loop system that is well suited for the rapid deployment and advancement of our trucking fleet, while also increasing the mobility and safety of the public roadways for the residents of the region.

According to Lium Research, Permian Basin proppant demand currently exceeds in-basin production capacity and third-party research indicates that this supply shortage has the potential to grow significantly. In 2022, while Permian operators accelerated completions, they also maintained a healthy drilled uncompleted (“DUC”) well inventory at approximately 94% of the 2018–2022 average. Furthermore, Lium Research estimated that Permian operators would spend approximately $42.8 billion in 2022 with spending levels estimated to be approximately 50% higher in 2024, signaling for a significant and continued increase in completions activity. In response to this supply shortage, we are in the process of adding a facility capable of 5.0 million tons of annual production capacity at our location in Kermit, Texas, and we anticipate that construction will be completed by the end of 2023. Due to the robust levels of industry demand for our product, our existing facilities are currently sold out, our contracted volumes continue to grow, and we are both extending term and adding logistics contracts to our portfolio. The modular design of our existing facilities and the size of our resource base provide us with the ability to further expand our production footprint to meet future market demand, should we determine that the potential investment enhances our long-term profitability and free cash flow profile.

Our Company

We were founded in 2017 by Ben (“Bud”) Brigham, our Executive Chairman and Chief Executive Officer, and are led by an entrepreneurial team with a history of constructive disruption bringing significant and complementary experience to this enterprise, including the perspective of longtime exploration and production (“E&P”) operators, which provides for an elevated understanding of the end users of our products and services. We believe this experience and our associated knowledge base differentiates us from our competitors and facilitates our ability to identify and execute as an early mover on critical value drivers, enabling us to maximize the full potential of our business and outcomes for our stockholders and stakeholders alike.

Our executive management team has a proven track record and over 90 years of combined industry experience with a history of generating positive returns and value creation, exemplified by Bud Brigham’s significant experience leading several companies through a successful initial public offering (“IPO”), or an acquisition event:


In 2011, Brigham Exploration Company (“Brigham Exploration”), a pioneer in the use of 3-D seismic and horizontal drilling and completions techniques within the oil-rich Bakken Shale was acquired by Statoil ASA (“Statoil”) for $4.7 billion. Brigham Exploration completed an IPO in 1997.


2


Table of Contents
   

In 2017, Brigham Resources Operating, LLC (“Brigham Resources”), an innovator in Delaware Basin drilling and completions techniques (as an early adopter of e-frac technology and tested proppant loadings in excess of 5,000 pounds per foot) was acquired by Diamondback Energy, Inc. (“Diamondback”) for $2.6 billion.


In 2022, Brigham Minerals, Inc. (“Brigham Minerals”), a technically sophisticated oil and gas minerals company, combined with Sitio Royalties Corp. (“Sitio Royalties”) in an all-stock merger with a combined enterprise value of $4.8 billion (representing a $2.2 billion value to Brigham Minerals, or a 108% total return since its IPO, with total return calculated as cumulative dividends plus stock price appreciation).

Our experience as E&P operators was instrumental to our understanding of the opportunity created by in-basin sand production and supply in the Permian Basin, which we view as North America’s premier shale resource and which we believe will remain relatively more active through economic cycles. Though the industry has always been focused on increasing efficiencies in resource development, mission critical proppant production and related logistics were historically chaotic and inefficient, particularly given the long and inefficient legacy midwestern supply chain.

We identified the two giant open dunes of the Winkler Sand Trend as the premier sand resource in the region due to their differentiated geologic characteristics, advantaged water access and their large scale/long resource life. As the reserves of these large open dunes have not been subjected to the same degree of soil development, organics and impurities as buried sand deposits, they tend to produce higher and more consistent mining yields relative to buried sand deposits, making the large open dunes economically superior deposits. The giant open dunes’ advantaged access to water stems from the nature of the perched aquifers that have been found to form within these deposits. It is the nature of this water table that has enabled Atlas to become the first and, to our knowledge, the only proppant producer in the Permian Basin to mine by electric dredge, and we expect to transition more of our mining to electric dredging over the next twelve to twenty-four months. We control over 14,500 acres on the giant open dunes, which represents more than 70% of the total giant open dune acreage available for mining. Based on our current total annual production capacity of approximately 10.0 million tons, as of December 31, 2022, our properties have an aggregate expected reserve life of approximately 36 years based on the currently defined mineral reserves, with a potential extension of our reserve life to approximately 200 years based on our total mineral resources.

We believe we are the leader in meeting the evolving proppant needs of an increasingly efficiency-focused oil and natural gas industry. From our inception, our disruptive approach has met the needs of the just-in-time supply model we believed would become the best fit for the industry’s increasingly efficiency-driven focus, and we engineered our facilities to fit this model. Our plants include substantial investments in redundant equipment that aim to maximize our uptime and utilization rates. We believe these are key differentiating factors from some other proppant producers serving the Permian Basin.

The shift to in-basin sand proved to be a disruptive event for the proppant industry, but not sufficient to provide all participants a meaningful advantage. While many companies have attempted to capture the efficiency gains promised by this relocation of the proppant-production hub from the midwestern United States to an in-basin model, few have been able to optimize their efficiency with geologically superior acreage positions and properly designed facilities. It is this combination of geology, water availability and plant design that significantly differentiates our proppant production facilities and we believe makes us more reliable than our competition.


3


Table of Contents

LOGO

Logistics Solutions

We plan to bring meaningful efficiency, safety and sustainability benefits to the Permian Basin through our expanding logistics solutions. We believe that the Permian Basin remains in a multi-year transformation period that began when the innovations that enabled the development of shale resources led to better definition of geologic targets, increased systemization of processes and ultimately resulted in more predictable production outcomes. While enhanced logistics, infrastructure and technology have driven economic gains, they have also increased the technical complexity of execution in the oil and natural gas industry and precipitated a premium on scale, innovation and efficiency. Just as investments in pipeline infrastructure have reduced emissions and improved efficiency and safety by converting a truck-oriented delivery process to an infrastructure-oriented delivery process, our investments into infrastructure and technological improvements to the delivery of proppant aim to harvest similar productivity gains and generate positive community and environmental impacts. These technology and infrastructure investments are integral to and representative of our industry’s long-standing initiatives to reduce the footprint of our operations for the benefit of the local communities we operate within.

The Dune Express Electric Conveyor System: The Dune Express, which will originate at our Kermit facility and stretch into the middle of the Northern Delaware Basin, will be the first long-haul proppant conveyor system in the world. While this is the first application of conveyor infrastructure to long-haul proppant, conveyors are widely used in the proppant industry for short movements of product and are a preferred method of transporting bulk materials in many other industries due to the low transportation cost and increased safety of the accompanying decrease in truck traffic.

Upon completion, we expect the Dune Express to be 42 miles in length, capable of transporting 13 million tons of proppant annually and is designed to have more than 84,000 tons of dry storage within the system. We view the Dune Express as the premier method of moving proppant across the basin and the industry’s best analog to the pipeline infrastructure that moves oil, natural gas, and water around the major producing basins in the U.S. We have secured the contiguous right-of-way, substantially completed the requisite federal and state permitting necessary for construction of the Dune Express and have signed sand supply and logistics contracts with major oil companies for the delivery of proppant by means of the Dune Express. This conveyor system will be strategically located to deliver proppant to the core of the most prolific producing region of the Delaware Basin with flexible loadout capabilities, including both permanent and mobile loadouts.


4


Table of Contents

The Dune Express has the potential to take hundreds of thousands of truckloads off public roads annually, which should reduce traffic accidents and fatalities in the region and significantly reduce emissions generated, relative to the traditional delivery of sand by truck.

We plan to use a portion of the net proceeds from this offering to fund the construction of the Dune Express. We plan to break ground in the first half of 2023, with commercial in-service planned to begin by the end of 2024. Our anticipated cost for completion of the Dune Express is approximately $400 million.

Illustrative Rendering of the Dune Express


LOGO

Please see “Business—Our Company—Significant Innovation Projects—Dune Express” for additional information regarding the Dune Express.

Wellsite Delivery Assets: Our existing logistics business utilizes third-party transportation contractors which we plan to supplement and bring in-house with our own trucks and trailers. As our trucks and trailers continue to be deployed in 2023, we expect to deliver significant productivity gains, as measured by tons per truck that can be delivered daily, compared to the throughput performance of traditional trucking assets. These immediate productivity gains will be made possible through a combination of process improvements and targeted investments in fit-for-purpose equipment. We have partnered with a provider of autonomy and robotic technology with experience in the field of GPS-denied off-road autonomous driving applications to procure a fleet of vehicles equipped with technology designed to support autonomous wellsite delivery. We expect to begin testing in the field during 2023 with the goal of developing this technology over the next several years.

Atlas Logistics Solutions Can Expand Potential Throughput per Vehicle Dramatically


LOGO


5


Table of Contents

Please see “Business—Our Company—Significant Innovation Projects—Wellsite Delivery Assets” for additional information regarding our wellsite delivery assets and goals to bring autonomous wellsite delivery to the Permian.

Combined Impact of Our Logistics Solutions: Together, we believe these initiatives could have a significant impact in driving future revenue and increasing cash flow, reducing emissions, improving safety and relieving traffic and other burdens produced by the existing means of last-mile delivery. Furthermore, by reducing the intermittency of proppant delivery to the wellsite – and thereby increasing the reliability of delivery and potential throughput per truck per day – we believe our delivery solutions significantly mitigate a major bottleneck to the completions supply chain that may support increased pressure-pumping efficiencies.

The graphic below shows the estimated amount of proppant, in tons, that can be delivered to Delaware Basin drilling spacing units in a day by an individual truck. Based on the current supply chain configuration, each truck is limited to very few deliveries per day for a variety of reasons, including the distance from local mines to wellsites that are distributed across a large geographic area, a limited public roadway network and the hours per day that a driver can work. Upon commercialization of the Dune Express and our trucking assets, this throughput potential expands dramatically due to the reduced delivery distance, higher payload capacity and increased asset utilization.

Atlas Logistics Solutions Expand Potential Throughput per Vehicle Dramatically


LOGO

Source: Enverus.

In addition to the efficiency and reliability gains that we expect to realize through our logistics solutions, we anticipate that we will also be able to deliver significant safety benefits to the communities of the Permian Basin. The public road network in the Permian Basin today is ill-equipped


6


Table of Contents

for the massive amounts of oilfield traffic that is required for the industry to operate. By reducing the number of trucks required to fulfill proppant deliveries and removing these trucks from public roads, we anticipate that the rate of traffic accidents and associated injuries and fatalities will be reduced. Please see the subsection titled “—Value Proposition to Our Community and Stakeholders: A Demonstration of the Harmony of Capitalism with Sustainable Environmental & Social Progress” below for additional information regarding our anticipated community impact.

Our logistics solutions have been designed to offer a further extension of our promise of reliability to our customers. We believe that customers will seek out our logistics solutions not only due to the compelling technology and infrastructure solutions we offer but also because they are tied into highly reliable production assets in our Kermit and Monahans facilities.


Atlas Logistics Solutions Expand Potential Throughput per Vehicle Dramatically


LOGO

Value Proposition to Our Stockholders

Strong Margins and Cash Flow Generation: Our ability to generate cash flow is paramount to our value proposition, as it enables us to reinvest in growth, maintain a healthy balance sheet and regularly return capital to our stockholders. A brief summary of several of our key performance and financial metrics is provided below. Please see the subsection titled “—Summary Historical and Pro Forma Financial and Operating Data—Non-GAAP Financial Measures” for more information.


     Year Ended December 31,  
     2022     2021     2020  
     (in thousands, except percentages)  

Net Income

   $ 217,006     $ 4,258     $ (34,442

Adjusted EBITDA(1)

   $ 263,983     $ 71,954     $ 24,667  

Adjusted EBITDA Margin(1)

     54.7     41.7     22.1

Net Cash Provided by Operating Activities

   $ 206,012     $ 21,356     $ 12,486  

Adjusted Free Cash Flow(1)

   $ 228,510     $ 64,239     $ 19,686  

Adjusted Free Cash Flow Margin(1)

     47.3     37.3     17.6


(1)

Please read “—Summary Historical and Pro Forma Financial and Operating Data—Non-GAAP Financial Measures” below for the definitions of Adjusted EBITDA, Adjusted EBITDA


7


Table of Contents
  Margin, Adjusted Free Cash Flow and Adjusted Free Cash Flow Margin and a reconciliation of these measures to our most directly comparable financial measures calculated and presented in accordance with generally accepted accounting principles in the United States of America (“GAAP”).

Focus on Return of Capital: We commenced paying cash distributions in December 2021 and have paid $70.0 million in distributions to our unitholders since that time. We intend to continue to recommend to our board of directors that we continue to regularly return capital to our stockholders through a dividend framework that will be communicated to stockholders in the future. Furthermore, our credit agreements contain provisions that allow us to pay dividends, subject to certain covenants, including pro forma liquidity and leverage ratios. Please see the section titled “Dividend Policy” for more information.

Management & Historical Successes: We were founded by Bud Brigham, our Executive Chairman and Chief Executive Officer, and are led by an experienced team of entrepreneurs from oil and natural gas, transportation, industrial automation and proppant industry backgrounds. We believe our management team’s deep industry experience, record of successful value creation and established history as entrepreneurs and positive disruptors in the energy industry are unique advantages that enable us to continually identify critical value-creation drivers that will allow us to maximize the full potential of our business and the outcomes for our stockholders and stakeholders alike. While our management team has had significant success, past performance is not a guarantee of our future success or similar results. You should not rely on the historical record of our management team, our directors or their affiliates as indicative of the future performance of an investment in us or the returns we will, or are likely to, generate going forward.


Brigham Exploration - Prior to founding Atlas LLC, Bud Brigham founded Brigham Exploration, a positive disruptor and innovator in the E&P space. Brigham Exploration was an early pioneer in 3-D seismic exploration onshore, and completed its IPO in 1997. In subsequent years, Mr. Brigham oversaw the identification, acquisition, delineation and development of approximately 375,000 net acres in the Williston Basin. Brigham Exploration established itself as a leading innovator in horizontal drilling and fracking, as well as oil, gas and water gathering and distribution. The company delivered industry leading operational and economic performance, leading up to Brigham Exploration’s sale to Statoil in December 2011 for an enterprise value of $4.7 billion.


Brigham Resources - Immediately following the sale of Brigham Exploration, Bud Brigham and others from the Brigham Exploration management team founded Brigham Resources and executed on similar strategies in the Southern Delaware Basin in West Texas. By applying rigorous geologic evaluation criteria, Brigham Resources was an early entrant in the Southern Delaware Basin in Pecos County, Texas, where it assembled an approximately 80,185 net acre leasehold position in a largely contiguous block. Like Brigham Exploration, Brigham Resources again was a leading innovator in the play, generating significant enhancements in operational and economic performance, prior to selling its assets to Diamondback in February 2017 for approximately $2.6 billion.


Brigham Minerals - In 2012, Bud Brigham and other members of his management team founded Brigham Minerals, a mineral acquisition company that leverages its knowledge base and experience to acquire mineral ownership in top-tier liquids rich domestic resource plays. Subsequent to its rapid growth as a private enterprise, Brigham Minerals’ management executed an upsized $300 million IPO in April 2019. Brigham Minerals aggregated a portfolio of approximately 81,800 net royalty acres across 36 counties within the Delaware and Midland Basins in West Texas and New Mexico, in the Anadarko Basin in Oklahoma, the Denver-


8


Table of Contents
 

Julesburg Basin in Colorado and Wyoming and the Williston Basin in North Dakota, prior to entering into an all-stock merger with Sitio Royalties in 2022 with a combined enterprise value of $4.8 billion (representing a $2.2 billion value to Brigham Minerals, or a 108% total return since its IPO, with total return calculated as cumulative dividends plus stock price appreciation).

Value Proposition to Our Community and Stakeholders: A Demonstration of the Harmony of Capitalism with Sustainable Environmental & Social Progress

Across our past and current ventures, we have a well-established history of being good stewards of not only stockholder capital but also of the environments and communities in which we live and operate. Our core obligation is to our stockholders, and we recognize that maximizing value for our stockholders requires that we build goodwill and optimize the outcomes for our broader stakeholders, including our employees and the communities in which we operate.

As a result, we deliver leadership across all aspects of Sustainable Environmental and Social Progress (“SESP”). Our aptitude on SESP benefits from our commitment to identifying and executing upon opportunities to transform our business which enhance our growth and profitability through the implementation of new technologies. Our planned Dune Express is one of several initiatives we have undertaken that exhibits our initiatives to transform our business, enhance growth and increase our profitability, while simultaneously providing substantial environmental and safety benefits. This is the harmony of capitalism – innovation can and often does drive both profitability and environmental and/or social progress through free market activity.

The graphic below summarizes our estimates of the reduction in the truck miles driven and associated traffic accidents, traffic fatalities, truck miles driven and emissions attributable to the anticipated operation of the Dune Express as compared to traditional practices.

The Potential Long-Range Environmental & Safety Benefits from The Dune Express are Significant2


LOGO

Source: Management’s internal analysis, based on results of study completed by Texas A&M Transportation Institute

Sustainable Environmental Progress (“SEP”)

To our knowledge, we are the only proppant producer in the Permian Basin that engages in electric dredge mining. Furthermore, we plan to continue transitioning our mining activities from diesel powered mining methods to electric dredging (or “e-mining”) over the next twelve to twenty-four months, which generates materially lower emissions when compared to traditional sand mining. Our shift towards e-mining at both of our Kermit and Monahans facilities exemplifies the alignment of both our operational and SEP leadership, as dredge mining, based on our estimates, will materially improve


2 

Charts reflect anticipated reductions over a 30-year period.


9


Table of Contents

safety and reduce emissions by approximately 50% versus traditional sand mining methods due to the significant reduction in diesel fuel usage required to mine sand traditionally, partially offset by increased electricity consumption from our electric dredges. Our dredge mining process also leads to less surface area disturbance per ton of sand produced as we mine to greater depth as compared to mining associated with buried sand deposits.

Our giant open-dune reserves, paired with the replenishing water sources from our acreage’s in-ground aquifers, are the key reasons why we are able to adopt a technology more often reserved for use in rivers and other naturally occurring bodies of water for use in the desert of West Texas. Our reserves benefit from a naturally occurring water table near the surface of our mines, which is unique in the Permian Basin sand fairway (the “Winkler Sand Trend”) and provides an ample natural supply of costless water for dredge and wash plant operations.

Atlas Electric Dredges


LOGO

Additionally, the results of a study commissioned by us with the Texas A&M Transportation Institute, an independent research agency (the “Transportation Study”), when integrated with our management’s internal analysis, support our estimate that our planned Dune Express could significantly reduce emissions that would otherwise be produced by trucking-related activities associated with the delivery of proppant from the mines of Permian Basin providers to end users. Our estimates project that the system will result in an approximate 70% reduction in carbon dioxide emissions and other emissions, including other pollutants that are harmful to humans. Please see “Business—Our Company—Significant Innovation Projects—Dune Express” for additional information regarding the Dune Express.

Our management team has been proactive with respect to the protection of the dunes sagebrush lizard (“DSL”) and its habitat in an effort to reduce the risk that our business and operations will be materially interrupted in the event that the DSL is listed under the Endangered Species Act (“ESA”). We have adopted numerous best practices to promote active conservation measures for the benefit of


10


Table of Contents

the DSL, including our identification of up to 17,000 acres of land for potential set asides, our pursuit of more environmentally friendly mining practices and our participation in the Candidate Conservation Agreement with Assurances (“CCAA”) for the DSL. Please see the subsection titled “—Competitive Strengths—Proactive approach to the well-being of the environment and our employees” below.

In January 2021, the CCAA was approved by the U.S. Fish and Wildlife Service (“USFWS”) to provide a framework for entry into voluntary conservation agreements between the USFWS and stakeholder participants under which the parties work together to identify threats to the DSL, design and implement conservation measures to address these threats and monitor their effectiveness, among other things. Atlas has been a supporter of the CCAA since its inception and was the first proppant producer to apply for a permit under, and be accepted into, the CCAA. Due to our participation in the CCAA and other conservation measures that we have voluntarily adopted, we do not anticipate that a listing of the DSL as an endangered species would materially reduce sand production at our Kermit and Monahans facilities. We are currently only one of three companies participating in the CCAA. In the event that the DSL is listed as an endangered species under the ESA, it is possible that companies that are not participants in the CCAA at the time of a potential ESA listing would see a disruption to their operations.

Sustainable Social Progress (“SSP”)

We have committed to fostering a safe environment at our worksites and we are committed to extending this culture of safety far beyond our premises. We have a rigorous safety training program with well-developed protocols. We have automated or have invested in remote operations technology to substantially reduce the amount of the activities at the plant sites that require physical interaction between human beings and industrial equipment, and in doing so have removed many of the safety hazards at our facilities.

We anticipate that our planned Dune Express will provide significant environmental benefits, while also benefitting the surrounding region, making it a safer place to live and work. Our management’s analysis of the results of the Transportation Study supports our expectation that the Dune Express will contribute to a meaningful reduction in Permian Basin traffic accidents, congestion and automobile fatalities, by taking trucks off public roads and operating in a much more efficient manner than the industry has historically operated. We believe this will also benefit the community by reducing the wear and tear on local infrastructure, while making the region a safer and better place to live and work. Furthermore, by reducing the number of drivers needed per well and in the aggregate, these initiatives can meaningfully reduce trucking-related hazards on customer wellsites and mitigate future driver shortages.

We are actively engaged in the West Texas community in which we operate, as we believe that by supporting our community, our community will support us. We sponsor a number of programs benefitting schools and the youth in Winkler and Ward Counties, Texas, including supporting after-school programs for children and skill-development programs for high school students.

Our Company’s culture is a product of our employees, and as such, we embrace the responsibility of promoting a diverse and inclusive meritocracy, with approximately 64% minority and/or female representation in our workforce as of December 31, 2022. We reward the hard work of our employees by compensating them well, with our median employee earning in excess of $100,000 per year as of 2022. Furthermore, we provide our employees with a high-quality benefits package including fully paid family medical, dental and vision insurance, a company 401(k) match program and substantial paid time off or rotational schedules. For our employees in West Texas, we provide


11


Table of Contents

convenient, safe and comfortable living facilities at Wyatt’s Lodge, our distinctive alternative to the traditional, notoriously unsafe and unsanitary housing accommodations provided for many oilfield employees. Wyatt’s Lodge provides employees with fully furnished housing, a full cafeteria with a chef and a diverse menu including healthy options, a workout facility, as well as a recreational room and a movie theater. The success of our efforts to create a high-quality workplace is evidenced by our low employee turnover and accolades that include the “Great Place to Work” certification from the Great Place to Work Institute, Inc. for the years ended December 31, 2019, 2020, 2021 and 2022, as well as the “Top Work Places” Award of Recognition from Austin American-Statesman for the years ended December 31, 2021 and 2022.

We believe that the men and women who have served in the United States armed forces have earned a special place in our society. As such, at our founding we created a dedicated effort to support our veterans in our hiring. We have found our focus on recruiting veterans to work for Atlas has brought us many hardworking and outstanding employees over the years and has positively influenced our corporate values. We have received external recognition for our veteran hiring practices, including the Hire Vets Medallion from the U.S. Department of Labor (“DOL”) in 2019, 2020, 2021 and 2022. As of December 31, 2022, 8.4% of our employees served in the U.S. military as compared to an average of 5.6% across all employers nationally.

Governance

We believe that the alignment of our employees, our management and our board of directors with our stockholders is paramount. A few examples of the actions that we will take in connection with this offering or the characteristics that highlight the alignment of interests between our management and stockholders are as follows:


We will establish a diverse and independent board of directors with complementary skills and backgrounds.


We will adopt an executive compensation program that encourages return of capital to stockholders, including through the use of performance-based compensation, with performance metrics that focus business strategy and corporate objectives on total shareholder return, and equity-based long-term incentives.


We will adopt a director compensation policy for our non-employee directors in which a significant portion of the total compensation package is equity-based to further align the interests of our directors with our stockholders.


Management and their affiliates will maintain significant initial ownership in the Company after completion of this offering.

Our organizational structure following the offering and corporate reorganization is commonly referred to as an umbrella partnership-C corporation (or “Up-C”) structure. Pursuant to this structure, following this offering we will hold a number of Atlas Units (as defined below) equal to the number of shares of Class A common stock issued and outstanding, and holders of Atlas Units (each, an “Atlas Unitholder”) (other than us) will hold a number of Atlas Units equal to the number of shares of Class B common stock issued and outstanding. The Up-C structure was selected in order to (i) allow certain existing (direct or indirect) holders of membership interests in Atlas LLC (“Legacy Owners”) the option to continue to hold their economic ownership in Atlas LLC in “pass-through” form for U.S. federal income tax purposes through their direct and indirect ownership of Atlas Units (as defined below), and (ii) potentially allow us to benefit from certain net cash tax savings that we might realize as a result of certain increases in tax basis that may occur as a result of Atlas Inc.’s (as defined below) acquisition (or deemed acquisition for U.S. federal income tax purposes) of Atlas Units pursuant to the exercise of the Redemption Right (as defined below) or the Call Right (as defined below). In contrast to many offerings


12


Table of Contents

by issuers choosing an Up-C structure, we have made the decision not to enter into a tax receivable agreement with the Legacy Owners with respect to any such cash tax savings we might realize, which we believe provides for increased alignment between us and our stockholders over the long term.

Assets and Operations

We currently control the largest and, we believe, the highest quality sand position in West Texas. We have developed our Kermit and Monahans facilities as in-basin proppant mines on approximately 38,000 surface acres that we own or lease in Winkler and Ward Counties, Texas. We control 14,575 acres of large open-dune reserves and resources, which represent more than 70% of the total giant open dune acreage in the Winkler Sand Trend available for sand mining. The Monahans Dune consists of approximately 8,750 acres of premium open-dune reserves. Additionally, we have substantial off-dune acreage at Monahans that is not included in our estimated reserves or resources but that could be mined following our removal of material, such as soil and unusable sand, that lies above the useable sand and must be removed to excavate the useable sand, which we refer to as “overburden.” The Kermit Dune consists of approximately 5,826 acres of premium open-dune reserves.

The following map shows the location of our Kermit and Monahans facilities in Winkler and Ward Counties, Texas, as well as the secured right-of-way for the Dune Express alongside a recent snapshot of the rig count in the Permian Basin as of December 31, 2022:

Map of Operations


LOGO

Source: Enverus, Baker Hughes.

Our “twin” mines, located on the bookends of the Winkler Sand Trend, provide optimal logistics to serve both the Southern and Northern portions of the Delaware and Midland Basins and, as of


13


Table of Contents

December 31, 2022, have a combined annual production capacity of 10.0 million tons, 70,000 tons of dry storage, 700,000 tons of wet storage and 14 loadout lanes. Innovative plant design and large-scale operations ensure low-cost operations and continuity on site. Redundancies were designed into our facilities to remove singular points of failure that can disrupt the production process, ensuring maximum reliability of proppant production and delivery.

Atlas’s Facilities are Strategically Located


LOGO

Source: Enverus, Baker Hughes.

Our Kermit and Monahans facilities were built to produce high quality 40/70-mesh and 100-mesh sands, each of which are used extensively in upstream operations in the Permian Basin. As of December 31, 2022, each facility is capable of producing 5.0 million tons of proppant annually for a combined annual production capacity of 10.0 million tons.

Each facility was constructed with a modular design that provides us with the flexibility to expand one or both of the existing facilities to achieve incremental production capacity if such expansion were found to be necessary or desirable in light of customer demand, broader market conditions or other relevant considerations. The facilities are capable of operating year-round and feature advanced safety designs, onsite water supply, power infrastructure and access to low-cost natural gas through connections to interstate natural gas lines. Further, we strategically benefit from the locations of our facilities proximal to major highways at the south and north ends of the Winkler Sand Trend. Our Kermit facility is bisected by two state highways, while our Monahans facility its adjacent to two highways, one of which is Interstate 20, facilitating efficient transportation of our proppant to customers located at various points within the Permian Basin.


14


Table of Contents

The operations of both sand facilities are managed and monitored in a highly automated manner from our command center in Austin, Texas. We have designed and/or adopted cutting-edge technology that we believe delivers one of the most efficient production and truck loading processes in the industry. The remote ecosystem allows our employees to simultaneously manage processes at both facilities, resulting in significant personnel productivity gains.

As of December 31, 2022, we had 357 million tons of proven and probable sand reserves at our Kermit and Monahans facilities according to estimates by John T. Boyd Company, our independent mining engineers and geologists. Based on our current total annual expected production capacity of approximately 10.0 million tons as of December 31, 2022, our reserve life is expected to be approximately 36 years. As of December 31, 2022, our reserves are composed of approximately 59% 40/70-mesh and 41% 70/140-mesh substrate sand. We believe our reserve composition is attractive to customers that want to consolidate sourcing and positions us as a go-to provider of high quality in-basin proppant.

In response to the significant increase in market demand and also in connection with the expansion of our logistics offering, we are expanding our Kermit production capacity to add a facility capable of 5.0 million tons of annual production capacity by the end of 2023. Our plants were designed modularly to accommodate efficient expansion—maximizing the increase in production capacity while minimally increasing the facilities’ footprint. Pro forma for the completion of our ongoing capacity expansion, the Kermit Facility will have a total of six dryers averaging approximately 225 tons-per-hour, 27 screeners, two dredges, three wet sand storage facilities (totaling approximately 840,000 tons of total wet sand storage), four wet plants with attrition scrubbers, and 10 loadout lanes and silos.

The Permian Basin Proppant and Proppant Logistics Market

The oil and natural gas proppant industry is comprised of businesses involved in the mining, manufacturing, distribution and sale of the propping agents used in the stimulation of hydrocarbon-bearing shale reservoirs as a method to enable production from oil and natural gas wells. During this process, proppants are blended into a fluid mixture and injected downhole into the wellbore at high pressure. This creates cracks in the resource-bearing rock allowing for proppants to become lodged in these cracks, resulting in increased permeability of the reservoir, and in turn, driving greater production of hydrocarbons over the life of the well.


15


Table of Contents

Key Permian Basin Drilling, Completions and Proppant Consumption Metrics


LOGO    LOGO
LOGO    LOGO


(1)

Baker Hughes rig count as of January 2023 and EIA; represents all active U.S. and Permian horizontal land rigs.

(2)

Per Lium + Management Estimates.

(3)

Assumes 23.5 tons per truckload of proppant generally, and 70 tons per Atlas truckload.

Source: Baker Hughes, EIA, Lium and management estimates. Assumes 23.5 tons per truckload of proppant.

A typical horizontal well-design in the Permian Basin can call for greater than 10,000 tons of proppant for completion, which implies greater than 425 truckloads of proppant per well, more than 50,000 miles driven per well, and more than 250 million miles driven per year, according to Rystad Energy. Rystad Energy also estimates an average day in 2021 in the Permian Basin had more than 3,000 trucks transporting proppant over the surrounding network of public highways and lease roads. Prior to the development of in-basin sand facilities, proppant was predominately shipped long distances in bulk from processing facilities in the midwestern United States by rail and barge to various resource basins. It was then further transferred to a truck for “last mile” wellsite delivery. This long supply chain made transportation costs a significant portion of the customer’s overall proppant cost. The discovery and subsequent development of in-basin proppant deposits afforded customers a significant cost-saving alternative. The supply chain was shortened to remove the costly rail or barge portion of the transportation cost, and in the Permian Basin customers have effectively reached full adoption of in-basin proppants. With the relocation of the proppant supply stack to the Permian Basin, which shortened the supply chain and eliminated extended seasonal disruptions, the proppant industry has been transformed into a “just-in-time” delivery model reliant on large quantities of trucks to fulfill orders. In-basin deliveries take place over a matter of hours, whereas the legacy mid-western supply chain


16


Table of Contents

required weeks for the fulfillment of delivery. While this has reduced the severity of fulfillment disruptions experienced as compared to the legacy rail-based midwestern supply chain, it has increased pressure on in-basin proppant-production facilities to maximize uptime and on trucking companies to supply a sufficient quantity of trucks to effectively and efficiently fulfill deliveries to end-users.

As customers continue to drive efficiencies and productivity in their drilling and completions programs, in turn drives the demand for more proppant, we expect increased demand for the products and services that we provide. Please see the section titled “Industry” for additional information regarding the Permian Basin proppant and logistics market.

In-Basin Sand Disrupted the Industry and Placed a Premium on Efficiency


LOGO

Source: Management’s internal analysis, based on results of study completed by Texas A&M Transportation Institute

Competitive Strengths

We believe the following competitive strengths will allow us to successfully execute our business strategies, achieve our primary business objectives and generate free cash flow, including:


Superior geology combined with next-generation plant design promotes efficiency & reliability.    Our Kermit and Monahans acreage holds a unique combination of key attributes that drive our differentiated business profile, including (i) unmatched scale of reserves and acreage within the two large open-dune deposits at the northern and southern ends of the


17


Table of Contents
 

Winkler Sand Trend, (ii) the associated high quality of proppant, (iii) the associated ease of access to our reserves and resources, (iv) the depth of our deposit, which provides a smaller areal footprint per ton produced, and (v) plentiful availability of water. We are not aware of any other area in the Permian Basin that is able to replicate this combination of key attributes. As of December 31, 2022, our combined facilities have 10.0 million tons of annual production capacity, two dredges, six dryers, 70,000 tons of onsite, finished-good storage, 14 dedicated truck loadout lanes with high-speed loadout silos, a comprehensive water recycling system at each plant, which allows us to reuse approximately 95% of the water used in the production process, and 700,000 tons of damp sand storage. Our facilities are capable of operating year-round and feature advanced safety designs, onsite water supply and recycling, power infrastructure and access to low-cost natural gas through connections to interstate natural gas lines.


High margins and strong balance sheet drive compelling combination of growth & yield.    Our margin profile has been tested through industry cycles, and we have demonstrated strong performance relative to our peers in both high and low proppant price environments. We maintain modest levels of debt and intend to continue to reduce our debt over time. As of December 31, 2022, we have a Net Debt/LTM Adjusted EBITDA multiple of 0.3x. We are currently pursuing attractive growth projects and have been returning capital to stockholders. We plan to offer a balanced value proposition to stockholders that we believe will include growth and yield while maintaining financial flexibility and a strong balance sheet.


Unique logistics offering.    Our Dune Express and wellsite delivery assets hold the potential to revolutionize the delivery of proppant in the Permian Basin. By leveraging technology and infrastructure, we will increase asset utilization and payload per delivery resulting in increased efficiency and reliability for our customers. This will also reduce the miles driven on public roadways in the Permian Basin, which will improve the road safety in the basin.


Strategically located facilities.    Our facilities are located on the giant open dunes near Kermit and Monahans, Texas, that bookend the Winkler Sand Trend and enable us to reliably and efficiently meet the proppant demand of our customers in both the Delaware and Midland Basins. In addition, we strategically located our Kermit facility to be bisected by two state highways and positioned our Monahans facility adjacent to two highways to facilitate the efficient transportation of our proppant. Our Kermit facility’s location also provides a strategic origination point for the initial Dune Express, which will travel across the Texas-New Mexico state line area, one of the highest development intensity sections of the Permian Basin.


Strong brand recognition for reliability drives contracting and solidifies valuable relationships with a diverse group of customers.    The success of our business has been underpinned by our relationships with some of the most respected operators and service companies in the Permian Basin. Our customers range from high-profile, public oil and natural gas and service companies to private, independent enterprises. We also have a diverse customer base, which we believe minimizes counterparty risk. During the year ended December 31, 2022, we had 39 customers, with the top 10 customers accounting for approximately 68% of our revenue for that period. During the year ended December 31, 2021, we had 39 customers, with the top 10 customers accounting for approximately 79% of our revenue for that period. Our ability to secure and maintain these robust relationships lends support to our ability to weather economic headwinds. In 2020, we continued to operate throughout the height of the pandemic, grew sales volumes year over year from 2019 to 2020, and increased our market share, as we expanded our customer base by the addition of 14 new customers since January 1, 2020. While our contracting strategy changes over time and through industry cycles, we are currently highly contracted on our existing production capacity, which provides for significant visibility in our future revenue and cash flow. We plan to continue to pursue contracts when they stand to benefit our business over the long term.


18


Table of Contents
   

Ability to leverage technology in optimizing cost structure and addressing our customer’s sustainable environmental progress (SEP) goals.    Our ability to generate cash flow in various commodity price environments and through industry cycles is underpinned by our commitment to the continuous optimization of our operating and capital cost structures. The move from traditional excavation methods to e-mining reduces the need for on-site personnel, heavy equipment and diesel fuel. Further, this technology also provides us the ability to enhance our customers’ SEP initiatives. Numerous employees once located on-site in the Permian Basin now work in a smaller group at our command center in Austin, Texas, monitoring and operating the facilities by video and telecom. This has led to cost reductions and also has enabled us to attract and retain an exceptionally credentialed workforce as compared to competitors with traditional operations that by nature do not provide such flexibility with respect to the location of personnel deployment.


Unique equity investor capitalization of the Company.    We are differentiated and advantaged by our unique equity investor capitalization. Rather than sourcing private equity capital, Bud Brigham funded the initial investments in us. Subsequently, we conducted a successful “friends and family” equity capital raise, which included many investors that had previously invested in Bud Brigham’s prior enterprises. Importantly, approximately 40 of our equity investors are energy entrepreneurs, energy executives and sophisticated energy investors, providing both a validation of the business and facilitating our growth. As a result, we are differentiated in our space with a diverse and sophisticated investor group that is aligned and actively supportive of our shareholder value creation objectives. Furthermore, the lack of traditional private-equity ownership has enabled us to elect to forgo a tax receivable agreement, which we believe provides for increased alignment between the Company and its stockholders over the long term. This is an example of the shareholder alignment we intend to instill through corporate governance policy.


Incentivized board of directors and management team with significant experience in the Permian Basin and a track record of stockholder value creation.    Our executive management team has a combined total of over 90 years of experience in the energy industry. This experience includes two successful IPOs, three successful company sales or mergers, multiple asset monetization events and the successful building of other enterprises. Please see the subsection titled “—Value Proposition to Our Stockholders—Management & Historical Successes” above. Management benefits from extensive experience in the Permian Basin, where our founder was born and raised, and he and other management members have extensive relationships built over a long history of involvement with various businesses in the region across upstream operations, non-operated enterprises, sand mine development, mineral acquisitions and water sourcing. We believe our management team’s experience managing upstream operations in the Permian Basin lends a unique perspective that provides us with a network of key potential customers, suppliers, vendors and employees, contributes to our ability to provide a high-quality customer experience and serves as a strong foundation for our role as a collaborative partner in meeting the advanced completion needs of our customers. Further, our management team has extensive experience in identifying attractive operating areas and evaluating resource potential through a variety of means, including extensive geologic studies; we believe this experience will continue to allow us to expand our operations by selectively pursuing organic development opportunities and innovations in the Permian Basin.


Proactive approach to the well-being of the environment and our employees.    Our voluntary agreement under the CCAA ensures that the USFWS will not require us to comply with conservation measures or impose any restrictions on our use of resources beyond those which


we have already agreed. Our large acreage position also provides us with the flexibility to set


19


Table of Contents
 

aside as much as 17,000 acres of high suitability DSL habitat for conservation protection, which would exempt us from certain enrollment fees otherwise required under the CCAA. The smaller acreage position of many of our Permian Basin competitors may make similar set-asides commercially challenging for them. We believe that our voluntary participation under the CCAA will help to safeguard our assets and operations against adverse effects that could result from non-participation or any future listing of the DSL as an endangered species. We believe potential customers, focused on improving the sustainability profile of their own operations, value our proactive stance towards environmental risk management. As we focus on the well-being of the environment we operate in, we also focus on the well-being of our employees through initiatives such as our compensation and benefits package and Wyatt’s Lodge. We believe that this differentiated investment in our employees creates a culture of pride and ownership that fosters the positive disruptions and innovations our business successes are built on.

Business Strategies

Our principal business objective is to drive improvements to critical products and services in the Permian Basin through innovation which may reduce environmental impacts and optimize our cost structure, while driving notable value creation for our stockholders and stakeholders alike.


Continuously optimize cost structure in order to deliver free cash flow across commodity cycles.    Demand for services used in the development of unconventional resources in the United States varies notably based on the pace and intensity of such development, which is driven in large part by the prevailing commodity price environment. Since the beginning of 2020 through December 31, 2022, per-barrel prices of West Texas Intermediate (“WTI”) crude oil exhibited substantial volatility ranging from $16.55 to $114.84, and we expect commodity prices to continue to be unpredictable going forward; as such, since our inception, we have continuously strived to optimize our cost structure and we believe we are able to provide our stockholders with a return of capital through cycles. For instance, substantial up-front investments were made in our Kermit and Monahans facilities and associated equipment in order for their design to maximize uptime and reliability. Our access to a natural water table near the surface of our deposit has allowed us to significantly lower our production costs through dredge mining. Our transition to e-mining, when fully completed is expected to result in reduced production costs, as we have seen historically when we have been able to use electric dredging as our primary mining method. In the future, the modular designs of our facilities will accommodate future expansions at a significantly reduced expense as compared to the conventionally designed facilities of our Permian Basin competitors.


Seek out opportunities to positively disrupt the market for products and services critical to unconventional resource development projects.    Innovation is central to our corporate culture, as it has been since the leadership role of certain members of our management team in the Bakken Formation’s evolution via Brigham Exploration, and we continuously strive to holistically improve unconventional resource development in the United States, particularly in the Permian Basin. We were a leader in the disruption in the proppant supply chain as early entrants into “in-basin” sand which eliminated the need for in excess of 1,000-mile train hauls from the midwestern United States and in excess of 250-mile truck hauls from central Texas, providing substantial economic and environmental benefits. More recently, we were the first to bring e-mining to the Permian Basin, and we are advancing our initiative to meaningfully electrify sand delivery operations in the Permian Basin through our Dune Express and autonomous wellsite delivery initiatives.


Use our unmatched scale to amplify innovation and disruptive technology to improve the unconventional resource supply chain.    Our Kermit and Monahans facilities represent a complete reinvention of the more traditional proppant production facility. Most proppant production facilities were historically located far from the point of consumption and therefore had long supply lines. Generally speaking, these facilities frequently experienced downtime on


20


Table of Contents
 

an unpredictable schedule. With the onset of in-basin sand, we recognized the need for our facilities to operate on a just-in-time delivery basis and took to redesigning the traditional facility to ensure that redundancy was built in at critical junctures to mitigate the effects of unplanned equipment downtime. Additional early measures included investments into the automation of our loadout lanes to drive down load times and the automation of many of our operations activities to improve efficiency and safety. More recently, we were the first, and currently the only, Permian Basin miner to partially electrify the mining of proppant through the use of electric dredges, and we plan to increase our electric dredge volumes over the next twelve to twenty-four months. Our Dune Express and wellsite delivery assets are the next positive major disruptions that we are bringing to the Permian Basin. As a positive disruptive industry technology, the Dune Express replaces much of the trucking haul with electric, conveyor-based transportation, which is likely to provide substantial SESP benefits, including a significant reduction in the emissions generated, relative to the traditional delivery of sand to customer wellsites due to the reduction in miles driven per ton of payload delivered. These strategic initiatives and other innovations are clear demonstrations of our commitment to evaluate and pursue strategies and technologies that positively disrupt our industry and continue to establish, maintain and optimize aspects of our business that provide distinct advantages over our competitors.


Grow business around anchor contracts with high quality counterparties.    Innovation and the pursuit of additional projects like the Dune Express are central to our strategy, but they are only made possible by our relationships with high-quality, top-tier companies that operate in the Permian Basin. We have supply contracts in place with a variety of leading oil and natural gas and oilfield services companies, many of which are high-credit quality customers. The quality of our customer base is reflected in our collections rate over the year ended December 31, 2022, which exceeded 99.9%. We had similar collection rates for the years ended December 31, 2021, 2020 and 2019, which also exceeded 99.9%. Our transition to e-mining, when fully completed is expected to result in reduced production costs, as we have seen historically when we have been able to use electric dredging as our primary mining method. While many factors influence the selection of proppant providers, we believe that our differentiated environmental profile, resulting from our major electrification projects, paired with our ability to reliably provide large volumes of quality proppant at attractive rates makes us a preferred partner for customers similarly prioritizing enhanced sustainability of operations and cost structure optimization.


Drive stockholder value creation by prioritizing our other stakeholders through sustainable environmental and social progress.    We have recognized, from our founding, that long-term profitability for our stockholders can be achieved only by delivering positive outcomes for our other stakeholders—treating our employees well, executing as good stewards in the communities and the environments we do business in, and operating with the highest governance and diligence standards. Though many of our stakeholders are not owners of our business, they do have a meaningful influence in the success of our business. Therefore, to optimize value creation for our stockholders, we strive to provide attractive outcomes for our stakeholders.


Maintain a conservative financial profile in order to provide durable capital returns in a cyclical industry.    The energy services business is historically cyclical, and we believe that a strong balance sheet and substantial liquidity are key, not only for the long-term health of the Company, but also for its ability to continuously return capital to its stockholders through cycles. On a pro forma basis after giving effect to this offering, we expect to have approximately $                million of cash on hand, $                million available under our asset-based loan credit


21


Table of Contents
 

facility (the “2023 ABL Credit Facility”), and $                 outstanding under our credit agreement with Stonebriar Commercial Finance LLC (the “Term Lender”) pursuant to which the Term Lender extended a $180.0 million single advance six-year term loan credit facility (the “2021 Term Loan Credit Facility”). Further, we plan to continue making regular stockholder distributions as we transition into a public company, likely in the form of regular base dividends and potentially a combination of special dividends and share repurchases. Please see the subsection titled “—Recent Developments—Cash Distribution” and the section titled “Dividend Policy.”

Recent Developments

Cash Distribution and Debt Repayment

In January 2023, we made cash distributions to unitholders of Atlas LLC in the aggregate amount of $15.0 million as permitted by the terms of the Third Amended and Restated Limited Liability Company Agreement of Atlas LLC. Concurrent with this distribution, Atlas LLC repaid $3.75 million of the 2021 Term Loan Credit Facility at par per the terms of the 2021 Term Loan Credit Facility agreement.

Sand Supply & Logistics Agreements with Provisions to Support the Dune Express

Atlas has recently signed sand supply and logistics contracts with major oil companies for the delivery of proppant via the Dune Express upon commercial in-service, which is currently expected to take place in 2024.

2023 ABL Credit Facility

On February 22, 2023, the Company, Bank of America, N.A., as administrative agent, and certain financial institutions party thereto as lenders (the “ABL Lenders”) entered into a Loan, Security and Guaranty Agreement (the “ABL Credit Agreement”) pursuant to which the ABL Lenders provide revolving credit financing to the Company in an aggregate principal amount of up to $75.0 million with availability thereunder subject to a borrowing base as described in the ABL Credit Agreement. The 2023 ABL Credit Facility includes a letter of credit sub-facility, which permits issuances of letters of credit up to an aggregate amount of $25.0 million. The scheduled maturity date of the 2023 ABL Credit Facility is February 22, 2028.

Corporate Reorganization

Atlas LLC was formed on April 20, 2017 for the purpose of being an in-basin, pure-play producer and provider of proppant primarily in the Permian Basin.

Atlas Energy Solutions Inc. (“Atlas Inc.”) was incorporated as a Delaware corporation in February 2022. Following this offering and the corporate reorganization described below, (i) Atlas Inc. will be a holding company whose sole material asset will consist of membership interests in Atlas Sand Operating, LLC (“Atlas Operating”), (ii) Atlas Operating will be a holding company whose sole material asset will be 100% of the membership interests in Atlas LLC and (iii) Atlas LLC will own, directly or indirectly, all of our operating assets. After the consummation of this offering and the corporate reorganization described below, Atlas Inc. will be the managing member of Atlas Operating, will be responsible for all operational, management and administrative decisions relating to Atlas LLC’s business and will consolidate the financial results of Atlas LLC and its subsidiaries.


22


Table of Contents

In connection with the completion of this offering, we will engage in the following transactions, which we refer to as the “corporate reorganization”:


a merger will be effected in which Atlas LLC will survive as a wholly owned subsidiary of Atlas Operating;


recently formed holding companies (“HoldCos”) will hold the Legacy Owners’ membership interests in Atlas Operating, which membership interests will be represented by a single class of common units (“Atlas Units”);


the Legacy Owners will indirectly, through the HoldCos, transfer all or a portion of their Atlas Units and voting rights, as applicable, in Atlas Operating to Atlas Inc. in exchange for shares of Class A common stock and, in the case of Legacy Owners continuing to hold Atlas Units through the HoldCos, shares of Class B common stock (so that such Legacy Owners continuing to hold Atlas Units will, through the HoldCos, hold one share of Class B common stock for each Atlas Unit held by them immediately following this offering); and


Atlas Inc. will contribute all of the net proceeds received by it in this offering to Atlas Operating in exchange for a number of Atlas Units (such that the total number of Atlas Units held by Atlas Inc. equals the number of shares of Class A common stock outstanding after this offering), and Atlas Operating will further contribute the net proceeds received to Atlas LLC.

In the event we increase or decrease the number of shares of Class A common stock sold in this offering, the number of Atlas Units held by us immediately following this offering will correspondingly increase or decrease, respectively.

Immediately following this offering, each Legacy Owner’s ownership interest in any shares of Class A common stock, Class B common stock and/or Atlas Units, as the case may be, will be indirect ownership of such securities by virtue of such Legacy Owner’s direct ownership interest in one or more of the HoldCos, which will be the direct record owners of all such securities.

After giving effect to these transactions and this offering and assuming the underwriters’ option to purchase additional shares is not exercised:


the Legacy Owners will collectively own all of the outstanding shares of Class B common stock and                shares of Class A common stock, collectively representing     % of the voting power and    % of the economic interest of Atlas Inc.;


Atlas Inc. will own an approximate     % interest in Atlas Operating; and


the Legacy Owners that continue to hold Atlas Units immediately following the corporate reorganization and this offering will collectively own an approximate     % interest in Atlas Operating.

If the underwriters’ option to purchase additional shares is exercised in full:


the Legacy Owners will collectively own all of the outstanding shares of Class B common stock and                shares of Class A common stock, collectively representing     % of the voting power and    % of the economic interest of Atlas Inc.;


Atlas Inc. will own an approximate     % interest in Atlas Operating; and


the Legacy Owners that continue to hold Atlas Units immediately following the corporate reorganization and this offering will collectively own an approximate     % interest in Atlas Operating.


23


Table of Contents

Each share of Class B common stock has no economic rights but entitles its holder to one vote on all matters to be voted on by stockholders generally. Holders of Class A common stock and Class B common stock will vote together as a single class on all matters presented to our stockholders for their vote or approval, except as otherwise required by applicable law or by our amended and restated certificate of incorporation. We do not intend to list our Class B common stock on any exchange.

Our organizational structure following the offering and corporate reorganization is commonly referred to as an “Up-C” structure. Pursuant to this structure, following this offering we will hold a number of Atlas Units equal to the number of shares of Class A common stock issued and outstanding, and the Atlas Unitholders (other than us) will hold a number of Atlas Units equal to the number of shares of Class B common stock issued and outstanding. The Up-C structure was selected in order to (i) allow certain Legacy Owners the option to continue to hold their economic ownership in Atlas LLC in “pass-through” form for U.S. federal income tax purposes through their direct and indirect ownership of Atlas Units, and (ii) potentially allow us to benefit from certain net cash tax savings that we might realize as a result of certain increases in tax basis that may occur as a result of Atlas Inc.’s acquisition (or deemed acquisition for U.S. federal income tax purposes) of Atlas Units pursuant to the exercise of the Redemption Right (as defined below) or the Call Right (as defined below). In contrast to many offerings by issuers choosing an Up-C structure, we have made the decision not to enter into a tax receivable agreement with the Legacy Owners with respect to any such cash tax savings we might realize, which we believe provides for increased alignment between us and our stockholders over the long term.

Following this offering, under the Amended and Restated Limited Liability Company Agreement of Atlas Sand Operating, LLC (the “Atlas Operating LLC Agreement”), the Atlas Unitholders, other than Atlas Inc., will, subject to certain limitations, have the right (the “Redemption Right”) to cause Atlas Operating to acquire all or a portion of their Atlas Units for, at Atlas Operating’s election, (i) shares of our Class A common stock at a redemption ratio of one share of Class A common stock for each Atlas Unit redeemed, subject to conversion rate adjustments for stock splits, stock dividends, reclassification and other similar transactions, or (ii) an equivalent amount of cash. We will determine whether to issue shares of Class A common stock or cash based on facts in existence at the time of the decision, which we expect would include the relative value of the Class A common stock (including the trading prices for the Class A common stock at the time), the cash purchase price, the availability of other sources of liquidity (such as an issuance of preferred stock) to acquire the Atlas Units and alternative uses for such cash. Alternatively, upon the exercise of the Redemption Right, Atlas Inc. (instead of Atlas Operating) will have the right (the “Call Right”) to, for administrative convenience, acquire each tendered Atlas Unit directly from the redeeming Atlas Unitholder for, at its election, (x) one share of Class A common stock, subject to conversion rate adjustments for stock splits, stock dividends, reclassification and other similar transactions, or (y) an equivalent amount of cash. In connection with any redemption of Atlas Units pursuant to the Redemption Right or the Call Right, a corresponding number of shares of Class B common stock will be cancelled. Please see the section titled “Certain Relationships and Related Party Transactions—Atlas Operating LLC Agreement.”


24


Table of Contents

The following diagram indicates our simplified ownership structure immediately following this offering and the transactions related thereto (assuming the underwriters’ option to purchase additional shares is not exercised):


LOGO


25


Table of Contents

Summary Risk Factors

Investing in our Class A common stock involves risks. You should carefully read the section of this prospectus titled “Risk Factors” and the other information in this prospectus for an explanation of these risks before investing in our Class A common stock. In particular, the following is a summary of some of the principal risks that could materially adversely affect our business, financial condition and results of operations, which could cause a decrease in the price of our Class A common stock and a loss of all or part of your investment.

Risks Related to Our Business and Operations


Our proppant production and logistics operations depend on the level of activity in the oil and natural gas industries, which experiences substantial volatility due to a number of factors, including demand for oil and natural gas, the COVID-19 pandemic, weather, seasonality and demand for proppant, among others.


Increasing costs, a lack of dependability or availability of transportation services, or infrastructure or an oversupply of transportation services could have an adverse effect on our business, financial condition and results of operations.


We may be adversely affected by decreased demand for proppant or the development of technically and cost-effective alternative proppants or new processes to replace hydraulic fracturing.


Given the nature of our proppant production operations, we face a material risk of liability, delays and increased cash costs of production from environmental and industrial accidents and operational breakdowns.


The development of the Dune Express is a complex and challenging process that may take longer and cost more than estimated, or not be completed at all. In addition, successful development and operation of the Dune Express will depend on certain factors that may be outside of our control, and the storage and transportation capacity or other anticipated benefits of our Dune Express may not be achieved.


A negative shift in investor sentiment towards the oil and natural gas industry and increased attention to ESG and conservation matters may adversely impact our business.


Most of our product sales are currently generated at two facilities. Any adverse developments at those facilities could have an adverse effect on our business, financial condition and results of operations.


If we or our customers are not able to obtain and maintain necessary permits, our results of operations could suffer.


An increase in the supply of proppant having similar characteristics as the proppant we produce could make it more difficult for us to renew or replace our existing contracts on favorable terms, or at all.

Risks Related to Financial Conditions


Our indebtedness could adversely affect our financial flexibility and our competitive position.


Our supply agreements contain provisions requiring us to deliver minimum amounts of sand-based proppant. If we are unable to meet our minimum requirements under these contracts, we may be required to pay penalties or the contract counterparty may be able to terminate the agreement.


26


Table of Contents

Risks Related to Environmental, Mining and Other Regulations


Silica-related health issues and legislation, including compliance with existing or future regulations relating to respirable crystalline silica, or litigation could have an adverse effect on our business, reputation or results of operations.


Federal, state and local legislative and regulatory initiatives relating to hydraulic fracturing and the potential for related litigation could result in increased costs, additional operating restrictions or delays for our customers, which could cause a decline in the demand for our proppant and negatively impact our business, results of operations and financial condition.


We and our customers are subject to other extensive regulations, including licensing, plant and wildlife protection and reclamation regulation, that impose, and will continue to impose, significant costs and liabilities. In addition, future regulations, or more stringent enforcement of existing regulations, could increase those costs and liabilities, which could adversely affect our results of operations.

Risks Related to Our Class A Common Stock and Organizational Structure


We are a holding company. Our sole material asset after completion of this offering and our corporate reorganization will be our equity interest in Atlas Operating, and we will accordingly be dependent upon cash distributions from Atlas Operating to cover our taxes and corporate and overhead expenses, among other expenses.


The requirements of being a public company, including compliance with the reporting requirements of the Securities Exchange Act of 1934, as amended (the “Exchange Act”), and the requirements of the Sarbanes-Oxley Act, may strain our resources, increase our costs and distract management, and we may be unable to comply with these requirements in a timely or cost-effective manner.

Emerging Growth Company Status

We are an “emerging growth company” as defined in the Jumpstart Our Business Startups Act (the “JOBS Act”). For as long as we are an emerging growth company, unlike other public companies that are not emerging growth companies under the JOBS Act, we are not required to:


provide an auditor’s attestation report on management’s assessment of the effectiveness of our system of internal control over financial reporting pursuant to Section 404(b) of the Sarbanes-Oxley Act;


provide more than two years of audited financial statements and related management’s discussion and analysis of financial condition and results of operations;


comply with any new requirements that may be adopted by the Public Company Accounting Oversight Board (the “PCAOB”) requiring mandatory audit firm rotation or a supplement to the auditor’s report in which the auditor would be required to provide additional information about the audit and the financial statements of the issuer;


provide certain disclosure regarding executive compensation required of larger public companies or hold stockholder advisory votes on executive compensation required by the Dodd-Frank Wall Street Reform and Consumer Protection Act; or


obtain stockholder approval of any golden parachute payments not previously approved.


27


Table of Contents

We will cease to be an emerging growth company upon the earliest of:


the last day of the fiscal year in which we have $1.235 billion or more in annual revenues;


the date on which we become a “large accelerated filer” (the fiscal year-end on which the total market value of our common equity securities held by non-affiliates is $700 million or more as of June 30);


the date on which we issue more than $1.0 billion of non-convertible debt over a three-year period; or


the last day of the fiscal year following the fifth anniversary of our initial public offering.

In addition, Section 107 of the JOBS Act provides that an emerging growth company can take advantage of the extended transition period provided in Section 7(a)(2)(B) of the Securities Act of 1933, as amended (the “Securities Act”), for complying with new or revised accounting standards. We intend to take advantage of these reporting exemptions until we are no longer an emerging growth company. Our election to use the phase-in periods permitted by this election may make it difficult to compare our financial statements to those of non-emerging growth companies and other emerging growth companies that have opted out of the longer phase-in periods under Section 107 of the JOBS Act and who will comply with new or revised financial accounting standards. If we were to subsequently elect instead to comply with these public company effective dates, such election would be irrevocable pursuant to Section 107 of the JOBS Act.

Principal Executive Offices and Internet Address

Our principal executive offices are located at 5918 W. Courtyard Drive, Suite 500, Austin, Texas 78730, and our telephone number at that address is (512) 220-1200. Our website address is https://atlas.energy. We expect to make our periodic reports and other information filed with or furnished to the SEC available free of charge through our website as soon as reasonably practicable after those reports and other information are electronically filed with or furnished to the SEC. Information contained on, or otherwise accessible through, our website or any other website is not incorporated herein by reference and does not constitute part of this prospectus.


28


Table of Contents

The Offering


Class A common stock offered by us

                 shares (                 shares if the underwriters’ option to purchase additional shares is exercised in full).


Class A common stock to be outstanding immediately after completion of this offering

                 shares (                 shares if the underwriters’ option to purchase additional shares is exercised in full).


Class B common stock to be outstanding immediately after completion of this offering

                 shares, or one share for each Atlas Unit held by certain Legacy Owners immediately following this offering and any exercise of the underwriters’ option to purchase additional shares. Class B shares are non-economic. In connection with any redemption of Atlas Units pursuant to the Redemption Right or the Call Right, a corresponding number of shares of Class B common stock will be cancelled.


Voting power of Class A common stock after giving effect to this offering

    % (or (i)     % if the underwriters’ option to purchase additional shares is exercised in full and (ii) 100% if all outstanding Atlas Units held by certain Legacy Owners were redeemed, along with a corresponding number of shares of our Class B common stock, for newly issued shares of Class A common stock on a one-for-one basis).


Voting power of Class B common stock after giving effect to this offering

    % (or (i)     % if the underwriters’ option to purchase additional shares is exercised in full and (ii) 0% if all outstanding Atlas Units held by certain Legacy Owners were redeemed, along with a corresponding number of shares of our Class B common stock, for newly issued shares of Class A common stock on a one-for-one basis).


Voting rights

Each share of our Class A common stock entitles its holder to one vote on all matters to be voted on by stockholders generally. Each share of our Class B common stock entitles its holder to one vote on all matters to be voted on by stockholders generally. Holders of our Class A common stock and Class B common stock vote together as a single class on all matters presented to our stockholders for their vote or


29


Table of Contents
 

approval, except as otherwise required by applicable law or by our amended and restated certificate of incorporation. Please see “Description of Capital Stock.”


Use of proceeds

We expect to receive approximately $                 million of net proceeds from the sale of Class A common stock, after deducting underwriting discounts and estimated offering expenses payable by us (assuming the midpoint of the price range set forth on the cover page of this prospectus) (or approximately $                 million if the underwriters’ option to purchase additional shares is exercised in full).


  We intend to contribute all of the net proceeds of this offering to Atlas Operating in exchange for Atlas Units and Atlas Operating will further contribute the net proceeds received to Atlas LLC. Atlas LLC will use:


approximately $                 million of the net proceeds of this offering to fund the construction of the Dune Express; and


approximately $                 million of the net proceeds of this offering to fund general corporate purposes.


  Please see “Use of Proceeds” for a more complete description of the intended use of proceeds from this offering.


Dividend policy

We expect to pay dividends on our Class A common stock in amounts determined from time to time by our board of directors. Future dividend levels will depend on the earnings of our subsidiaries, their financial condition, cash requirements, regulatory restrictions any restrictions in financing agreements and other factors deemed relevant by the board of directors. Please see “Dividend Policy.”


Redemption rights of Atlas Unitholders

Following this offering, under the Atlas Operating LLC Agreement, the Atlas Unitholders, other than Atlas Inc., will, subject to certain limitations, have the right, pursuant to the Redemption Right, to cause Atlas Operating to acquire all or a portion of their Atlas Units for, at Atlas Operating’s election, (i) shares of our Class A common stock at a redemption ratio of one share


30


Table of Contents
 

of Class A common stock for each Atlas Unit redeemed, subject to conversion rate adjustments for stock splits, stock dividends, reclassification and other similar transactions, or (ii) an equivalent amount of cash. Alternatively, upon the exercise of the Redemption Right, Atlas Inc. (instead of Atlas Operating) will have the right, pursuant to the Call Right, to, for administrative convenience, acquire each tendered Atlas Unit directly from the redeeming Atlas Unitholder for, at its election, (x) one share of Class A common stock, subject to conversion rate adjustments for stock splits, stock dividends, reclassification and other similar transactions, or (y) an equivalent amount of cash. In connection with any redemption of Atlas Units pursuant to the Redemption Right or the Call Right, a corresponding number of shares of Class B common stock will be cancelled. Please see “Certain Relationships and Related Party Transactions—Atlas Operating LLC Agreement.”


Directed share program

At our request, an affiliate of BofA Securities, Inc., a participating Underwriter, has reserved for sale, at the initial public offering price, up to 5% of the shares offered by this prospectus for sale to some of our directors, officers, employees, distributors, dealers, business associates and related persons. If these persons purchase reserved shares it will reduce the number of shares available for sale to the general public. Any reserved shares that are not so purchased will be offered by the underwriters to the general public on the same terms as the other shares offered by this prospectus.


Proposed listing symbol

We have applied to list our Class A common stock on the NYSE under the symbol “AESI.”


Risk factors

You should carefully read and consider the information set forth under the heading “Risk Factors” and all other information set forth in this prospectus before deciding to invest in our Class A common stock.

The information above excludes (i) shares of Class A common stock reserved for issuance under our long-term incentive plan (the “LTIP”), which we intend to adopt in connection with the completion of this offering and (ii) shares of Class A common stock reserved for issuance in connection with any exercise of the Redemption Right or Call Right.


31


Table of Contents

Summary Historical and Pro Forma Financial and Operating Data

Atlas Inc. was formed on February 3, 2022 and does not have historical financial results. The following table shows the summary historical condensed consolidated financial information of our Predecessor and the summary pro forma financial information of Atlas Inc. for the periods and as of the dates indicated.

The summary historical condensed consolidated financial information of our Predecessor as of and for the years ended December 31, 2022, 2021, and 2020 was derived from the historical audited consolidated financial statements of our Predecessor included elsewhere in this prospectus.

The summary unaudited pro forma statement of operations and balance sheet data as of and for the year ended December 31, 2022 has been prepared to give pro forma effect to (i) the reorganization transactions described under “Corporate Reorganization” and (ii) this offering and the application of the net proceeds therefrom as if each had been completed as of January 1, 2022, in the case of the statement of operations data, and on December 31, 2022, in the case of the balance sheet data. This information is subject to and gives effect to the assumptions and adjustments described in the notes accompanying the unaudited pro forma financial statements included elsewhere in this prospectus. The summary unaudited pro forma financial and operating data is presented for informational purposes only and should not be considered indicative of actual results of operations that would have been achieved had such transactions been consummated on the dates indicated, and does not purport to be indicative of statements of financial position or results of operations as of any future date or for any future period.

The following table should be read together with the sections titled “Use of Proceeds,” “Management’s Discussion and Analysis of Financial Condition and Results of Operations” and “Corporate Reorganization,” and the historical consolidated financial statements of our Predecessor, our pro forma financial statements and related notes included elsewhere in this prospectus.


     Predecessor  
     Year ended December 31,  
     2022     2021     2020  
     (In thousands, except percentages and
per ton amounts)
 

Statement of Operations Data:


Total sales

   $ 482,724     $ 172,404     $ 111,772  

Cost of sales (excluding depreciation, depletion and accretion expense)

     198,918       84,656       73,118  

Depreciation, depletion and accretion expense

     27,498       23,681       20,887  


Gross profit

     256,308       64,067       17,767  

Selling, general and administrative expense

     24,317       17,071       17,743  

Impairment of long-lived assets

     —         —         1,250  


Operating income (loss)

     231,991       46,996       (1,226

Interest expense, net(1)

     (15,760     (42,198     (32,819

Other income (loss)

     2,631       291       (25


Income (loss) before income taxes

     218,862       5,089       (34,070

Income tax expense

     1,856       831       372  


Net income (loss)

   $ 217,006     $ 4,258     $ (34,442


32


Table of Contents
     Predecessor  
     Year ended December 31,  
     2022     2021     2020  
     (In thousands, except percentages and
per ton amounts)
 

Pro Forma Information (unaudited):


Pro forma net income (loss)(2)


Pro forma non-controlling interest(3)


Pro forma net income (loss) attributable to common stockholders(4)


Pro forma net income (loss) per common share attributable to common stockholders(2)(4)


Basic


Diluted


Pro forma weighted-average shares outstanding(4)


Basic


Diluted


Other Data:


Sales Volumes (tons)

     10,186,886       8,279,036       6,317,716  

Contribution Margin(5)

   $ 283,806     $ 87,748     $ 38,654  

Adjusted EBITDA(5)

   $ 263,983     $ 71,954     $ 24,667  

Adjusted EBITDA Margin(5)

     54.7     41.7     22.1

Adjusted Free Cash flow(5)

   $ 228,510     $ 64,239     $ 19,686  

Adjusted Free Cash Flow Margin(5)

     47.3     37.3     17.6

Adjusted Free Cash Flow Conversion(5)

     86.6     89.3     79.8

Net Debt

   $ 87,140     $ 137,773     $ 158,736  

Cost of Sales per ton(6)

   $ 19.53     $ 10.23     $ 11.57  

Statement of Cash Flows Data:


Net cash provided by operating activities

   $ 206,012     $ 21,356     $ 12,486  

Net cash used in investing activities

     (89,592     (19,371     (9,532

Net cash provided by (used in) financing activities

     (74,811     2,344       11,826  


Net increase in cash and cash equivalents

   $ 41,609     $ 4,329     $ 14,780  


Balance Sheet Data (at end of period):


Cash and cash equivalents

   $ 82,010     $ 40,401     $ 36,072  

Total assets

   $ 750,999     $ 543,850     $ 521,742  

Long-term debt, net of discount and deferred financing costs(7)

     126,588       159,712       134,844  

Total liabilities

     239,642       205,153       190,045  

Total members’ equity

   $ 511,357     $ 338,697     $ 331,697  


(1)

For the year ended December 31, 2021, includes loss on extinguishment of debt of $11.9 million resulting from the recognition of unamortized debt discount and deferred financing costs upon redemption of the 2018 Term Loan Credit Facility. Additionally, there was a make-whole premium of $4.5 million paid upon redemption of the 2018 Term Loan Credit Facility.

(2)

Pro forma net income (loss) reflects pro forma income tax expense of $                 for the year ended December 31, 2022 associated with the income tax effects of this offering and the corporate reorganization described under the section titled “Corporate Reorganization.” Atlas Inc. is a corporation and is subject to U.S. federal income tax. Our Predecessor is and was generally not subject to U.S. federal income tax at an entity level. As a result, the consolidated net income in our Predecessor’s historical financial statements does not reflect the tax expense we would have incurred if we had been subject to U.S. federal income tax at an entity level during such periods.

(3)

Reflects the pro forma adjustment to non-controlling interest and net income attributable to common stockholders to reflect the ownership of Atlas Units by the Legacy Owners holding Atlas Units immediately following the corporate reorganization and this offering.


33


Table of Contents
(4)

Pro forma net income per share attributable to common stockholders and weighted average shares reflect the estimated number of shares of Class A common stock we expect to have outstanding upon the completion of our corporate reorganization described under the section titled “Corporate Reorganization” and this offering. On a pro forma basis for the year ended December 31, 2022, the potential redemption of Atlas Units and cancellation of the corresponding shares of Class B common stock has been excluded from the reported diluted weighted average shares outstanding used to compute diluted earnings per share as the impact of such redemption would be antidilutive. We use the “if-converted” method to determine the potential dilutive effect of our Class B common stock.

(5)

Please read “—Non-GAAP Financial Measures” below for the definitions of Adjusted EBITDA, Adjusted EBITDA Margin, Adjusted Free Cash Flow, Adjusted Free Cash Flow Margin, Adjusted Free Cash Flow Conversion, Contribution Margin and Net Debt and a reconciliation of Adjusted EBITDA, Adjusted EBITDA Margin, Adjusted Free Cash Flow, Adjusted Free Cash Flow Margin, Adjusted Free Cash Flow Conversion, Contribution Margin and Net Debt to our most directly comparable financial measures calculated and presented in accordance with GAAP.

(6)

Includes the cost of sales for product sales and service sales. Excludes cost of sales depreciation, depletion and accretion expense.

(7)

Excludes long-term finance right-of-use lease liabilities.

Non-GAAP Financial Measures

Adjusted EBITDA, Adjusted EBITDA Margin, Adjusted Free Cash Flow, Adjusted EBITDA less Capital Expenditures, Adjusted Free Cash Flow Margin, Adjusted EBITDA less Capital Expenditures Margin, Adjusted Free Cash Flow Conversion, Contribution Margin and Net Debt are non-GAAP supplemental financial measures used by our management and by external users of our financial statements such as investors, research analysts and others, in the case of Adjusted EBITDA, to assess our operating performance on a consistent basis across periods by removing the effects of development activities, provide views on capital resources available to organically fund growth projects and, in the case of Adjusted Free Cash Flow and Adjusted EBITDA less Capital Expenditures, assess the financial performance of our assets and their ability to sustain dividends over the long term without regard to financing methods, capital structure, levels of reinvestment or historical cost basis.

We define Adjusted EBITDA as net income (loss) before depreciation, depletion and accretion, interest expense, net, income tax expense, expense related to workforce reduction, impairment of long-lived assets, unit-based compensation, loss on disposal of property, plant and equipment, gain (loss) on extinguishment of debt and unrealized commodity derivative gain (loss). Management believes Adjusted EBITDA is useful because it allows them to more effectively evaluate our operating performance and compare the results of our operations from period to period and against our peers without regard to our financing methods or capital structure. We exclude the items listed above from net income in arriving at Adjusted EBITDA because these amounts can vary substantially from company to company within our industry depending upon accounting methods and book values of assets, capital structures and the method by which the assets were acquired.

We define Adjusted EBITDA Margin as Adjusted EBITDA divided by total sales.

We define Adjusted Free Cash Flow as Adjusted EBITDA less maintenance capital expenditures. We define Adjusted EBITDA less Capital Expenditures as Adjusted EBITDA less Net Cash Used in Investing Activities. We believe that Adjusted Free Cash Flow and Adjusted EBITDA less Capital Expenditures are useful to investors as it provides a measure of the ability of our business to generate cash.

We define Adjusted Free Cash Flow Margin as Adjusted Free Cash Flow divided by total sales.

We define Adjusted EBITDA less Capital Expenditures Margin as Adjusted EBITDA less Capital Expenditures divided by total sales.


34


Table of Contents

We define Adjusted Free Cash Flow Conversion as Adjusted Free Cash Flow divided by Adjusted EBITDA.

We define Contribution Margin as gross profit plus depreciation, depletion and accretion expense.

We define Maintenance Capital Expenditures as capital expenditures excluding growth capital expenditures.

We define Net Debt as total debt, net of discount and deferred financing costs, plus discount and deferred financing costs, plus right-of-use lease liabilities, less cash and cash equivalents.

Adjusted EBITDA, Adjusted EBITDA Margin, Adjusted Free Cash Flow, Adjusted EBITDA less Capital Expenditures, Adjusted Free Cash Flow Margin, Adjusted EBITDA less Capital Expenditures Margin, Adjusted Free Cash Flow Conversion, Contribution Margin and Net Debt do not represent and should not be considered alternatives to, or more meaningful than, net income, income from operations, cash flows provided by operating activities or any other measure of financial performance presented in accordance with GAAP as measures of our financial performance. Adjusted EBITDA, Adjusted Free Cash Flow, and Adjusted EBITDA less Capital Expenditures have important limitations as analytical tools because they exclude some but not all items that affect net income, the most directly comparable GAAP financial measure. Our computation of Adjusted EBITDA, Adjusted EBITDA Margin, Adjusted Free Cash Flow, Adjusted Free Cash Flow Margin, Adjusted EBITDA less Capital Expenditures, Adjusted EBITDA less Capital Expenditures Margin, Adjusted Free Cash Flow Conversion, Contribution Margin and Net Debt may differ from computations of similarly titled measures of other companies.


35


Table of Contents

The following table presents a reconciliation of Adjusted EBITDA, Adjusted EBITDA Margin, Adjusted Free Cash Flow, Adjusted EBITDA less Capital Expenditures, Adjusted Free Cash Flow Margin, Adjusted EBITDA less Capital Expenditures Margin, Adjusted Free Cash Flow Conversion, Contribution Margin and Net Debt to the most directly comparable GAAP financial measure for the periods indicated.


     Predecessor  
     Year ended December 31,  
     2022      2021     2020  
     (In thousands)  

Net income (loss)(1)

   $ 217,006      $ 4,258     $ (34,442

Depreciation, depletion and accretion expense

     28,617        24,604       21,579  

Interest expense, net

     15,760        30,276       32,819  

Income tax expense

     1,856        831       372  


EBITDA

     263,239        59,969       20,328  

Unit-based compensation expense

     678        129       2,545  

Impairment of long-lived assets

     —          —         1,250  

Reduction in workforce expense

     —          —         426  

Loss on disposal of property, plant and equipment

     —          —         118  

Loss on extinguishment of debt

     —          11,922       —    

Unrealized derivative (gain) loss

     66        (66     —    


Adjusted EBITDA

     263,983        71,954       24,667  

Maintenance Capital Expenditures

     35,473        7,715       4,981  


Adjusted Free Cash Flow

   $ 228,510      $ 64,239     $ 19,686  


     Predecessor  
     For the Year Ended December 31,  
     2022      2021     2020  
     (In thousands)  

Net income (loss)(1)

   $ 217,006      $ 4,258     $ (34,442

Depreciation, depletion and accretion expense

     28,617        24,604       21,579  

Interest expense, net

     15,760        30,276       32,819  

Income tax expense

     1,856        831       372  


EBITDA

     263,239        59,969       20,328  

Unit-based compensation expense

     678        129       2,545  

Impairment of long-lived assets

     —          —         1,250  

Reduction in workforce expense

     —          —         426  

Loss on disposal of property, plant and equipment

     —          —         118  

Loss on extinguishment of debt

     —          11,922       —    

Unrealized derivative (gain) loss

     66        (66     —    


Adjusted EBITDA

     263,983        71,954       24,667  


Capital expenditures

     89,592        19,371       9,532  


Adjusted EBITDA less Capital Expenditures

   $ 174,391      $ 52,583     $ 15,135  


36


Table of Contents
     Predecessor  
     Year ended December 31,  
     2022     2021     2020  
     (In thousands)  

Cash from operating activities

   $ 206,012     $ 21,356     $ 12,486  

Repayment of paid-in-kind interest borrowings

     —         22,233       —    

Current income tax expense (benefit)(2)

     1,858       471       (294

Change in operating assets and liabilities

     41,774       8,622       (369

Cash interest expense(2)

     14,904       19,173       12,136  

Maintenance Capital Expenditures

     (35,473     (7,715     (4,981

Other

     (565     99       282  

Reduction in workforce expense

     —         —         426  


Adjusted Free Cash Flow

   $ 228,510     $ 64,239     $ 19,686  


     Predecessor  
     For the Year Ended December 31,  
     2022     2021     2020  
     (In thousands, except percentages)  

Cash from operating activities

   $ 206,012     $ 21,356     $ 12,486  

Repayment of paid-in-kind interest borrowings

     —         22,233       —    

Current income tax expense (benefit)(2)

     1,858       471       (294

Change in operating assets and liabilities

     41,774       8,622       (369

Cash interest expense(2)

     14,904       19,173       12,136  

Capital expenditures

     (89,592     (19,371     (9,532

Other

     (565     99       282  

Reduction in workforce expense

     —         —         426  


Adjusted EBITDA less Capital Expenditures

   $ 174,391     $ 52,583     $ 15,135  


Adjusted EBITDA Margin

     54.7     41.7     22.1

Adjusted EBITDA less Capital Expenditure Margin

     36.1     30.5     13.5

Adjusted Free Cash Flow Margin

     47.3     37.3     17.6

Adjusted Free Cash Flow Conversion

     86.6     89.3     79.8


     Predecessor  
     Year ended December 31,  
     2022      2021      2020  
     (In thousands)  

Gross Profit

   $ 256,308      $ 64,067      $ 17,767  

Depreciation, depletion and accretion expense

     27,498        23,681        20,887  


Contribution Margin

   $ 283,806      $ 87,748      $ 38,654  


     Predecessor  
     Year ended December 31,  
     2022     2021     2020  
     (In thousands)  

Total Debt

   $ 147,174     $ 175,275     $ 174,428  

Discount and deferred financing costs

     1,821       2,264       19,591  

Finance right-of-use lease liabilities(3)

     20,155       —         —    

Capital lease liabilities(3)

     —         635       789  

Less: Cash and cash equivalents

     (82,010     (40,401     (36,072


Net Debt

   $ 87,140     $ 137,773     $ 158,736  


37


Table of Contents


(1)

Pro forma net income (loss) reflects pro forma income tax expense of $             for the year ended December 31, 2022, associated with the income tax effects of this offering and the corporate reorganization described under the section titled “Corporate Reorganization.” Atlas Inc. is a corporation and is subject to U.S. federal income tax. Our Predecessor is and was generally not subject to U.S. federal income tax at an entity level. As a result, the consolidated net income in our Predecessor’s historical financial statements does not reflect the tax expense we would have incurred if we had been subject to U.S. federal income tax at an entity level during such periods.

(2)

A reconciliation of the adjustment of these items used to calculate Adjusted Free Cash Flow to the Consolidated Financial Statements is included below.

(3)

On January 1, 2022, the Company adopted ASU 2016-02, Leases (Topic 842), which resulted in the recognition of $0.6 million of finance right-of-use lease liabilities, previously recognized as capital lease liabilities. Information prior to January 1, 2022 has not been restated and continues to be reported under the accounting standards in effect for the period (ASC Topic 840).


     Predecessor  
     Year ended December 31,  
     2022     2021     2020  
     (In thousands)  

Current tax expense reconciliation


Income tax expense

   $ 1,856     $ 831     $ 372  

Less: deferred tax liabilities

     2       (360     (666


Current income tax expense

   $ 1,858     $ 471     $ (294


Cash interest expense reconciliation


Interest expense, net, excluding loss on extinguishment of debt

   $ 15,760     $ 30,276     $ 32,819  

Less: Interest paid-in-kind through issuance of additional term loans

     —         (3,039     (11,794

Less: Amortization of debt discount

     (457     (7,320     (8,110

Less: Amortization of deferred financing costs

     (442     (739     (791

Less: Other

     43       (5     12  


Cash interest expense

   $ 14,904     $ 19,173     $ 12,136  


Maintenance capital expenditures, accrual basis reconciliation


Purchase of property, plant and equipment

   $ 89,592     $ 19,371     $ 9,532  

Changes in operating assets and liabilities associated with investing activities(1)

     20,747       2,362       (844

Less: Growth capital expenditures and capital lease additions

     (74,866     (14,018     (3,707


Maintenance Capital Expenditures, accrual basis

   $ 35,473     $ 7,715     $ 4,981  


(1)

Positive working capital changes reflect capital expenditures in the current period that will be paid in a future period. Negative working capital changes reflect capital expenditures incurred in a prior period but paid during the period presented.


38


Table of Contents

RISK FACTORS

Investing in our Class A common stock involves risks. The risks described below as well as information in this prospectus should be considered carefully, including our consolidated financial statements and the notes thereto, and the matters addressed under the sections titled “Management’s Discussion and Analysis of Financial Condition and Results of Operations” and “Cautionary Statement Regarding Forward-Looking Statements,” before making an investment decision. The risks and uncertainties described below are not the only ones we face. Additional risks not presently known to us or that we currently deem immaterial may also materially affect our business. The occurrence of any of the following risks or additional risks and uncertainties that are currently immaterial or unknown could materially and adversely affect our business, financial condition, liquidity, results of operations, cash flows and prospects. In such an event, the trading price of our Class A common stock could decline, and you may lose all or part of your investment.

Risks Related to Our Business and Operations

Our proppant production and logistics operations depend on the level of activity in the oil and natural gas industries, which experience substantial volatility.

Our operations that produce and transport proppant are materially dependent on the levels of activity in oil and natural gas exploration, development and production. More specifically, the demand for the proppant we produce is closely related to the number of oil and natural gas wells completed in geological formations where sand-based proppant is used in fracture treatments. These activity levels are affected by both short- and long-term trends in oil and natural gas prices. In recent years, oil and natural gas prices and, therefore, the level of exploration, development and production activity, have experienced significant volatility.

When oil and natural gas prices decrease, exploration and production companies may reduce their exploration, development, production and well completion activities. During such periods, demand for our product and services which supply oil and natural gas wells, including our transportation and logistics solutions, may decline, and may lead to a decline in the market price of proppant, if the supply of proppant is not similarly reduced. When demand for proppant increases, there may not be a corresponding increase in the prices for our products or our customers may not increase use of our products, which could have an adverse effect on our business, financial condition and results of operations.

Worldwide economic, political and military events, including war, terrorist activity, events in the Middle East and initiatives by the Organization of the Petroleum Exporting Countries (“OPEC”), have contributed, and are likely to continue to contribute, to oil and natural gas price volatility. For example, in February 2022, Russia invaded Ukraine and is still engaged in active armed conflict against the country. The conflict and the sanctions imposed in response have led to regional instability and caused dramatic fluctuations in global financial markets and have increased the level of global economic uncertainty, including uncertainty about world-wide oil supply and demand, which in turn has caused increased volatility in commodity prices. Additionally, warmer than normal winters in North America and other weather patterns may adversely impact the short-term demand for natural gas and, therefore, demand for our products. Reduction in demand for natural gas to generate electricity could also adversely impact the demand for proppant. In addition, any future decrease in the rate at which oil and natural gas reserves are discovered or developed, whether due to increased governmental regulation, limitations on exploration and drilling activity, technological innovations that result in new processes for oil and natural gas production that do not require proppant or other factors, could adversely affect the demand for our products, even in a stronger oil and natural gas price environment. Moreover, the energy transition to a low carbon economy, increased deployment of renewable power generation,


39


Table of Contents

renewable fuels and electric vehicles all have the potential to reduce demand for oil and natural gas and consequently the services we provide. The continued or future occurrence of any of these risks could have an adverse effect on our business, financial condition and results of operations.

Our business is subject to the cyclical nature of our customers’ businesses and on the oil and natural gas industry.

Our business is directly affected by capital spending to explore for, develop and produce oil and natural gas in the United States. The oil and natural gas industry is cyclical and historically has experienced periodic downturns in activity. During periods of economic slowdown in one or more of the industries or geographic regions we serve or in the worldwide economy, our customers often reduce their production and capital expenditures by deferring or canceling pending projects, even if such customers are not experiencing financial difficulties. These developments can have an adverse effect on sales of our products and our results of operations.

Weakness in the industries we serve has had, and may in the future have, an adverse effect on sales and our results of operations. A continued or renewed economic downturn in one or more of the industries that we serve, or in the worldwide economy, could cause actual results of operations to differ materially from historical and expected results.

Industry conditions are influenced by numerous factors over which we have no control, including:


expected economic returns to E&P companies of new well completions;


domestic and foreign economic conditions and supply of and demand for oil and natural gas;


the level of prices, and expectations about future prices, of oil and natural gas;


the level of global oil and natural gas exploration and production, and inventories;


federal, state and local regulation of hydraulic fracturing and exploration and production activities;


United States federal, tribal, state and local and non-United States governmental laws, regulations and taxes, including the policies of governments regarding the exploration for and production and development of their oil and natural gas reserves;


changes in the transportation industry that services our business, including the price and availability of transportation;


political and economic conditions in oil and natural gas producing countries, including uncertainty or instability resulting from civil unrest, terrorism or war, such as the current conflict between Russia and Ukraine;


actions by members of OPEC, Russia and other oil-producing countries with respect to oil production levels and announcements of potential changes in such levels, including the failure of such countries to comply with supply limitation and production cuts;


global or national health epidemics, such as the ongoing COVID-19 pandemic (including the spread of variants or mutant strains);


political or civil unrest in the United States or elsewhere;


worldwide political, military and economic conditions;


stockholder activism or activities by non-governmental organizations to limit certain sources of funding for the energy sector or restrict the exploration, development and production of oil and natural gas;


40


Table of Contents
   

advances in exploration, development and production technologies or in technologies affecting energy consumption; and


the potential acceleration of development of alternative fuels.

Decreased demand for proppant or the development of technically and cost-effective alternative proppants or new processes to replace hydraulic fracturing would negatively impact our business.

Frac sand is the most commonly used proppant in the completion and re-completion of oil and natural gas wells through hydraulic fracturing. A significant shift in demand from frac sand to other proppants, such as ceramic proppant, the development and use of other effective alternative proppants, or the development of new processes to replace hydraulic fracturing altogether, could cause a decline in demand for frac sand that we produce and would have an adverse effect on our business, financial condition and results of operations.

In addition, fuel conservation measures, alternative fuel requirements and increasing consumer demand for alternatives to oil and natural gas could reduce demand for oil and natural gas. The impact of the reduced demand for oil and natural gas may have an adverse effect on our business, financial condition, prospects, results of operations and cash flows. Additionally, the increased competitiveness of alternative energy sources (such as wind, solar, geothermal, tidal and biofuels) could reduce demand for oil and natural gas and therefore for our product and services, which would lead to a reduction in our revenues and negatively impact our business, financial condition and results of operations.

Our future performance will depend on our ability to succeed in competitive markets and on our ability to appropriately react to potential fluctuations in demand for, and supply of, our products and services.

We operate in a highly competitive market that is characterized by a small number of large, national producers and a larger number of small, regional or local producers. Transportation costs are a significant portion of the total cost to customers of proppant (in many instances transportation costs can represent more than 50% of delivered cost), the proppant market is typically local, and competition from beyond the local area is limited. Further, competition in the industry is based on customer relationships, reliability of supply, consistency and quality of product, customer service, site location, distribution capability, breadth of product offering, technical support and price.

Some of our competitors may have or may develop greater financial, natural and other resources than we do. Periodically, some of our competitors may reduce the pricing that they offer to our customers for a variety of reasons. One or more of our competitors may develop technology superior to ours or may have production facilities located in closer proximity to certain customer location than we do. For example, mobile mines may be able to mine resources in close proximity to wells, enabling them to deliver sand with significantly lower transportation costs. When the demand for hydraulic fracturing services decreases or the supply of proppant available in the market increases, prices in the proppant market can materially decrease. Our competitors may choose to consolidate, which could provide them with greater financial and other resources than us and improve their competitive positioning. Furthermore, oil and natural gas exploration and production companies and other providers of hydraulic fracturing services have acquired, and in the future may acquire, their own proppant reserves to fulfill their proppant requirements, and these other market participants may expand their existing proppant production capacity, all of which would negatively impact demand for our proppant. In addition, increased competition in the proppant industry could have an adverse impact on our ability to enter into long-term contracts or to enter into contracts on favorable terms.


41


Table of Contents

Past performance by members of our management team, our directors or their respective affiliates may not be indicative of future performance of an investment in us.

Information regarding performance by, or businesses associated with, our management team, our directors and their affiliates is presented for informational purposes only. Past performance of our management team, our directors and their affiliates is not a guarantee of our future success or similar results. You should not rely on the historical record of the performance of our management team, our directors or their affiliates as being indicative of the future performance of an investment in us or the returns we will, or are likely to, generate going forward.

Increasing costs, a lack of dependability or availability of transportation services or infrastructure or an oversupply of transportation services could have an adverse effect on our business, financial condition and results of operations.

The transportation industry is subject to possible legislative and regulatory changes that may affect the economics of the industry by requiring changes in operating practices or by changing the demand or the cost of providing truckload services.

Transportation and related costs tend to be a significant component of the total delivered cost to our customers purchasing our proppant. The high relative cost of transportation related expense tends to favor manufacturers located in close proximity to the customer. Additionally, increases in the price of transportation costs, including freight charges, fuel surcharges and demurrage costs, could negatively impact operating costs if we are unable to pass those increased costs along to our customers. Failure to find long-term solutions to these logistical challenges could adversely affect our ability to respond quickly to the needs of our customers or result in additional increased costs, and thus could negatively impact our business, results of operations and financial condition.

Our operations are subject to operational hazards and inherent risks, some of which are beyond our control, and some of which may not be fully covered by insurance.

Our business and operations may be affected by natural or man-made disasters and other external events, many of which are not in our control. In addition to the other risks described in these risk factors, these risks include:


unanticipated ground, grade or water conditions;


environmental hazards;


physical facility security breaches;


inability to acquire or maintain necessary permits or mining or water rights;


failure to maintain dust controls and meet restrictions on respirable crystalline silica dust;


failures in quality control systems or training programs;


technical difficulties or key equipment failures;


inability to obtain necessary mining or production equipment or replacement parts;


fires, explosions or industrial accidents or other accidents; and


facility shutdowns in response to environmental regulatory actions.

These hazards can also cause personal injury and loss of life, severe damage to and destruction of property and equipment, pollution or environmental damage and suspension or cancellation of operations. Any prolonged downtime or shutdowns at our mining properties or production facilities


42


Table of Contents

could have an adverse effect on our business, financial condition and results of operations. In addition, our operations are subject to, and exposed to, employee/employer liabilities and risks such as wrongful termination, discrimination, labor organizing, retaliation claims and general human resource related matters.

Not all of these risks are reasonably insurable, and our insurance coverage contains limits, deductibles, exclusions and endorsements. Our insurance coverage may not be sufficient to meet our needs in the event of loss and any such loss may have an adverse effect on our business, financial condition and results of operations.

Our ability to produce our products economically and in commercial quantities could be impaired if we are unable to acquire adequate supplies of water for our dredging operations.

The dredging process that we currently employ to produce from our Kermit and Monahans facilities requires significant quantities of water from the aquifer underlying our acreage. If in the future there is insufficient capacity available from this aquifer to provide a source of water for our dredging and associated processes as a result of drought or similar conditions affecting the environment, we will be required to obtain water from other sources that may not be available, or may be too costly, and we may be unable to continue our dredge mining operations entirely. The effects of climate change may also further exacerbate water scarcity in certain regions, including at the aquifer on our acreage. If such an event were to require us to discontinue dredging and resume operations using traditional proppant production processes, this could impair our cost of operations and ability to economically produce our reserves and would have an adverse effect on our financial condition, results of operations and cash flows.

Failure to maintain effective quality control systems at our mining and production facilities could have an adverse effect on our business, financial condition and operations.

The quality and safety of our products are critical to the success of our business. These factors depend significantly on the effectiveness of our quality control systems, which, in turn, depend on a number of factors, including the design of our quality control systems, our quality-training program and our ability to ensure that our employees adhere to the quality control policies and guidelines. Any significant failure or deterioration of our quality control systems could have an adverse effect on our business, financial condition, results of operations and reputation.

Given the nature of our proppant production operations, we face a material risk of liability, delays and increased cash costs of production from environmental and industrial accidents and operational breakdowns.

Our business involves significant risks and hazards, including environmental hazards, industrial accidents and breakdowns of equipment and machinery. Our electric dredge mining operations are subject to delays and accidents associated with electrical supply, repositioning and maintenance. Furthermore, during operational breakdowns, the relevant facility may not be fully operational within the anticipated timeframe, which could result in further business losses. The occurrence of any of these or other hazards could delay production, suspend operations, increase repair, maintenance or medical costs and, due to the integration of our facilities, could have an adverse effect on the productivity and profitability of a particular facility or on our business as a whole. Although insurance policies provide limited coverage for these risks, such policies will not fully cover some of these risks.

The development of the Dune Express is a complex and challenging process that may take longer and cost more than estimated, or not be completed at all. In addition, successful


43


Table of Contents

development and operation of the Dune Express will depend on certain factors that may be outside of our control, and the storage and transportation capacity or other anticipated benefits of our Dune Express may not be achieved.

We may encounter adverse geological conditions, regulatory procedures or other legal requirements that could impede the construction or operation of the Dune Express. The inability to obtain any permits and other federal, state or local approvals that may be required, and any excessive delays in obtaining such permits and approvals due, for example, to litigation or third-party appeals, could potentially prevent us from successfully constructing and operating the Dune Express in a timely manner.

We plan to engage qualified construction firms to perform work associated with the construction of the Dune Express. However, if such firms experience delays, if they perform sub-standard work or if we fail to properly monitor the quality of their work or the timeliness of their progress, we may not be able to complete construction or begin operation of the Dune Express by the date or at the cost currently estimated. In any such circumstance, we could also face difficulties meeting certain delivery obligations to our customers or incur additional costs in making such deliveries by truck or other alternative means. Any material delay caused by our construction firms and subcontractors could therefore ultimately impact our ability achieve the anticipated benefits of the Dune Express and its integrated mining facilities and have an adverse effect on our business, financial condition and results of operations.

Operation of the Dune Express will depend on transmission and distribution facilities. If transmission to the Dune Express or any of its integrated mining facilities were to be interrupted physically, mechanically or with cyber means, it may hinder our ability to mine, sell or deliver proppant to our customers, satisfy our contractual obligations or otherwise operate or fully realize the expected benefits of the Dune Express.

A negative shift in investor sentiment towards the oil and natural gas industry and increased attention to environmental, social and governance (“ESG”) and conservation matters may adversely impact our business.

Increasing attention to climate change and natural capital, societal expectations on companies to address climate change, investor and societal expectations regarding voluntary ESG initiatives and disclosures, and consumer demand for alternative sources of energy may result in increased costs (including but not limited to increased costs associated with compliance, stakeholder engagement, contracting, and insurance), reduced demand for our customers’ hydrocarbon products and our product and services, reduced profits, increased legislative and judicial scrutiny, investigations and litigation, and negative impacts on our stock price and access to capital markets. Increasing attention to climate change and environmental conservation, for example, may result in demand shifts for our customers’ hydrocarbon products and additional governmental investigations and private litigation against those customers. To the extent that societal pressures or political or other factors are involved, it is possible that liability could be imposed on our customers without regard to their causation of or contribution to the asserted damage, or to other mitigating factors. To date, however, changes in societal pressures and consumer demand related to increased attention to ESG and conservation matters have not had a material impact on our customers’ operations or otherwise materially and adversely affected our business. Voluntary disclosures regarding ESG matters, as well as any ESG disclosures mandated by law, could result in private litigation or government investigation or enforcement action regarding the sufficiency or validity of such disclosures. In addition, failure or a perception (whether or not valid) of failure to implement ESG strategies or achieve ESG goals or commitments, including any GHG reduction or neutralization goals or commitments, could result in governmental investigations or enforcement, private litigation and damage our reputation, cause our investors or consumers to lose confidence in our Company, and negatively impact our operations.


44


Table of Contents

Moreover, while we may create and publish disclosures regarding ESG matters, many of the statements in those disclosures may be on hypothetical expectations and assumptions that may or may not be representative of current or actual risks or events or forecasts of expected risks or events, including the costs associated therewith. Such expectations and assumptions are necessarily uncertain and may be prone to error or subject to misinterpretation given the long timelines involved and the lack of an established single approach to identifying and measuring many ESG matters. Such disclosures may also be partially reliant on third-party information that we have not or cannot independently verify. Additionally, we expect there will likely be increasing levels of regulation, disclosure-related and otherwise, with respect to ESG matters, and increased regulation will likely to lead to increased compliance costs as well as scrutiny that could heighten all of the risks identified in this risk factor.

In addition, organizations that provide information to investors on corporate governance and related matters have developed ratings processes for evaluating companies on their approach to ESG matters. Such ratings are used by some investors to inform their investment and voting decisions. Unfavorable ESG ratings and recent activism directed at shifting funding away from companies with energy-related assets could lead to increased negative investor sentiment toward us or our customers and to the diversion of investment to other industries, which could have a negative impact on our stock price and our or our customers’ access to and costs of capital. Also, institutional lenders may, of their own accord, decide not to provide funding for fossil fuel industry companies based on climate change, natural capital, or other ESG related concerns, which could affect our or our customers’ access to capital for potential growth projects. Moreover, to the extent ESG matters negatively impact our or the fossil fuel industry’s reputation, we may not be able to compete as effectively to recruit or retain employees, which may adversely affect our operations.

Our business may suffer if we lose or are unable to attract and retain members of our workforce.

We depend to a large extent on the services of our senior management team and other key personnel. These employees have extensive experience and expertise in evaluating and analyzing industrial mineral properties, maximizing production from such properties, marketing industrial mineral production and developing and executing financing and hedging strategies.

Competition for management and key personnel is intense, and the pool of qualified candidates is limited. The loss of any of these individuals or the failure to attract additional personnel as needed could have an adverse effect on our operations and could lead to higher labor costs or the use of less-qualified personnel. In addition, if any of our executives or other key employees were to join a competitor or form a competing company, we could lose customers, suppliers, know-how and other personnel. Our operations also rely on skilled laborers using modern techniques and equipment to mine efficiently. We may be unable to train or attract the necessary number of skilled laborers to maintain our operating costs.

With respect to our trucking services, the industry periodically experiences a shortage of qualified drivers, particularly during periods of economic expansion, in which alternative employment opportunities are more plentiful and freight demand increases, or during periods of economic downturns, in which unemployment benefits might be extended. The trucking industry suffers from a high driver turnover rate, which requires us to continually recruit a substantial number of drivers to operate our equipment and could negatively affect our operations and expenses if we are unable to do so. Our success will be dependent on our ability to continue to attract, employ and retain highly skilled personnel at all levels of our operations.


45


Table of Contents

A shortage of skilled labor together with rising labor costs in the excavation industry may further increase operating costs, which could adversely affect our business, results of operations and financial condition.

Efficient sand excavation using modern techniques and equipment requires skilled laborers, preferably with several years of experience and proficiency in multiple tasks, including processing of mined minerals. If there is a shortage of experienced labor in areas in which we operate, we may find it difficult to hire or train the necessary number of skilled laborers to perform our own operations which could have an adverse impact on our business, results of operations and financial condition.

As a result of the volatility of the oilfield services industry and the demanding nature of the work, workers may choose to pursue employment in fields that offer a more desirable work environment at wage rates that are competitive. Increased competition for their services could result in a loss of available, skilled workers or at a price that is not as advantageous to our business, both of which could negatively affect our operating results. If we are unable to retain or meet growing demand for skilled technical personnel, our operating results and our ability to execute our growth strategies may be adversely affected.

Inaccuracies in our estimates of sand reserves and resource deposits, or deficiencies in our title to those deposits, could result in our inability to mine the deposits or require us to pay higher than expected costs.

We base our sand reserve and resource estimates on engineering, economic and geological data assembled and analyzed by our mining engineers, which are reviewed periodically by outside firms. However, frac sand reserve estimates are by nature imprecise and depend to some extent on statistical inferences drawn from available drilling data, which may prove unreliable. There are numerous uncertainties inherent in estimating quantities and qualities of frac sand reserves and non-reserve frac sand deposits and costs to mine recoverable reserves, many of which are beyond our control and any of which could cause actual results to differ materially from our expectations. These uncertainties include:


geological and mining conditions that may not be fully identified by available data or that may differ from experience;


assumptions regarding the effectiveness of our mining, quality control and training programs;


assumptions concerning future prices of frac sand, operating costs, mining technology improvements, development costs and reclamation costs; and


assumptions concerning future effects of regulation, including the issuance of required permits and taxes by governmental agencies.

In addition, title to, and the area of, mineral properties and water rights may also be disputed. Mineral properties sometimes contain claims or transfer histories that examiners cannot verify. A successful claim that we do not have title to one or more of our properties or lack appropriate water rights could cause us to lose any rights to explore, develop and extract any minerals on that property, without compensation for our prior expenditures relating to such property. Any inaccuracy in our estimates related to our mineral reserves and non-reserve mineral deposits, or our title to such deposits, could result in our inability to mine the deposits or require us to pay higher than expected costs.

Further, the SEC has adopted amendments to its disclosure rules (the “SEC Modernization Rules”) to modernize the mineral property disclosure requirements for issuers whose securities are registered with the SEC under the Exchange Act, which are codified in Regulation S-K subpart 1300. Under the SEC Modernization Rules, the historical property disclosure requirements for mining registrants included in SEC Industry Guide 7 have been replaced. As a result of the adoption of the SEC Modernization Rules, the SEC now recognizes estimates of “measured mineral resources,” “indicated mineral


46


Table of Contents

resources” and “inferred mineral resources.” However, compared to mineralization that has been characterized as reserves, mineralization described using these terms has a greater amount of uncertainty as to their existence and whether they can be mined legally or economically, and investors are therefore cautioned not to assume that any reported “measured mineral resources,” “indicated mineral resources” or “inferred mineral resources” are or will be economically or legally mineable.

All of our product sales are currently generated at two facilities. Any adverse developments at those facilities could have an adverse effect on our business, financial condition and results of operations.

All of our product sales are currently derived from our Kermit and Monahans facilities located in Winkler and Ward Counties in Texas. Any adverse development at these facilities due to catastrophic events or weather, adverse government regulatory impacts, transportation-related constraints or any other event that could cause us to curtail, suspend or terminate operations at either of these facilities, could result in us being unable to deliver our contracted volumes and related obligations. Although we maintain insurance coverage to cover a portion of these types of risks, there could be potential risks associated with our operations not covered by insurance. There also may be certain risks covered by insurance where the policy does not reimburse us for all of the costs related to such risks. Downtime or other delays or interruptions to our future operations that are not covered by insurance could have an adverse effect on our business, results of operations and financial condition. In addition, under our supply contracts, if we are unable to deliver contracted volumes, we may be required to pay liquidated damages that could have an adverse effect on our financial condition and results of operations.

Our operations consume large amounts of natural gas and electricity. An increase in the price or a significant interruption in the supply of these or any other energy sources could have an adverse effect on our business, financial condition and results of operations.

Natural gas and electricity costs represented approximately 3.4% and 0.7%, respectively, of our total product sales in the year ended December 31, 2022, and 5.9% and 1.9%, respectively, of our total product sales in the year ended December 31, 2021. Potential climate change regulations or carbon or emissions taxes could result in higher cost of production for energy, which may be passed on to us in whole or in part. A significant increase in the price of energy that is not recovered through an increase in the price of our product and services or covered through our hedging arrangements or an extended interruption in the supply of electricity or natural gas to our production facilities could have an adverse effect on our business, results of operations and financial condition.

A large portion of our sales is generated by our top 10 customers, and the loss of or a significant reduction in purchases by our largest customers could adversely affect our business, financial condition and results of operations.

Our 10 largest customers accounted for approximately 67.7% of total sales for the year ended December 31, 2022. During the years ended December 31, 2021 and 2020, our 10 largest customers accounted for 79.0% and 81.4% of total sales, respectively. Some of our customers have exited or could exit the business, or have been or could be acquired by other companies that purchase proppant solutions or logistics services we provide from other third-party providers. Our current customers also may seek to acquire proppant or logistics services from other providers that offer more competitive pricing or capture and develop their own sources of proppant solutions or logistics services. The loss of a customer or contract, or a reduction in the amount of proppant solutions or logistics services purchased by any customer, could have an adverse effect on our business, financial condition and results of operations. Further, as a result of market conditions, competition or other factors, these customers may not continue to purchase the same levels of our products in the future, if at all. Substantial reductions in purchase volumes across these customers could have an adverse effect on our business, financial condition and results of operations.


47


Table of Contents

Upon the expiration of our current contracts, our customers may not continue to purchase the same levels of proppant solutions or logistics services due to a variety of reasons. In addition, we may choose to renegotiate our existing contracts on less favorable terms or at reduced volumes in order to preserve relationships with our customers. Any renegotiation of our contracts on less favorable terms, or inability to enter into new contracts on economically acceptable terms upon the expiration of our current contracts, could have an adverse effect on our business, financial condition and results of operations.

Our business and operations depend on our and our customers’ ability to obtain and maintain necessary permits.

We and our customers hold numerous governmental, environmental, mining and other permits and approvals authorizing operations at each of our facilities. Our future success depends on, among other things, our ability, and the ability of our customers, to obtain and maintain the necessary permits and licenses required to conduct operations. In order to obtain permits and renewals of permits in the future, we may be required to prepare and present data to governmental authorities pertaining to the impact that our activities may have on the environment. Compliance with these regulatory requirements is expensive and significantly lengthens the time needed to conduct operations. Additionally, obtaining or renewing required permits is sometimes delayed, conditioned or prevented due to community opposition, opposition from other parties, the location of existing or proposed third-party operations, or other factors beyond our control. The denial of a new or renewed permit essential to our operations, delays in obtaining such a permit or the imposition of conditions in order to acquire the permit could impair our ability to continue operations at the affected facilities, delay those operations, or involve significant unplanned costs, any of which could adversely affect our business, performance and financial condition.

Our supply agreements may preclude us from taking advantage of increasing prices for proppant or mitigating the effect of increased operational costs during the term of those contracts.

The supply agreements we have may negatively impact our results of operations. Our sales contracts require our customers to pay a specified price for a specified volume of proppant. Although some of our supply agreements provide for price adjustments based on various factors, such adjustments are generally calculated on a quarterly basis and do not adjust dollar-for-dollar with adjustments in spot market prices. As a result, in periods with increasing prices our sales will not keep pace with market prices.

Additionally, if our operational costs increase during the terms of our supply agreements, we will not be able to pass some of those increased costs to our customers. If we are unable to otherwise mitigate these increased operational costs, our net income could decline.

A proppant production facility closure entails substantial costs, and if we close any of our facilities sooner than anticipated, our results of operations may be adversely affected.

We base our assumptions regarding the life of our proppant production facilities on detailed studies that we perform from time to time, but our studies and assumptions do not always prove to be accurate. If we close any of our proppant production facilities sooner than expected, sales will decline unless we are able to increase production at any of our other proppant production facilities, which may not be possible. The closure of a proppant production facility may also involve significant fixed closure costs, including accelerated employment legacy costs, severance-related obligations, and potentially reclamation and other environmental costs and the costs of terminating long-term obligations, including energy contracts and equipment leases. We accrue for the estimated costs to retire the assets over the expected timing of settlement. If we were to reduce the estimated time to settlement, the fixed proppant production facilities closure costs could be applied to a shorter period of production, which would increase production costs per ton produced and could adversely affect our results of operations and financial condition.


48


Table of Contents

In addition, some environmental laws such as the Comprehensive Environmental Response, Compensation and Liability Act (“CERCLA”), impose strict, retroactive and joint and several liability for the remediation of releases of hazardous substances.

Certain of our contracts contain provisions requiring us to deliver minimum amounts of sand-based proppant. If we are unable to meet our minimum requirements under these contracts, we may be required to pay penalties or the contract counterparty may be able to terminate the agreement.

In certain instances, we commit to deliver products under penalty of nonperformance. We commit to deliver products to our customers prior to production, and we are obligated to deliver a minimum volume of sand-based proppant per year or per month under our supply agreements over their respective terms. Depending on the contract, our inability to deliver the requisite volume of sand-based proppant may permit our customers to terminate the agreement or require us to pay our customers a fee, the amount of which is generally calculated by multiplying the difference between the amount of volume contracted for and the amount delivered by a per-ton penalty specified in the contract. In such events, our results of operations may be adversely affected.

Currently, all of our operations are concentrated in the Permian Basin, making us vulnerable to risks associated with operating in a limited geographic area.

Currently, all of our operations are geographically concentrated in the Permian Basin. As a result, we may be disproportionately exposed to various factors, including, among others: (i) the impact of regional supply and demand factors, (ii) delays or interruptions of completion activity in such areas caused by governmental regulation, (iii) processing or transportation capacity constraints, (iv) market limitations, (v) availability of equipment and personnel or (vi) water shortages or other drought related conditions. This concentration in a limited geographic area also increases our exposure to changes in local laws and regulations, certain lease stipulations designed to protect wildlife and unexpected events that may occur in the regions such as natural disasters, seismic events, industrial accidents or labor difficulties. Any of the risks described above could have an adverse effect on our business, financial condition, results of operations and cash flow.

An increase in the supply of proppant having similar characteristics as the proppant we produce could make it more difficult for us to renew or replace our existing contracts on favorable terms, or at all.

If significant new reserves of proppant are discovered and developed and have similar characteristics to the proppant we produce, we may be unable to renew or replace our existing contracts on favorable terms, if at all. Specifically, if proppant is oversupplied, our customers may not be willing to enter into long-term take-or-pay contracts, may demand lower prices or both, which would have an adverse effect on our business, results of operations and financial condition. Similarly, the ongoing COVID-19 pandemic has caused a historic slowdown in oil and natural gas activity, which has led to an increase in available proppant supply relative to the reduced demand. The foregoing events have led to increased competition among our competitors, which could lead to pressure to further reduce prices to compete effectively.

Our results of operations are significantly affected by the market price of sand-based proppant, which have been historically subject to substantial price fluctuations.

Our results of operations and financial conditions are, and will continue to be, particularly sensitive to the long- and short-term changes in the market price of sand-based proppant. Among other factors, these prices also affect the value of our reserves and inventories, and could negatively impact the market price of our Class A common stock.


49


Table of Contents

Market prices are affected by numerous factors beyond our control, including, among others, demand for high quality sand-based proppant, the availability and relative cost of alternate sources of sand, drilling and completion activity in the Permian Basin, prevailing commodity prices and overall economic activity.

Additionally, when demand for sand-based proppant increases, there may not be a corresponding or immediate increase in the prices for our products or our customers may choose to opt for lower-quality, lower priced products, which could have an adverse effect on our results of operations and financial condition. For example, the average price of frac sand F.O.B. minegate in the Permian Basin in 2019 was approximately $17.86 per ton, compared to a low of approximately $13.25 per ton in 2020 during the COVID-19 pandemic. As activity recovered during 2021, the average price of frac sand F.O.B. minegate increased to approximately $18.59 per ton, recovering only a portion of the previous price decrease. In addition, any future decreases in the rate at which oil and natural gas reserves are discovered or developed, whether due to increased governmental regulation, limitations on exploration and drilling activity, including hydraulic fracturing or other factors, could have an adverse effect on our business and financial condition, even in a stronger oil and natural gas price environment.

Our E&P customers’ operations are subject to operating risks that are often beyond our control and could have an adverse effect on our business, financial condition and results of operations.

In addition to the sand-based proppant that we supply, the operations of our E&P customers rely on several other products and services in order to perform hydraulic fracturing activities, such as skilled laborers and equipment required for pumping proppant, water and fluids into oil and natural gas wells. Any failure by our E&P customers to obtain these other products and services could have an adverse effect on our business, financial condition and results of operations.

Our business and operations could suffer in the event of cybersecurity breaches, information technology system failures, network disruptions or other cyber security risks. A cyber incident could occur and result in information theft, data corruption, operational disruption and/or financial loss.

We rely on our information technology systems and other digital information to process transactions, summarize our operating results, deliver our systems, perform many of our services and manage our business and operations. In the ordinary course of our business, we collect and store sensitive data, including our proprietary business information and personally identifiable information of our employees. Our information technology systems and networks, and those of our customers, vendors, suppliers and other business partners, are subject to damage or interruption from power outages; computer and telecommunications failures; computer viruses; cyberattack or other security breaches; catastrophic events, such as fires, floods, earthquakes, tornadoes, hurricanes, acts of war or terrorism; and usage errors by our employees. If our information technology systems are damaged or cease to function properly, we may need to make a significant investment to fix or replace them, and we may suffer loss of critical data and interruptions or delays in our operations.

We have been the target of cyberattacks, and while to date none of these incidents has had a material impact on us, we expect to continue to be targeted in the future. Our risk and exposure to these matters remains heightened because of, among other things, the evolving nature of these threats, the current global economic and political environment, the outsourcing of some of our business operations, the ongoing shortage of qualified cybersecurity professionals and the interconnectivity and interdependence of third parties to our systems.

As cyber incidents continue to evolve, we will likely be required to expend additional resources to continue to modify or enhance our protective measures or to investigate and remediate any vulnerability to cyber incidents. In addition, any technology required for any mandate by authorities


50


Table of Contents

requiring the transition to remote work increases our vulnerability to cybersecurity threats, including threats to gain unauthorized access to sensitive information or to render data or systems. Any material disruption in our information technology systems or systems that affect our business operations, delays or difficulties in implementing or integrating new systems or enhancing current systems, or any vulnerabilities rendering data or systems unusable following any mandated remote work situations, could have an adverse effect on our business and results of operations.

The systems we employ to detect and prevent cyberattacks may be insufficient to protect us from an incident or to allow us to minimize the magnitude and effects of such incident for a significant period of time. The occurrence of a cyberattack, breach, unauthorized access, misuse, computer virus or other cybersecurity event could jeopardize our systems, interrupt our operations or result in the unauthorized disclosure, gathering, monitoring, misuse, corruption, loss or destruction of confidential and other information that belongs to us, our customers, our counterparties or third-party service providers that is processed and stored in, and transmitted through, our computer systems and networks. Any such event could result in significant losses, loss of customers and business opportunities, reputational damage, litigation, regulatory fines, penalties or intervention, reimbursement or other compensatory costs, or otherwise adversely affect our business, financial condition or results of operations.

Our business and results of operations have been adversely affected by, and may again in the future be adversely affected by, the ongoing COVID-19 pandemic.

Public health crises, pandemics and epidemics, such as the ongoing COVID-19 pandemic, have adversely impacted, and may again adversely impact our operations, the operations of our customers and the global economy, including the worldwide demand for oil and natural gas and the level of demand for our product and services. Fear of such events has also altered the level of capital spending by oil and natural gas companies for exploration and production activities and has adversely affected global economies and financial markets, resulting in an economic downturn that has affected demand for our product and services. For instance, the outbreak of COVID-19 and its development into a pandemic has caused governmental authorities to impose mandatory closures, seek voluntary closures and impose restrictions on, or advisories with respect to, travel, business operations and public gatherings or interactions. Though we are currently deemed an essential business and, as a result, are exempt from many orders in their current form, the impact of the ongoing COVID-19 pandemic, and measures to prevent its spread, have adversely affected our businesses in a number of ways.

The COVID-19 pandemic (including the spread of variants of mutant strains) may significantly worsen during the upcoming months, which may cause governmental authorities to consider further restrictions on business and social activities. In the event governmental authorities increase restrictions, the re-opening of the economy may be further curtailed. We have experienced, and expect to continue to experience, some resulting disruptions to our business operations, as these restrictions have significantly impacted, and may continue to impact, many sectors of the economy. For example, the COVID-19 pandemic has caused one of the most challenging times in the recent history of the North-American E&P industry. The rig count in the Permian Basin decreased from a peak of 488 in 2019 to a trough of 117 in 2020, however our revenues and net cash provided by operating activities only contracted from $140.1 million and $22.7 million, respectively, for the year ended December 31, 2019, to $111.8 million and $12.5 million, respectively, for the year ended December 31, 2020, before recovering to $172.4 million and $21.4 million, respectively, for the year ended December 31, 2021. Our revenues and net cash provided by operating activities increased by $310.3 million and $184.6 million, respectively, from the year ended December 31, 2021, to $482.7 million and $206.0 million, respectively, for the year ended December 31, 2022.

The global impact of the ongoing COVID-19 pandemic continues to evolve, and we will continue to monitor the situation closely. The ultimate impact of the pandemic (including the spread of variants of mutant strains) on our business, financial condition and results of operations is highly uncertain and


51


Table of Contents

subject to change, and will depend on future developments, including the duration of the outbreak within the United States and the related impact on the oil and natural gas industry, the impact of governmental actions designed to prevent the spread of COVID-19 and the availability of effective treatments and vaccines, all of which cannot be predicted with certainty at this time. While vaccines have become available in most countries and many economies have reopened, the status of the global recovery remains uncertain and unpredictable, especially in light of new variant strains. Business activity may not recover as quickly as anticipated, and widespread recovery will be impacted by future developments, including future waves of outbreak or new variant strains of the virus which may require re-closures or other preventative measures. Conditions will be subject to the effectiveness of government policies, vaccine administration rates, and other factors that may not be foreseeable. Any of the foregoing could adversely affect our business, results of operations and financial condition.

There are complex software and technology systems that need to be developed in coordination with our technology partner in connection with our autonomous trucking initiative, and there can be no assurance such systems will be successfully developed or implemented for use in our planned applications or at all.

Our planned autonomous proppant-delivery vehicles will use a substantial amount of third-party software codes and complex hardware to operate. The development of these advanced technologies is inherently complex, and we will need to coordinate with our technology partner in connection with the design, production and deployment of our autonomous proppant-delivery vehicles. Defects and errors may be revealed over time and our control over the performance of such third-party services and systems may be limited. Accordingly, our potential inability to successfully develop and implement the necessary software and technology systems may harm our competitive position.

We are relying on our technology partner to develop, manufacture and install a number of emerging technologies for use in our autonomous proppant-delivery vehicles. These technologies may not be commercially viable when used in our planned applications or at all. There can be no assurances that our technology partner will be able to meet the technological requirements, production timing and end-use specifications required to successfully implement our planned autonomous trucking initiative. In addition, the initial deliveries of our autonomous vehicles may not occur by the date or at the cost currently estimated. If any material delays or cost increases were to occur, we may also be unable to meet certain proppant-delivery obligations to our customers or incur additional costs in making such deliveries by traditional trucking methods or other alternative means, which could have an adverse effect on our business, financial condition and results of operations.

Our autonomous driving technology and related hardware and software could have undetected defects, errors or bugs in hardware or software, which could create safety or cybersecurity issues and could expose us to liability and other claims that could adversely affect our business.

Autonomous driving technology is highly technical and very complex, and has in the past and may in the future experience defects, errors or bugs at various stages of implementation. In the event of such defect, error or bug, we may incur significant additional development costs, repair or replacement costs, or more importantly, liability for personal injury or property damage caused by such errors or defects. Any insurance that we carry may not be sufficient or it may not apply to all situations that may arise in connection with the planned applications of our autonomous delivery vehicles. In accidents involving semi-trucks, most of the resulting fatalities are victims outside of the vehicle. If we experience such an event or multiple events, our insurance premiums could significantly increase or insurance may not be available to us at all. In addition, lawmakers or governmental agencies could pass laws or adopt regulations that limit the use of autonomous-trucking technology or increase liability associated with its use. Any of these events could adversely affect our reputation, relationships with our customers, financial condition and results of operations.


52


Table of Contents

In addition, we could face material legal claims as a result of these problems. Any such lawsuit may cause irreparable damage to our brand and reputation. In addition, defending a lawsuit, regardless of its merit, could be costly and may divert management’s attention and adversely affect the market’s perception of us and our products and services. In addition, our business liability insurance coverage could prove inadequate with respect to a claim and future coverage may be unavailable to us on acceptable terms or at all. These product-related issues could result in claims against us and have an adverse effect on our business, financial condition and results of operations.

Any unauthorized control or manipulation of the information technology systems in our autonomous proppant-delivery vehicles could result in loss of customer confidence in us and the products and services we provide.

Our autonomous proppant-delivery vehicles will contain complex information technology systems and built-in data connectivity to log location data and accept and install periodic remote updates to improve or update their functionality or performance. Our technology partner expects to design, implement and test security measures intended to prevent unauthorized access to its and our information technology networks, the autonomous vehicle platforms it produces and related or connected systems. However, hackers may attempt to gain unauthorized access to modify, alter and use such networks, vehicles and systems to gain control of or to change our autonomous vehicles’ functionality, user interface and performance characteristics, or to gain access to data stored in or generated by our autonomous vehicles. Future vulnerabilities could be identified and manipulated and our or our technology partner’s efforts to remediate such vulnerabilities may not be successful. Any unauthorized access to or control of our autonomous proppant-delivery vehicles, or any loss of data, could result in legal claims or proceedings against us and remediation of such problems could result in significant, unplanned capital expenditures. In addition, regardless of their veracity, reports of unauthorized access to our autonomous proppant-delivery vehicles or our or our customers’ data, as well as other factors that may result in the perception that our autonomous proppant-deliver vehicles or data are capable of being “hacked,” could negatively affect our brand and harm our business, financial condition and results of operations.

Risks Related to Our Financial Condition

We may be unable to generate sufficient cash to service all of our indebtedness and financial commitments.

Our ability to make scheduled payments on or to refinance our indebtedness and financial commitments depends on our financial condition and operating performance, which are subject to prevailing economic and competitive conditions including financial, business and other factors beyond our control. We may be unable to generate sufficient cash flow to permit us to pay the principal, premium, if any, and interest on our indebtedness.

If our cash flows and capital resources are insufficient to fund debt and other obligations, we may be forced to reduce or delay capital expenditures, sell assets, seek additional capital or restructure our indebtedness. Our ability to restructure or refinance indebtedness will depend on the condition of the capital markets and our financial condition at such time. Any refinancing of indebtedness could be at higher interest rates and may require us to comply with more onerous covenants, which could further restrict our operations. The terms of existing or future debt instruments may restrict us from adopting some of these alternatives. In addition, any failure to service our debt would likely result in a reduction of our future credit rating, if any, which could harm our ability to incur additional indebtedness. If we face substantial liquidity problems, we might be required to sell assets to meet debt and other obligations. Our debt restricts our ability to dispose of assets and dictates our use of the proceeds from such disposition. We may not be able to consummate dispositions, and the proceeds of any such disposition may be inadequate to meet our obligations.


53


Table of Contents

We may be unable to access adequate funding as a result of a decrease in the borrowing base under the 2023 ABL Credit Facility due to an unwillingness or inability on the part of lending counterparties to meet their funding obligations and the inability of other lenders to provide additional funding to cover a defaulting lender’s portion. As a result, we may be unable to execute our development plan, make acquisitions or otherwise conduct operations, which would have an adverse effect on our financial condition and results of operations.

Our indebtedness could adversely affect our financial flexibility and our competitive position.

On October 20, 2021, we entered into the 2021 Term Loan Credit Facility. As of December 31, 2022, $149.0 million of the principal amount of the term loan was outstanding under the 2021 Term Loan Credit Facility. The proceeds of the 2021 Term Loan Credit Facility were used, among other uses, to repay all outstanding indebtedness under the 2018 Term Loan Credit Facility. The term loan outstanding under the 2021 Term Loan Credit Facility (the “Term Loan”) bears interest at a rate of 8.47% per annum.

Atlas Operating and its subsidiaries have, and we expect to maintain in the near term, a significant amount of indebtedness. Under our 2023 ABL Credit Facility, the lenders thereunder (the “ABL Lenders”) provide revolving credit financing to Atlas LLC in an aggregate principal amount of up to $75.0 million with availability thereunder subject to a borrowing base as described in the loan agreement governing the 2023 ABL Credit Facility (the “ABL Credit Agreement”). As of December 31, 2022, we had no loans outstanding under our previous asset-based loan credit facility (the “2018 ABL Credit Facility”) and we were using $1.1 million for outstanding letters of credit, leaving $48.9 million of borrowing availability under our 2018 ABL Credit Facility prior to its repayment in full in February 2023.

Our debt agreements contain a number of significant covenants that may limit our ability to, among other things:


incur additional indebtedness;


sell or convey assets;


make loans to or investments in others;


enter into mergers;


make certain payments;


hedge future production or interest rates;


incur liens;


pay dividends; and


engage in certain other transactions without the prior consent of the lenders.

Our indebtedness could also have important consequences to you and significant effects on our business, including:


increasing our vulnerability to adverse changes in general economic, industry and competitive conditions;


requiring us to dedicate a substantial portion of our cash flow from operations to make payments on our indebtedness, thereby reducing the availability of our cash flow to fund working capital, capital expenditures and other general corporate purposes, including dividend payments;


restricting us from exploiting business opportunities;


making it more difficult to satisfy our financial obligations, including payments on our indebtedness;


54


Table of Contents
   

disadvantaging us when compared to our competitors that have less debt; and


increasing our borrowing costs or otherwise limiting our ability to borrow additional funds for the execution of our business strategy.

Changes to applicable tax laws and regulations, exposure to additional income tax liabilities, changes in our effective tax rates or an assessment of taxes resulting from an examination of our income or other tax returns could adversely affect our results of operations and financial condition, including our ability to repay our debt.

We are subject to various complex and evolving U.S. federal, state and local taxes. U.S. federal, state and local tax laws, policies, statutes, rules, regulations or ordinances could be interpreted, changed, modified or applied adversely to us, in each case, possibly with retroactive effect, and may have an adverse effect on our results of operations and financial condition, including our ability to repay our debt. For example, several tax proposals have been set forth that would, if enacted into law, make significant changes to U.S. tax laws. Such proposals include, but are not limited to, (i) an increase in the U.S. income tax rates applicable to individuals and corporations, (ii) the elimination of tax subsidies for fossil fuels, (iii) the imposition of a minimum tax on book income for certain corporations and (iv) the imposition of an excise tax on certain corporate stock repurchases that would be borne by the corporation repurchasing such stock. Congress may consider, and could include, some or all of these proposals in connection with tax reform that may be undertaken. It is unclear whether these or similar changes will be enacted and, if enacted, how soon any such changes could take effect. The passage of any legislation as a result of these proposals and other similar changes in U.S. federal income tax laws could adversely affect our results of operations and financial condition.

Changes in our effective tax rates or tax liabilities could also adversely affect our results of operations and financial condition. Our future effective tax rates could be subject to volatility or adversely affected by a number of factors, including:


changes in the valuation of our deferred tax assets and liabilities;


expected timing and amount of the release of any tax valuation allowances;


expansion into future activities in new jurisdictions;


the availability of tax deductions, credits, exemptions, refunds and other benefits to reduce tax liabilities; and


tax effects of share-based compensation.

In addition, an adverse outcome arising from an examination of our income or other tax returns could result in higher tax exposure, penalties, interest or other liabilities that could have an adverse effect on our results of operations and financial condition.

We will need substantial additional capital to operate our business, and the inability to obtain needed capital or financing, on satisfactory terms, or at all, whether due to restrictions in our 2023 ABL Credit Facility, 2021 Term Loan Credit Facility or otherwise, could have an adverse effect on our growth and profitability.

Our business plan requires a significant amount of capital expenditures to maintain and grow our production levels over the long term. Although we currently use a significant amount of our cash reserves and cash generated from our operations to fund the maintenance and development of our existing sand reserves, we may need to depend on external sources of capital to fund future capital expenditures if proppant prices were to decline for an extended period of time, if the costs of our operations were to increase substantially or if other events were to occur that reduce our sales or


55


Table of Contents

increase our costs. Our ability to obtain bank financing or to access the capital markets for future equity or debt offerings may be limited by our financial condition at the time of any such financing or offering, adverse market conditions or other contingencies and uncertainties that are beyond our control. Our failure to obtain the funds necessary to maintain, develop and increase our asset base could adversely impact our growth and profitability.

In addition, our existing 2023 ABL Credit Facility and 2021 Term Loan Credit Facility contain, and any future financing agreements we may enter into could also contain, operating and financial restrictions and covenants that may limit our ability to finance future operations or capital needs or to engage in, expand or pursue our business activities.

Our ability to comply with these restrictions and covenants is uncertain and will be affected by the levels of cash flow from our operations and events and circumstances beyond our control, including the ongoing COVID-19 pandemic (including the spread of variants of mutant strains). If market or other economic conditions deteriorate, our ability to comply with these covenants may be impaired. If we violate any of the restrictions or covenants in our 2023 ABL Credit Facility and 2021 Term Loan Credit Facility, a significant portion of our indebtedness may become immediately due and payable and our lenders’ commitment to make further loans to us may terminate. We might not have, or be able to obtain, sufficient funds to make these accelerated payments. In addition, our obligations under our 2021 Term Loan Credit Facility are secured by substantially all of our assets, and if we are unable to repay our indebtedness or satisfy our other obligations under these, the lenders could seek to foreclose on our assets.

Even if we are able to maintain existing financing or access the capital markets, incurring additional debt may significantly increase our interest expense and financial leverage, and our indebtedness could restrict our ability to fund future development and acquisition activities. In addition, the issuance of any additional equity interests may result in significant dilution to our common stockholders.

We are subject to counterparty credit risk. Nonpayment or nonperformance by our customers, suppliers or vendors could have an adverse effect on our business, liquidity, financial condition and results of operations.

We are subject to the risk of loss resulting from nonpayment or nonperformance by our customers, suppliers and vendors. Our credit procedures and policies may not be adequate to fully eliminate customer credit risk. If we fail to adequately assess the creditworthiness of existing or future customers or unanticipated deterioration in their creditworthiness, any resulting increase in nonpayment or nonperformance by them and our inability to re-market or otherwise use the production could have an adverse effect on our business, results of operations and financial condition. A decline in oil and natural gas prices could negatively impact the financial condition of our customers and sustained lower prices could impact their ability to meet their financial obligations to us. Further, our contract counterparties may not perform or adhere to our existing or future contractual arrangements. To the extent one or more of our contract counterparties is in financial distress or commences bankruptcy proceedings, contracts with these counterparties may be subject to renegotiation or rejection under applicable provisions of the United States Bankruptcy Code. Any material nonpayment or nonperformance by our contract counterparties due to inability or unwillingness to perform or adhere to contractual arrangements could adversely affect our business and results of operations. If our customers delay or fail to pay us a significant amount of our outstanding receivables, it could have an adverse effect on our business, liquidity financial condition and results of operations.


56


Table of Contents

If we fail to comply with the restrictions and covenants in our debt agreements, there could be an event of default under the terms of such agreements, which could result in an acceleration of payment.

A breach of any representation, warranty or covenant in any of our debt agreements would result in a default under the applicable agreement after any applicable grace periods. A default could result in acceleration of the indebtedness which would have an adverse effect on us. If an acceleration occurs, it would likely accelerate all of our indebtedness through cross-default provisions and we would likely be unable to make all of the required payments to refinance such indebtedness. Even if new financing were available at that time, it may not be on terms that are acceptable to us.

Any future indebtedness could adversely affect our financial condition.

We will, subject to the terms and conditions in the ABL Credit Agreement and availability under the borrowing base described therein, be able to borrow up to $75.0 million under our 2023 ABL Credit Facility and anticipate that up to $                under the 2021 Term Loan Credit Facility will remain outstanding after giving effect to the use of the net proceeds of this offering.

In addition, subject to the limits contained in our 2023 ABL Credit Facility and 2021 Term Loan Credit Facility, we may incur substantial additional debt from time to time. Any borrowings we may incur in the future would have several important consequences for our future operations, including that:


covenants contained in the documents governing such indebtedness may require us to meet or maintain certain financial tests, which may affect our flexibility in planning for, and reacting to, changes in our industry, such as being able to take advantage of acquisition opportunities when they arise;


our ability to obtain additional financing for working capital, capital expenditures, acquisitions, general corporate and other purposes may be limited;


we may be competitively disadvantaged to our competitors that are less leveraged or have greater access to capital resources; and


we may be more vulnerable to adverse economic and industry conditions.

If we incur indebtedness in the future, we may have significant principal payments due at specified future dates under the documents governing such indebtedness. Our ability to meet such principal obligations will be dependent upon future performance, which in turn will be subject to general economic conditions, industry cycles and financial, business and other factors affecting our operations, many of which are beyond our control. Our business may not continue to generate sufficient cash flow from operations to repay any incurred indebtedness. If we are unable to generate sufficient cash flow from operations, we may be required to sell assets, to refinance all or a portion of such indebtedness or to obtain additional financing.

Risks Related to Environmental, Mining and Other Regulations

Silica-related health issues and legislation, including compliance with existing or future regulations relating to respirable crystalline silica, or litigation could have an adverse effect on our business, reputation or results of operations.

We are subject to laws and regulations relating to human exposure to crystalline silica. For example, the federal Occupational Safety and Health Act (“OSHA”) has implemented rules establishing a more stringent permissible exposure limit for exposure to respirable crystalline silica and provided other provisions to protect employees. These rules require compliance with engineering control obligations to


57


Table of Contents

limit exposures to respirable crystalline silica in connection with hydraulic fracturing activities. In June 2022, the DOL’s Mine Safety and Health Administration (“MSHA”) launched a new enforcement initiative to better protect U.S. miners from health hazards resulting from repeated overexposure to respirable crystalline silica. MSHA reports that silica dust affects thousands of miners each year and, without adequate protection, miners face risks of serious illnesses, many of which can be fatal.

As part of the program, MSHA will conduct silica dust-related mine inspections and expand silica sampling at mines, while providing mine operators with compliance assistance and best practices to limit miners’ exposure to silica dust.

Specifically, the silica enforcement initiative will include:


Spot inspections at mines with a history of repeated silica overexposures to closely monitor and evaluate health and safety conditions.


Increased oversight and enforcement of known silica hazards at mines with previous citations for exposing miners to silica dust levels over the existing permissible exposure limit of 100 micrograms. For mines where the operator has not timely abated hazards, MSHA will issue a withdrawal order until the silica overexposure hazard has been abated.


Expanded silica sampling at mines to ensure inspectors’ samples represent the mines, commodities, and occupations known to have the highest risk for overexposure.


A focus on sampling during periods of the mining process that present the highest risk of silica exposure for miners.


Reminding miners about their rights to report hazardous health conditions, including any attempt to tamper with the sampling process.

In addition, the DOL’s Educational Field and Small Mine Services staff will provide compliance assistance and outreach to mine operators, unions and other mining community organizations to promote and advance protections for miners. The MSHA initiative is intended to take immediate action to reduce the risks of silica dust exposure as the DOL’s development of a mining industry standard continues.

If we are unable to satisfy these obligations, or are not able to do so in a manner that is cost effective or attractive to our customers, our business operations may be adversely affected or availability or demand for our products could be significantly affected. Federal and state regulatory authorities, including OSHA and MSHA, and analogous state agencies may continue to propose changes in their regulations regarding workplace exposure to crystalline silica, such as permissible exposure limits and required controls and personal protective equipment, and we can provide no assurance that we will be able to comply with any future laws and regulations relating to exposure to crystalline silica that are adopted, or that costs of complying with such future laws and regulations would not have an adverse effect on our operating results by requiring us to modify or cease our operations.

In addition, the inhalation of respirable crystalline silica is associated with health risks, including the lung disease silicosis. There is evidence of an association between crystalline silica exposure or silicosis and lung cancer and possible association with other diseases, including immune system disorders such as scleroderma. These health risks have been, and may continue to be, a significant issue confronting the hydraulic fracturing industry. Concerns over silicosis and other potential adverse health effects, as well as concerns regarding potential liability from the use of hydraulic fracture sand, may have the effect of discouraging our customers’ use of hydraulic fracture sand. The actual or perceived health risks of handling hydraulic fracture sand could adversely affect hydraulic fracturing service providers, including us, through reduced use of hydraulic fracture sand, the threat of product liability or employee lawsuits naming us as a defendant, increased scrutiny by federal, state and local regulatory authorities of us and our customers or reduced financing sources available to the hydraulic fracturing industry.


58


Table of Contents

Over the past few decades, a number of companies that utilize silica in their operations have been named as a defendant, usually among many defendants, in numerous product liability lawsuits brought by or on behalf of current or former employees or customers alleging damages caused by silica exposure. The silica-related litigation brought against us to date and associated litigation costs, settlements and verdicts have not resulted in a material liability to us, and we presently maintain insurance policies where available. However, we may continue to have silica exposure claims filed against us in the future, including claims that allege silica exposure for periods or in areas not covered by insurance, and the costs, outcome and impact to us of any pending or future claims is not certain. Any such pending or future claims or inadequacies of our insurance coverage could have a material adverse effect on our business, reputation, financial condition, and results of operations.

Federal, state and local legislative and regulatory initiatives relating to hydraulic fracturing and the potential for related litigation could result in increased costs, additional operating restrictions or delays for our customers, which could cause a decline in the demand for our proppant and negatively impact our business, results of operations and financial condition.

We supply proppant to hydraulic fracturing operators in the oil and natural gas industry. Hydraulic fracturing is an important practice that is used to stimulate production of oil and natural gas from low permeability hydrocarbon bearing subsurface rock formations. The hydraulic fracturing process involves the injection of water, proppant, and chemicals under pressure into the formation to fracture the surrounding rock, increase permeability and stimulate production.

Although we do not directly engage in hydraulic fracturing activities, our customers purchase our proppant for use in their hydraulic fracturing activities. Hydraulic fracturing is typically regulated by state oil and natural gas commissions and similar agencies. Some states have adopted, and other states are considering adopting, regulations that could impose new or more stringent permitting, disclosure or well construction requirements on hydraulic fracturing operations. Aside from state laws, local land use restrictions may restrict drilling in general or hydraulic fracturing in particular. Municipalities may adopt local ordinances attempting to prohibit hydraulic fracturing altogether or, at a minimum, allow such fracturing processes within their jurisdictions to proceed but regulating the time, place and manner of those processes. In addition, federal agencies have started to assert regulatory authority over the process and various studies have been conducted or are currently underway by the Environmental Protection Agency (“EPA”), and other federal agencies concerning the potential environmental impacts of hydraulic fracturing activities. At the same time, certain environmental groups have suggested that additional laws may be needed and, in some instances, have pursued voter ballot initiatives to more closely and uniformly limit or otherwise regulate the hydraulic fracturing process, and legislation has been proposed by some members of Congress to provide for such regulation.

The adoption of new laws or regulations at the federal, state or local levels imposing reporting obligations on, or otherwise limiting, delaying, restricting, or prohibiting the hydraulic fracturing process could make it more difficult to complete oil and natural gas wells, increase our customers’ costs of compliance and doing business, and otherwise adversely affect the hydraulic fracturing services they perform, which could negatively impact demand for our proppant. In addition, heightened political, regulatory, and public scrutiny of hydraulic fracturing practices could expose us or our customers to increased legal and regulatory proceedings, which could be time-consuming, costly, or result in substantial legal liability or significant reputational harm. We could be directly affected by adverse litigation involving us, or indirectly affected if the cost of compliance limits the ability of our customers to operate. Such costs and scrutiny could directly or indirectly, through reduced demand for our proppant, have an adverse effect on our business, financial condition and results of operations.


59


Table of Contents

We and our customers are subject to extensive environmental and occupational health and safety regulations that impose, and will continue to impose, significant costs and liabilities. In addition, future regulations, or more stringent enforcement of existing regulations, could increase those costs and liabilities, which could adversely affect our results of operations.

We are subject to a variety of federal, state and local environmental laws and regulations affecting the mining and mineral processing industry, including, among others, those relating to employee health and safety, environmental permitting and licensing, plant and wildlife protection, wetlands protection, air and water emissions, greenhouse gas emissions, water pollution, waste management, including the transportation and disposal of waste and other materials, remediation of soil and groundwater contamination, land use, reclamation and restoration of properties, hazardous materials and natural resources. These laws and regulations have imposed, and will continue to impose, numerous obligations on our operations and the operations of our customers, including the acquisition of permits or other approvals to conduct regulated activities, the imposition of restrictions on the types, quantities and concentrations of various substances that may be released into the environment or injected in non-productive formations below ground in connection with oil and natural gas drilling and production activities, the incurrence of capital expenditures to mitigate or prevent releases of materials from our equipment, facilities or from customer locations where we are providing services, the imposition of substantial liabilities for pollution resulting from our operations, and the application of specific health and safety criteria addressing worker protection. Some environmental laws impose substantial penalties for noncompliance, and others, such as CERCLA, impose strict, retroactive and joint and several liability for the remediation of releases of hazardous substances.

The denial of a permit essential to our operations or the imposition of conditions with which it is not practicable or feasible to comply could have an adverse effect on our business. Significant opposition to a permit by neighboring property owners, members of the public or other third parties or delay in the environmental review and permitting process also could impair or delay our operations.

Moreover, environmental requirements, and the interpretation and enforcement of these requirements, change frequently and have tended to become more stringent over time. Future environmental laws and regulations could restrict our ability to expand our facilities or extract our mineral deposits or could require us to acquire costly equipment or to incur other significant expenses in connection with our business. The costs associated with complying with such requirements, could have an adverse effect on our business, financial condition and results of operations.

Any failure by us or by our customers to comply with applicable environmental laws and regulations may cause governmental authorities to take actions that could adversely impact our operations and financial condition, including:


assessment of sanctions including administrative, civil or criminal penalties;


denial, modification, or revocation of permits or other authorizations;


occurrence of restrictions, delays or cancellations in permitting or development or performance of projects or operations;


imposition of injunctive obligations or other limitations on our operations, including cessation of operations; and


requirements to perform site investigatory, remedial, or other corrective actions or the incurrence of capital expenditures.

Any such regulations could require us to modify existing permits or obtain new permits, implement additional pollution control technology, curtail operations, increase significantly our operating costs or impose additional operating restrictions among our customers that reduce demand


60


Table of Contents

for our services. Such permit proceedings are often subject to public notice and comment, and third parties, including nongovernmental environmental organizations, may challenge government actions related to permits required for our operations.

Further, our business activities present risks of incurring significant environmental costs and liabilities, including costs and liabilities resulting from our handling of oilfield and other wastes, because of air emissions and wastewater discharges related to our operations, and due to historical oilfield industry operations and waste disposal practices. Moreover, accidental releases or spills may occur in the course of our operations or at facilities where our wastes are taken for reclamation or disposal, and we cannot assure you that we will not incur significant costs and liabilities as a result of such releases or spills, including any third-party claims for injuries to persons or damages to properties or natural resources. Some environmental laws and regulations may impose strict liability, which means that in some situations we could be exposed to liability as a result of our conduct that was lawful at the time it occurred or the conduct of, or conditions caused by, prior operators or other third parties. Remedial costs and other damages arising as a result of environmental laws and costs associated with changes in environmental laws and regulations could be significant and have an adverse effect on our liquidity, consolidated results of operations and financial condition.

Laws and regulations protecting the environment generally have become more stringent in recent years and are expected to continue to do so, which could lead to material increases in costs for future environmental compliance and remediation. In particular, the ESA restricts activities that may result in a “take” of endangered or threatened species and provides for substantial penalties in cases where listed species are taken by being harmed. The DSL is one example of a species that, if listed as endangered or threatened under the ESA, could impact our operations and the operations of our customers. The DSL is found in the active and semi-stable shinnery oak dunes of southeastern New Mexico and adjacent portions of Texas, including areas where our customers operate and our proppant facilities are located. The USFWS is currently conducting a thorough review to determine whether listing the dunes sagebrush lizard as endangered or threatened under the ESA is warranted. If the DSL is listed as an endangered or threatened species, our operations and the operations of our customers in any area that is designated as the DSL’s habitat may be limited, delayed or, in some circumstances, prohibited, and we and our customers could be required to comply with expensive mitigation measures intended to protect the DSL and its habitat. In 2021, we were accepted into the USFWS-approved CCAA for the DSL. We have supported and contributed to the development of the CCAA since its inception. Our participation in the CCAA and our other voluntary conservation measures for the benefit of the DSL, including plans to set aside as much as 17,000 acres for DSL habitat, helps reduce the risk of disruptions to our business and operations in the event the DSL is listed. Furthermore, new laws and regulations, amendment of existing laws and regulations, reinterpretation of legal requirements or increased governmental enforcement with respect to environmental matters could restrict, delay or curtail exploratory or developmental drilling for oil and natural gas by our customers and could limit our well servicing opportunities.

We may not be able to comply with any new or amended laws and regulations that are adopted, and any new or amended laws and regulations could have an adverse effect on our operating results by requiring us to modify our operations or equipment or shut down our facility. Additionally, our customers may not be able to comply with any new or amended laws and regulations, which could cause our customers to curtail or cease operations. We cannot at this time reasonably estimate our costs of compliance or the timing of any costs associated with any new or amended laws and regulations, or any material adverse effect that any new or modified standards will have on our customers and, consequently, on our operations.


61


Table of Contents

Our and our customers’ operations are subject to a number of risks arising out of the threat of climate change, including regulatory, political, litigation and financial risks, which could result in increased operating and capital costs for our customers and reduced demand for our products and services.

In recent years, the U.S. Congress has considered legislation to reduce emissions of greenhouse gas (“GHGs”), including methane, a primary component of natural gas, and carbon dioxide, a byproduct of the burning of natural gas. It presently appears unlikely that comprehensive climate legislation will be passed by either house of Congress in the near future, although energy legislation and other regulatory initiatives are expected to be proposed that may be relevant to GHG emissions issues. For example, in August 2022, U.S. Congress passed, and President Biden signed into law the Inflation Reduction Act of 2022 which appropriates significant federal funding for renewable energy initiatives and, for the first time ever, imposes a fee on GHG emissions from certain facilities. The emissions fee and funding provisions of the law could increase the operating costs of our customers and accelerate the transition away from fossil fuels, which could in turn adversely affect our business and results of operations. In addition, a number of states are addressing GHG emissions, primarily through the development of emission inventories or regional GHG cap and trade programs. Depending on the particular program, we could be required to control GHG emissions or to purchase and surrender allowances for GHG emissions resulting from our operations. Independent of Congress, the EPA has adopted regulations controlling GHG emissions under its existing authority under the federal Clean Air Act (“CAA.”) For example, following its findings that emissions of GHGs present an endangerment to human health and the environment because such emissions contributed to warming of the earth’s atmosphere and other climatic changes, the EPA has adopted regulations under existing provisions of the CAA that, among other things establish construction and operating permit reviews for GHG emissions from certain large stationary sources that are already potential major sources for conventional pollutants. In addition, the EPA has adopted rules requiring the monitoring and reporting of GHG emissions from specified production, processing, transmission and storage facilities in the United States on an annual basis. Relatedly, in November 2021, the EPA issued a proposed rule under the CAA that was intended to reduce methane and VOC emissions from the oil and natural gas industry, and in particular the crude oil and natural gas source category, which includes crude oil and natural gas production, as well as natural gas processing, transmission, and storage facilities. In November 2022, the EPA announced a supplemental proposed rulemaking intended to strengthen and expand its November 2021 proposed rule, and to impose more stringent requirements on the natural gas and oil industry. The 2022 proposed rule is currently subject to a public comment period that runs through February 13, 2023, and is expected to be finalized in 2023. We cannot predict whether and in what form EPA will finalize these amendments; however, any additional regulation of air emissions from the crude oil and natural gas sector could result in increased expenditures for pollution control equipment, which could impact our customers’ operations and negatively impact our business.

On an international level, over 190 countries, including the United States reached an agreement, known as the Paris Agreement, to reduce global GHG emissions in December 2015. The United States withdrew from this agreement under the Trump Administration, but reentered shortly after President Biden took office.

In April 2021, President Biden announced a goal of reducing the United States’ emissions by 50-52% below 2005 levels by 2030. In November 2021, the international community gathered again in Glasgow at the 26th Conference to the Parties on the UN Framework Convention on Climate Change (“COP26”), during which multiple announcements were made, including a call for parties to eliminate certain fossil fuel subsidies and pursue further action on non-CO2 GHGs. Relatedly, while at COP26, the United States and European Union jointly announced the launch of the “Global Methane Pledge,” which aims to cut global methane pollution at least 30% by 2030 relative to 2020 levels, including “all feasible reductions” in the energy sector. Since its formal launch at COP26, over 150 countries have joined the


62


Table of Contents

pledge. We cannot predict what additional legislative or regulatory requirements may result from these developments. COP26 concluded with the finalization of the Glasgow Climate Pact, which stated long-term global goals (including those in the Paris Agreement) aimed at limiting the increase in the global average temperature and reducing GHG emissions. These goals were reaffirmed at the November 2022 UN Climate Change Conference of Parties (“COP27”). Several states and geographic regions in the United States have also adopted legislation and regulations to reduce emissions of GHGs, including cap and trade regimes and commitments to contribute to meeting the goals of the Paris Agreement. To the extent that the United States and other countries implement the Paris Agreement and other international pledges or local, state, regional, national or international governments impose other climate change regulations on the oil and natural gas industry, our business could be adversely affected because substantial limitations on GHG emissions could adversely affect demand for the oil and natural gas that is produced by our customers.

Governmental, scientific and public concern over the threat of climate change arising from GHG emissions has resulted in increasing political risks in the United States, including climate change-related pledges made by certain candidates elected to public office. President Biden has issued several executive orders focused on addressing climate change, including items that may impact our costs to produce, or demand for, oil and natural gas. Additionally, in November 2021, the Biden Administration released “The Long-Term Strategy of the United States: Pathways to Net-Zero Greenhouse Gas Emissions by 2050,” which establishes a roadmap to net-zero emissions in the United States by 2050 through, among other things, improving energy efficiency; decarbonizing energy sources via electricity, hydrogen and sustainable biofuels; and reducing non-CO2 GHG emissions, such as methane and nitrous oxide. The Biden Administration is also considering revisions to the leasing and permitting programs for oil and natural gas development on federal lands. For more information, see the risk factor below titled “Any restrictions on oil and natural gas development on federal lands has the potential to adversely impact our operations and the operations of our customers.” Other actions that could be pursued may include the imposition of more restrictive requirements for the establishment of pipeline infrastructure or the permitting of LNG export facilities, as well as more strict GHG emission limitations for oil and natural gas facilities. Litigation risks are also increasing, as a number of entities have sought to bring suit against oil and natural gas companies in state or federal court, alleging, among other things, that such companies created public nuisances by producing fuels that contributed to climate change. Suits have also been brought against such companies under stockholder and consumer protection laws, alleging that companies have been aware of the adverse effects of climate change but failed to adequately disclose those impacts. To the extent these risks impact our customers, we may experience reduced demand for our proppant.

There are also increasing financial risks for fossil fuel producers as stockholders currently invested in fossil fuel energy companies may elect in the future to shift some or all of their investments into other sectors. Institutional lenders who provide financing to fossil fuel energy companies also have become more attentive to sustainable lending practices and some of them may elect not to provide funding for fossil fuel energy companies. For example, at COP26, the Glasgow Financial Alliance for Net Zero (“GFANZ”) announced that commitments from over 550 firms around the world had resulted in over $130 trillion in capital committed to net zero goals. The various sub-alliances of GFANZ generally require participants to set short-term, sector-specific targets to transition their financing, investing, and/or underwriting activities to net zero emissions by 2050. There is also a risk that financial institutions will be required to adopt policies that have the effect of reducing the funding provided to the fossil fuel sector. President Biden signed an executive order calling for the development of a “climate finance plan” and, separately, the Federal Reserve has joined the Network for Greening the Financial System (“NGFS”), a consortium of financial regulators focused on addressing climate-related risks in the financial sector. In November 2021, the Federal Reserve issued a statement in support of the efforts of the NGFS to identify key issues and potential solutions for the climate-related challenges most relevant to central banks and supervisory authorities. Limitation of investments in and financings


63


Table of Contents

for fossil fuel energy companies could result in the restriction, delay or cancellation of drilling programs or development or production activities, which could reduce demand for our proppant.

Additionally, in March 2022, the SEC proposed new rules relating to the disclosure of a range of climate-related data risks and opportunities, including financial impacts, physical and transition risks, related governance and strategy and GHG emissions, for certain public companies. We are currently assessing this rule but at this time we cannot predict the ultimate impact of the rule on our business or those of our customers. The SEC originally planned to issue a final rule by October 2022, but most commentators now expect a final rule to be issued in early 2023. To the extent this rule is finalized as proposed, we or our customers could incur increased costs related to the assessment and disclosure of climate-related risks and certain emissions metrics. In addition, enhanced climate disclosure requirements could accelerate the trend of certain stakeholders and lenders restricting or seeking more stringent conditions with respect to their investments in certain carbon intensive sectors.

Finally, physical climate change impacts, including increased frequency and severity of storms, severe and persistent drought conditions, winter storms, floods and other climatic events, may potentially have a large impact on our operations and financial results, and our customers’ exploration and production operations. The potential impacts of climate change and climate change regulations are highly uncertain at this time, and thus we cannot currently anticipate or predict any material adverse effect of climate change-related matters on our consolidated financial condition, results of operations, or how our cash flows may be effected as a result of climate change and climate change regulations.

Restrictions on our operations and those of our customers intended to protect certain species of wildlife could have an adverse impact on our ability to expand some of our existing operations or limit our customers’ ability to develop new oil and natural gas wells.

Various federal and state statutes prohibit certain actions that adversely affect endangered or threatened species and their habitat, migratory birds, wetlands, and natural resources. These statutes include the ESA, the Migratory Bird Treaty Act (“MBTA”), and the federal Clean Water Act (“CWA”). The USFWS may designate critical habitat areas that it believes are necessary for survival of threatened or endangered species. As a result of a 2011 settlement agreement, the USFWS was required to determine whether to identify more than 250 species as endangered or threatened under the ESA by no later than completion of the agency’s 2017 fiscal year. The USFWS missed the deadline but reportedly continues to review new species for protected status under the ESA pursuant to the settlement agreement. A critical habitat designation could result in further material restrictions on federal land use or on private land use and could delay or prohibit land access or development. Where takings of or harm to species or damages to wetlands, habitat, or natural resources occur or may occur, government entities or at times private parties may act to prevent or restrict oil and natural gas exploration activities or seek damages for any injury, whether resulting from drilling or construction or releases of oil, wastes, hazardous substances or other regulated materials, and in some cases, criminal penalties may result. Similar protections are offered to migratory birds under the MBTA.

The DSL is one example of a species that, if listed as endangered or threatened under the ESA, could impact our operations and the operations of our customers. The DSL is found in the active and semi-stable shinnery oak dunes of southeastern New Mexico and adjacent portions of Texas, including areas where our customers operate and our proppant facilities are located. The USFWS is currently conducting a thorough review to determine whether listing the dunes sagebrush lizard as endangered or threatened under the ESA is warranted. On November 17, 2021, one environmental organization delivered a Notice of Intent to Sue to the U.S. Department of the Interior (“DOI”) and the USFWS for failing to timely list the DSL as endangered. Then, in August 2022, the USFWS agreed, via a stipulated settlement agreement in a federal district court, to make an endangerment or threatened listing determination for the DSL by June 29, 2023. If the DSL is ultimately listed as an endangered or


64


Table of Contents

threatened species, our operations and the operations of our customers in any area that is designated as the DSL’s habitat may be limited, delayed or, in some circumstances, prohibited, and we and our customers could be required to comply with expensive mitigation measures intended to protect the dunes sagebrush lizard and its habitat. However, in January 2021, USFWS approved a CCAA for the DSL habitat in non-federal lands in certain counties of western Texas. We were a contributor to and supporter of the CCAA since its inception and have since been accepted into the program. Our participation in the CCAA and our other voluntary conservation measures for the benefit of the DSL reduces the risk of disruptions to our business and operations in the event the DSL is listed.

Another species whose recent listing could impact the operations of our customers is the Lesser Prairie-Chicken. In November 2022, the USFWS formally listed two Distinct Population Segments (“DPSs”) of the lesser prairie-chicken under the ESA. The Southern DPS, the habitat of which includes portions of southeast New Mexico and western Texas, was listed as endangered, while the Northern DPS, the habitat of which spans from northern Texas, through eastern Oklahoma, and intro southeastern Colorado and southwester Nebraska, was listed as threatened. The listed territory of the Southern DPS could overlap with the operating areas of some our customers, who in turn may be adversely affected by any restrictions which arose as a result of the endangerment determination. The identification or designation of further previously unprotected species as threatened or endangered in areas where we or our customers operate could cause us to incur increased costs arising from species protection measures or could result in limitations on our customers that result in reduced demand for our services, adversely affects the results of our operations. There is also increasing interest from a variety of stakeholders, including investors and institutional lenders, in nature-related matters beyond protected species, such as general biodiversity, which may similarly require us to incur costs or take other measures which may materially impact our business or operations.

Any restrictions on oil and natural gas development on federal lands has the potential to adversely impact our operations and the operations of our customers.

Many of our customers possess leases in New Mexico which are granted by the federal government and administered by the Bureau of Land Management (“BLM”), a federal agency. Operations conducted by our customers on federal oil and natural gas leases must comply with numerous additional statutory and regulatory restrictions. These leases contain relatively standardized terms requiring compliance with detailed regulations. Under certain circumstances, the BLM may require operations on federal leases to be suspended or terminated. Any such suspension or termination of our customers’ leases could reduce demand for our service and adversely impact the results of our operations.

Additionally, the Biden Administration has taken several actions to curtail oil and natural gas activities on federal lands. For example, on January 27, 2021, President Biden issued an executive order that instructed the Secretary of the Interior to pause new oil and natural gas leases on public lands, but not existing operations under valid leases or on tribal lands which the federal government merely holds in trust, pending completion of a comprehensive review and reconsideration of federal oil and natural issued a preliminary injunction against the order gas permitting and leasing practices. A federal district court in June 2021, which the Fifth U.S. Circuit Court of Appeals vacated and remanded to the district court on August 17, 2022. The federal district court issued a permanent injunction against the order on August 18, 2022 limited to the thirteen plaintiff states, which included Texas. Meanwhile, the DOI released a report on the federal oil and natural gas leasing program in November 2021 which included several recommendations for how to reform the program. Some of the report’s recommendations, including an increased royalty rate and a significant reduction in total available acreage have been incorporated into recent lease sales. In November 2022, BLM also issued a proposed rule to reduce the waste of natural gas from venting, flaring, and leaks during oil and gas production activities on Federal and Native American leases, which is currently subject to a public


65


Table of Contents

comment period that runs through January 30, 2023. While we cannot predict the ultimate impact of these changes or whether the DOI, or any additional operating restrictions, and BLM will implement further reforms, any revisions to the federal leasing or permitting process that make it more difficult for our customers to pursue operations on federal lands may adversely impact our operations. The outcome of litigation surrounding the Biden Administration’s Social Cost of Carbon (“SCC”) metric may also impact future regulatory decision-making and our customers’ ability to obtain federal leases. In February 2022, a district court blocked the Biden Administration’s use of its interim SCC value in agency decision-making. As a result the BLM’s first quarter oil and gas lease sale was delayed. In March 2022, the Fifth Circuit stayed the order while the government’s appeal remains in progress. The ultimate result of this litigation may impact the character of new regulations on certain of the federal oil and gas leases of our customers, which in turn could impact our results of operations.

Additionally, oil and natural gas operations on federal lands, and related infrastructure projects, may be impacted by recent changes to National Environmental Policy Act (“NEPA”) implementing regulations. In 2020, the Trump Administration made a variety of substantive and procedural changes to NEPA, including limiting the scope of review to the direct effects of a proposed project on the environment. A new ‘Final Rule,’ introduced by the Biden Administration in April 2022, which took effect in May 2022, reversed several changes introduced by the 2020 rule, including the scope limitations. The 2022 Final Rule requires NEPA reviews to incorporate consideration of indirect and cumulative impacts of the proposed project, including effects on climate change and GHGs, consistent with pre-2020 requirements. The new rule also allows agencies to create stricter NEPA rules as they see fit, but left in place the 2020 rule two-year time limit to complete environmental impact statements. The issuance of the new rule completes the first of a two-phased process by the Council on Environmental Quality’s (“CEQ”) to reconsider and revise the 2020 rule, so additional changes to the NEPA rules may be expected after the second phase of CEQ’s review is complete. While the ultimate impact of these changes or whether the DOI and the BLM will implement further reforms cannot be predicted, any revisions to the federal leasing or permitting process that makes it more difficult for our customers to operate economically on federal lands may materially and adversely impact our operations and results.

In addition to administrative and policy risks, operations on federal lands also face litigation risks. Ongoing litigation related to the federal oil and gas leasing program, the Biden Administration’s use of the SCC metric, and NEPA review may impact the federal oil and gas leases of our customers, which in turn could impact our results of operations. More recently, a June 2022 settlement approved by a federal district court in Washington, D.C., obligates BLM to redo its environment reports under NEPA for all oil and gas leases sold between 2015 and 2020, including leases in New Mexico. The settlement stems from a 2016 lawsuit alleging that BLM was not properly accounting for the cumulative climate impacts of its federal leasing program. Separately, there is a risk that authorizations required for existing operations may be delayed to the point that it causes a business disruption, and we cannot guarantee that further action will not be taken to curtail oil and natural gas development on federal land. For example, certain lawmakers have proposed to reduce or ban further leasing on federal lands or to adopt further restrictions for same. To the extent such legislation is passed, it may adversely impact our customers’ operations, which could negatively impact our financial performance or results of operations.

We and our customers are subject to regulations that impose stringent health and safety standards on numerous aspects of our operations.

Multiple aspects of our and our customers’ operations are subject to health and safety standards, including our mining operations, our trucking operations, and employee exposure to crystalline silica.

Our mining operations are subject to the Mine Safety and Health Act of 1977 (“Mine Act”), as amended by the Mine Improvement and New Emergency Response Act of 2006, which imposes stringent health and safety standards on numerous aspects of mineral extraction and processing


66


Table of Contents

operations, including the training of personnel, operating procedures, operating equipment and other matters. Our operating locations are regularly inspected by the MSHA for compliance with the Mine Act.

The Department of Transportation (“DOT”) and various state agencies exercise broad powers over our trucking services, generally governing matters including authorization to engage in motor carrier service, equipment operation, safety, and financial reporting. In addition, our operations must comply with the Fair Labor Standard Act, which governs such matters as wages and overtime, and which is administered by the DOL. We may be audited periodically by the DOT or the DOL to ensure that we are in compliance with these safety, hours-of-service, wage and other rules and regulations.

We are also subject to laws and regulations relating to human exposure to crystalline silica. Several federal and state regulatory authorities, including MSHA and OSHA, may continue to propose changes to their regulations regarding workplace exposure to crystalline silica, such as permissible exposure limits, required controls and personal protective equipment. Our failure to comply with existing or new health and safety standards, or changes in such standards or the interpretation or enforcement thereof, could require us or our customers to modify operations or equipment, shut down some or all operating locations, impose significant restrictions on our ability to conduct operations or otherwise have an adverse effect on our business, financial condition and results of operations.

We and our customers are subject to other extensive regulations, including licensing, plant and wildlife protection and reclamation regulation, that impose, and will continue to impose, significant costs and liabilities. In addition, future regulations, or more stringent enforcement of existing regulations, could increase those costs and liabilities, which could adversely affect our results of operations.

In addition to the regulatory matters described above, we and our customers are subject to extensive governmental regulation on matters such as permitting and licensing requirements, plant and wildlife protection, wetlands protection, reclamation and restoration activities at mining properties after mining is completed, the discharge of materials into the environment, and the effects that mining and hydraulic fracturing have on groundwater quality and availability. Our future success depends, among other things, on the quantity and quality of our proppant deposits, our ability to extract these deposits profitably, and our customers being able to operate their businesses as they currently do.

In order to obtain permits and renewals of permits in the future, we may be required to prepare and present data to governmental authorities pertaining to the potential adverse impact that any proposed excavation or production activities, individually or in the aggregate, may have on the environment. Certain approval procedures may require preparation of archaeological surveys, endangered species studies, and other studies to assess the environmental impact of new sites or the expansion of existing sites. Compliance with these regulatory requirements is expensive and significantly lengthens the time needed to develop a site. Finally, obtaining or renewing required permits is sometimes delayed or prevented due to community opposition and other factors beyond our control. The denial of a permit essential to our operations or the imposition of conditions with which it is not practicable or feasible to comply could impair or prevent our ability to develop or expand a site. Significant opposition to a permit by neighboring property owners, members of the public, or other third parties, or delay in the environmental review and permitting process also could delay or impair our ability to develop or expand a site. New legal requirements, including those related to the protection of the environment, could be adopted that could adversely affect our mining operations (including our ability to extract or the pace of extraction of mineral deposits), our cost structure, or our customers’ ability to use our proppant. Such current or future regulations could have an adverse effect on our business, and we may not be able to obtain or renew permits in the future.


67


Table of Contents

Risks Related to Our Class A Common Stock and Organizational Structure

We are a holding company. Our sole material asset after completion of this offering and our corporate reorganization will be our equity interest in Atlas Operating, and we will accordingly be dependent upon cash distributions from Atlas Operating to cover our taxes and corporate and overhead expenses, among other expenses.

We are a holding company and will have no material assets other than our equity interest in Atlas Operating. We will have no independent means of generating revenue. To the extent Atlas Operating has available cash and subject to the terms of any current or future debt instruments, the Atlas Operating LLC Agreement will (i) require Atlas Operating to make pro rata cash distributions to the Atlas Unitholders, including us, in an amount sufficient to allow us to pay our taxes and (ii) permit us, as managing member of Atlas Operating, to cause Atlas Operating to make additional pro rata distributions to the Atlas Unitholders, including to us and the Legacy Owners holding Atlas Units after this offering, in an amount generally intended to allow such holders (other than us) to satisfy their respective income tax liabilities with respect to their allocable share of the income of Atlas Operating, based on certain assumptions and conventions, to the extent such liabilities exceed amounts otherwise distributed by Atlas Operating. We generally expect Atlas Operating to fund such distributions out of available cash. When Atlas Operating makes distributions, the Atlas Unitholders will be entitled to receive proportionate distributions based on their interests in Atlas Operating at the time of such distribution. In addition, the Atlas Operating LLC Agreement will require Atlas Operating to make non-pro rata payments to us to reimburse us for our corporate and other overhead expenses, which payments will not be treated as distributions under the Atlas Operating LLC Agreement. To the extent that we need funds and Atlas Operating or its subsidiaries (including Atlas LLC) are restricted from making such distributions or payments under applicable law or regulation or under the terms of the ABL Credit Agreement or any future financing arrangements, or are otherwise unable to provide such funds, our liquidity and financial condition could be adversely affected.

Moreover, because we will have no independent means of generating revenue, our ability to make tax payments is dependent on the ability of Atlas Operating to make distributions to us in an amount sufficient to cover our tax obligations. This ability, in turn, may depend on the ability of Atlas Operating’s subsidiaries (including Atlas LLC) to make distributions to Atlas Operating. The ability of Atlas Operating, its subsidiaries and other entities in which it directly or indirectly holds an equity interest to make such distributions will be subject to, among other things, (i) the applicable provisions of Delaware law (or other applicable jurisdiction) that may limit the amount of funds available for distribution and (ii) restrictions in our debt instruments issued by Atlas Operating or its subsidiaries (including Atlas LLC) and other entities in which it directly or indirectly holds an equity interest.

Our stock prices and trading volumes could be volatile, and you may not be able to resell shares of your Class A common stock when desired, at or above the price you paid, or at all.

The stock market has experienced and continues to experience extreme price and volume fluctuations that have often been unrelated or disproportionate to the operating performance of the underlying businesses. In 2020, market volatility was especially high due to the ongoing COVID-19 pandemic. In addition, broad market fluctuations may adversely affect the market price of our Class A common stock, regardless of our actual operating performance. In addition to the other risks described in this section, the market price of our Class A common stock may fluctuate significantly in response to a number of factors, many of which we cannot control, including:


our operating and financial performance;


quarterly variations in the rate of growth of our financial indicator;


the public reaction to our press releases, our other public announcements, and our filings with the SEC;


68


Table of Contents
   

announcements by others in or affecting our industry or our customers;


strategic actions by our competitors;


our failure to meet revenue or earnings estimates by research analysts or other investors;


changes in revenue or earnings estimates, or changes in recommendations or withdrawal of research coverage, by equity research analysts;


inaccurate or unfavorable research or ratings published by industry analysts about our business, or a cessation of coverage of us by industry analysts;


speculation in the press or investment community;


the failure of research analysts to cover our Class A common stock;


sales of our Class A common stock by us, the Legacy Owners (including following an exercise of the Redemption Right or Call Right) or our other stockholders, or the perception that such sales may occur;


changes in accounting principles, policies, guidance, interpretations or standards;


additions or departures of key management personnel;


actions by our stockholders;


general market conditions, including fluctuations in commodity prices, sand-based proppant or industrial and recreational sand-based products;


our acquisition of, investment in or disposition of other businesses;


domestic and international economic, legal and regulatory factors unrelated to our performance; and


the realization of any of the risks described under this “Risk Factors” section.

Volatility in the market price or trading volume of our Class A common stock may make it difficult or impossible for you to sell your Class A common stock at or above the price at which you purchased the stock. As a result, you may suffer a loss on your investment. Securities class action litigation has often been instituted against companies following periods of volatility in the overall market and in the market price of a company’s securities. This litigation, if instituted against us, could result in substantial costs, reduce our profits, divert our management’s attention and resources and harm our business.

Investors in this offering will experience immediate and substantial dilution.

Based on an assumed initial public offering price of $                 per share (the midpoint of the price range set forth on the cover of this prospectus), purchasers of our Class A common stock in this offering will experience an immediate and substantial dilution of $                 per share in the as adjusted net tangible book value per share of Class A common stock from the initial public offering price, and our as adjusted net tangible book value as of                 after giving effect to this offering and the transactions related thereto would be $                 per share. This dilution is due in large part to earlier investors having paid substantially less than the initial public offering price when they purchased their shares. Please see the section titled “Dilution.”

Future sales of our Class A common stock in the public market, or the perception that such sales may occur, could reduce our stock price, and any additional capital raised by us through the sale of equity or convertible securities may dilute your ownership in us.

We may sell additional shares of our Class A common stock in subsequent offerings. In addition, subject to certain limitations and exceptions, the Legacy Owners holding Atlas Units may redeem their


69


Table of Contents

Atlas Units for shares of Class A common stock (on a one-for-one basis, subject to conversion rate adjustments for stock splits, stock dividends and reclassification and other similar transactions) and then sell those shares of Class A common stock. Sales of substantial amounts of our Class A common stock (including shares issued in connection with an acquisition), or the perception that such sales could occur, may adversely affect prevailing market prices of our Class A common stock. Certain Legacy Owners who will own, in aggregate, approximately     % of our Class A and Class B common stock on a combined basis, will be party to a registration rights agreement, which will include provisions by which we agree, after the expiration of the lock-up period described below, to register under the U.S. federal securities laws the offer and resale of shares of our Class A common stock (including shares issued in connection with any redemption of Atlas Units pursuant to the Redemption Right or the Call Right) by such Legacy Owners or certain of their respective affiliates or permitted transferees under the registration rights agreement. See “Certain Relationships and Related Party Transaction—Registration Rights Agreement.”

We cannot predict the size of future issuances of our Class A common stock or securities convertible into Class A common stock or the effect, if any, that future issuances and sales of shares of our Class A common stock will have on the market price of our Class A common stock. Sales of substantial amounts of our Class A common stock (including shares issued in connection with an acquisition), or the perception that such sales could occur, may adversely affect prevailing market prices of our Class A common stock.

Certain of our Principal Stockholders will have the ability to direct the voting of a majority of the voting power of our common stock, and their interests may conflict with those of our other stockholders.

Holders of Class A common stock and Class B common stock vote together as a single class on all matters presented to our stockholders for their vote or approval, except as otherwise required by applicable law or our certificate of incorporation. Upon completion of this offering, certain of our Legacy Owners will enter into a stockholders’ agreement (the “Principal Stockholders”) with us. The Principal Stockholders will collectively own approximately     % of our voting stock (or approximately     % if the underwriters’ option to purchase additional shares is exercised in full). As a result, on a combined basis, our Principal Stockholders will be able to control matters requiring stockholder approval, including the election of directors, changes to our organizational documents and significant corporate transactions. This concentration of ownership makes it unlikely that any other holder or group of holders of our Class A common stock will be able to affect the way we are managed or the direction of our business. The interests of our Principal Stockholders with respect to matters potentially or actually involving or affecting us, such as future acquisitions, financings and other corporate opportunities and attempts to acquire us, may conflict with the interests of our other stockholders. Given this concentrated ownership, our Principal Stockholders would have to approve any potential acquisition of us.

The stockholders’ agreement provides Mr. Brigham or his affiliates with the right to designate certain numbers of nominees to our board of directors and the right to approve certain actions by the Company, so long as such Principal Stockholders and their affiliates collectively beneficially own specified percentages of the outstanding shares of our Class A and Class B common stock on a combined basis. Additionally, the stockholders’ agreement provides that the Principal Stockholders agree to cause their respective shares of Class A and Class B common stock to be voted in favor of the election of each of the director nominees designated by Mr. Brigham or his affiliates. See “Certain Relationships and Related Party Transactions—Stockholders’ Agreement.”

Accordingly, Mr. Brigham or his affiliates will have the ability to strongly influence the election of the members of our board of directors, and thereby our management and affairs. In addition, the


70


Table of Contents

Principal Stockholders will be able to strongly influence the outcome of all matters requiring stockholder approval, including mergers and other material transactions. This ownership by the Principal Stockholders may also have the effect of deterring hostile takeovers, delaying or preventing changes in control or changes in management, or limiting the ability of our other stockholders to approve transactions that they may deem to be in the best interests of our Company. Moreover, this ownership by the Principal Stockholders may also adversely affect the trading price of our Class A common stock to the extent investors perceive a disadvantage in owning stock of a company with concentrated ownership.

Certain of our Principal Stockholders and members of our board of directors are not limited in their ability to compete with us, and the corporate opportunity provisions in our amended and restated certificate of incorporation could enable certain of our Principal Stockholders and members of our board of directors to benefit from corporate opportunities that might otherwise be available to us.

Our governing documents will provide that our Principal Stockholders and any member of our board of directors who is not at the time an officer of the Company and their respective affiliates are not restricted from owning assets or engaging in businesses that compete directly or indirectly with us and that we renounce any interest or expectancy in any business opportunity that may be from time to time presented to our Principal Stockholders and any member of our board of directors who is not at the time an officer of the Company or their respective affiliates. In particular, subject to the limitations of applicable law, our amended and restated certificate of incorporation will, among other things:


permit our Principal Stockholders and any member of our board of directors who is not at the time an officer of the Company and their respective affiliates to conduct business that competes with us and to make investments in any kind of property in which we may make investments; and


provide that if our Principal Stockholders or any member of our board of directors who is not at the time an officer of the Company or their respective affiliates becomes aware of a potential business opportunity, transaction or other matter, they will have no duty to communicate or offer that opportunity to us.

Our Principal Stockholders or any member of our board of directors who is not at the time an officer of the Company or their respective affiliates may become aware, from time to time, of certain business opportunities (such as acquisition opportunities) and may direct such opportunities to other businesses in which they have invested, in which case we may not become aware of or otherwise have the ability to pursue such opportunity. Further, such businesses may choose to compete with us for these opportunities, possibly causing these opportunities to not be available to us or causing them to be more expensive for us to pursue. In addition, our Principal Stockholders and any member of our board of directors who is not at the time an officer of the Company and their respective affiliates may dispose of mining or other properties or other assets in the future, without any obligation to offer us the opportunity to purchase any of those assets. As a result, our renouncing our interest and expectancy in any business opportunity that may be from time to time presented to our Principal Stockholders and any member of our board of directors who is not at the time an officer of the Company and their respective affiliates could adversely impact our business or prospects if attractive business opportunities are procured by such parties for their own benefit rather than for ours. Please read “Description of Capital Stock—Corporate Opportunity.”

Certain of our Principal Stockholders or their affiliates are established participants in the oil and natural gas industry and may have resources greater than ours, which may make it more difficult for us to compete with our Principal Stockholders or their affiliates with respect to commercial activities as well as for potential acquisitions. We cannot assure you that any conflicts that may arise between us and our stockholders, on the one hand, and our Principal Stockholders or their affiliates, on the other


71


Table of Contents

hand, will be resolved in our favor. As a result, potential competition from our Principal Stockholders or their affiliates could adversely impact our results of operations.

We expect to be a “controlled company” within the meaning of the rules of the NYSE and, as a result, will qualify for exemptions from certain corporate governance requirements.

Upon completion of this offering, the Principal Stockholders will initially indirectly own                  shares of Class A common stock and                  shares of Class B common stock, representing approximately     % of the voting power of our Common Stock (or                  shares of Class A common stock and                  shares of Class B common stock if the underwriters’ option to purchase additional shares is exercised in full, representing approximately     % of the voting power of our Common Stock). Pursuant to the terms of the stockholders’ agreement, the Principal Stockholders have agreed to vote their respective shares of Class A and Class B common stock in favor of the election of each of the director nominees designated by Mr. Brigham or his affiliates. See “Certain Relationships and Related Party Transactions—Stockholders’ Agreement.” As a result, we expect to be a controlled company within the meaning of the NYSE’s corporate governance standards. Under the rules of the NYSE, a company of which more than 50% of the voting power for the election of directors is held by an individual, company or group of persons acting together is a controlled company and may elect not to comply with certain NYSE corporate governance requirements, including the requirements that:


a majority of the board of directors consist of independent directors as defined under the rules of the NYSE;


the nominating and governance committee be composed entirely of independent directors with a written charter addressing the committee’s purpose and responsibilities; and


the compensation committee be composed entirely of independent directors with a written charter addressing the committee’s purpose and responsibilities.

These requirements will not apply to us as long as we remain a controlled company. Accordingly, you may not have the same protections afforded to stockholders of companies that are subject to all of the corporate governance requirements of the NYSE. See “Management—Status as a Controlled Company.”

Anti-takeover provisions in our organizational documents might discourage or delay acquisition bids or merger proposals, which may adversely affect the market price of our Class A common stock and limit the price investors might be willing to pay in the future for our Class A common stock.

Our amended and restated certificate of incorporation and amended and restated bylaws will contain provisions that may discourage unsolicited takeover proposals that stockholders may consider to be in their best interests. These provisions:


authorize the issuance of undesignated preferred stock, the terms of which may be established and the shares of which may be issued without stockholder approval, and which may include super voting, special approval, dividend or other rights or preferences superior to the rights of our Class A common stock;


prohibit stockholder action by written consent, which requires all stockholder actions to be taken at a meeting of our stockholders at such time as the Principal Stockholders cease to own more than a majority of the outstanding shares of our Class A common stock and Class B common stock on a combined basis;


provide for our board of directors to be divided into three classes of directors, with each class as nearly equal in number as possible, serving staggered three-year terms, other than directors that may be elected by holders of our preferred stock, if any;


72


Table of Contents
   

provide that our board of directors is expressly authorized to make, alter or repeal our Bylaws; and


establish advance notice requirements for nominations of directors or for proposing matters that can be acted upon by stockholders at stockholder meetings.

These anti-takeover provisions could discourage, delay or prevent a transaction involving a change in control of our Company all together, even if doing so would benefit our stockholders. These provisions could also discourage proxy contests and make it more difficult for you and other stockholders to elect directors of your choosing and to cause us to take other corporate actions you desire. Further, the stockholders’ agreement, the staggered board of directors and the ability of the board of directors to designate the terms of and issue new series of preferred stock may make the removal of management more difficult and may discourage transactions that otherwise could involve payment of a premium over prevailing market prices for our securities.

Our amended and restated certificate of incorporation will designate the Court of Chancery of the State of Delaware and, to the extent enforceable, the federal district courts of the United States of America as the sole and exclusive forum for certain types of actions and proceedings that may be initiated by our stockholders, which could limit our stockholders’ ability to obtain a favorable judicial forum for disputes with us or our directors, officers, employees or agents.

Our amended and restated certificate of incorporation will provide that, unless we consent in writing to the selection of an alternative forum, the Court of Chancery of the State of Delaware (or, if the Court of Chancery of the State of Delaware does not have jurisdiction, the Superior Court of the State of Delaware, or, if the Superior Court of the State of Delaware does not have jurisdiction, the United States District Court for the District of Delaware, in each case, subject to that court having personal jurisdiction over the indispensable parties named defendants therein) will, to the fullest extent permitted by applicable law, be the sole and exclusive forum for any stockholder (including a beneficial owner) to bring (i) any derivative action or proceeding brought on our behalf, (ii) any action asserting a claim of breach of a fiduciary duty owed by any of our current or former directors, officers, employees or stockholders to us or our stockholders, (iii) any action asserting a claim arising pursuant to any provision of the Delaware General Corporation Law (the “DGCL”), our amended and restated certificate of incorporation or our bylaws (as either may be amended or restated), or as to which the DGCL confers jurisdiction to the Court of Chancery of the State of Delaware, our amended and restated certificate of incorporation or our bylaws, or (v) any other action asserting a claim against us that is governed by the internal affairs doctrine.

Our amended and restated certificate of incorporation will also provide that, unless we consent in writing to an alternate forum, to the fullest extent permitted by applicable law, the federal district courts of the United States will be the exclusive forum for resolving any complaint asserting a cause of action arising under the Securities Act. Notwithstanding the foregoing, the exclusive forum provision will not apply to suits brought to enforce any liability or duty created by the Exchange Act or any other claim for which the federal courts have exclusive jurisdiction. While the Delaware courts have determined that such choice of forum provisions are facially valid, a stockholder may nevertheless seek to bring a claim in a venue other than those designated in the exclusive forum provisions, and there can be no assurance that such provisions will be enforced by a court in those other jurisdictions. If a court were to find the exclusive-forum provisions contained in our amended and restated certificate of incorporation to be inapplicable or unenforceable in an action, we may incur additional costs associated with resolving such action in other jurisdictions, which could harm our business.

To the fullest extent permitted by law, any person or entity purchasing or otherwise acquiring any interest in shares of our capital stock will be deemed to have notice of, and consented to, the


73


Table of Contents

provisions of our amended and restated certificate of incorporation described in the preceding sentence. This choice of forum provision may limit a stockholder’s ability to bring a claim in a judicial forum that it finds favorable for disputes with us or our directors, officers, employees or agents, which may discourage such lawsuits against us and such persons. Alternatively, if a court were to find these provisions of our amended and restated certificate of incorporation inapplicable to, or unenforceable in respect of, one or more of the specified types of actions or proceedings, we may incur additional costs associated with resolving such matters in other jurisdictions, which could adversely affect our business, financial condition or results of operations.

In certain circumstances, Atlas Operating may make tax distributions to the Atlas Unitholders, including us, and such tax distributions may be substantial. To the extent we receive tax distributions in excess of our actual tax liabilities and retain such excess cash, the Legacy Owners that hold Atlas Units would benefit from such accumulated cash balances if they exercise their Redemption Right.

To the extent Atlas Operating has available cash and subject to the terms of any current or future debt instruments, the Atlas Operating LLC Agreement will (i) require Atlas Operating to make pro rata cash distributions to the Atlas Unitholders, including us, in an amount sufficient to allow us to pay our taxes and (ii) permit us, as managing member of Atlas Operating, to cause Atlas Operating to make additional pro rata distributions to the Atlas Unitholders, including to the Legacy Owners that hold Atlas Units and us, in an amount generally intended to allow such holders (other than us) to satisfy their respective income tax liabilities with respect to their allocable share of the income of Atlas Operating, based on certain assumptions and conventions, to the extent such liabilities exceed amounts otherwise distributed by Atlas Operating. The amount of such tax distributions will be determined based on certain assumptions, including an assumed individual income tax rate, and will be calculated after taking into account other distributions (including other tax distributions) made by Atlas Operating. Because tax distributions will be made pro rata based on ownership and due to, among other items, differences between the tax rates applicable to us and the assumed individual income tax rate used in the calculation and requirements under the applicable tax rules that Atlas Operating’s net taxable income be allocated disproportionately to its unitholders in certain circumstances, tax distributions may significantly exceed the actual tax liability for many of the Atlas Unitholders, including us. If we retain the excess cash it receives, the Legacy Owners that hold Atlas Units would benefit from any value attributable to such accumulated cash balances upon their exercise of the Redemption Right. However, we expect to take steps to eliminate any material cash balances. In addition, the tax distributions Atlas Operating may make may be substantial and may exceed the tax liabilities that would be owed by a similarly situated corporate taxpayer. Funds used by Atlas Operating to make tax distributions will not be available for reinvestment in our business, except to the extent we use the excess cash it receives to reinvest in Atlas Operating for additional units.

We are an “emerging growth company” and we cannot be certain if the reduced disclosure requirements applicable to emerging growth companies will make our Class A common stock less attractive to investors.

We are an “emerging growth company,” as defined in the JOBS Act and we intend to take advantage of certain exemptions from various reporting requirements that are applicable to other public companies, including, but not limited to, not being required to comply with the auditor attestation requirements of Section 404 of the Sarbanes-Oxley Act, reduced disclosure obligations regarding executive compensation in our periodic reports and proxy statements and exemptions from the requirements of holding a nonbinding advisory vote on executive compensation and stockholder approval of any golden parachute payments not previously approved. We intend to take advantage of these reporting exemptions until we are no longer an emerging growth company. We cannot predict if investors will find our Class A common stock less attractive because we will rely on these exemptions.


74


Table of Contents

If some investors find our Class A common stock less attractive as a result, there may be a less active trading market for our Class A common stock and our stock price may be more volatile.

We will remain an emerging growth company for up to five years after our IPO, although we will lose that status sooner if we have more than $1.235 billion of revenues in a fiscal year, have more than $700 million in market value of our Class A common stock held by non-affiliates as of any June 30 or issue more than $1.0 billion of non-convertible debt over a rolling three-year period.

To the extent that we rely on any of the exemptions available to emerging growth companies, you will receive less information about our executive compensation and internal control over financial reporting than issuers that are not emerging growth companies. If some investors find our Class A common stock to be less attractive as a result, there may be a less active trading market for our Class A common stock and our stock price may be more volatile.

We may issue preferred stock whose terms could adversely affect the voting power or value of our Class A common stock.

Our amended and restated certificate of incorporation will authorize us to issue, without the approval of our stockholders, one or more classes or series of preferred stock having such designations, preferences, limitations and relative rights, including preferences over our Class A common stock respecting dividends and distributions, as our board of directors may determine. The terms of one or more classes or series of preferred stock could adversely impact the voting power or value of our Class A common stock. For example, we might grant holders of preferred stock the right to elect some number of our directors in all events or on the happening of specified events or the right to veto specified transactions. Similarly, the repurchase or redemption rights or liquidation preferences we might assign to holders of preferred stock could affect the residual value of the Class A common stock.

There is currently no existing market for our Class A common stock, and a market for our securities may not develop, which would adversely affect the liquidity and price of our securities.

Prior to this offering, there has not been a public market for our Class A common stock. We cannot predict the extent to which investor interest in our Company will lead to the development of an active trading market on the stock exchange on which we list our Class A common stock or otherwise or how liquid that market might become. If an active trading market does not develop, anyone purchasing our Class A common stock may have difficulty selling it. The initial public offering price for the Class A common stock was determined by negotiations between us and the representatives of the underwriters and may not be indicative of prices that will prevail in the open market following this offering. Consequently, purchasers of our Class A common stock may be unable to sell it at prices equal to or greater than the price paid.

The following factors could affect our stock price:


quarterly variations in our financial and operating results;


the public reaction to our press releases, our other public announcements and our filings with the SEC;


strategic actions by our competitors;


changes in revenues or earnings estimates, or changes in recommendations or withdrawal of research coverage, by equity research analysts;


speculation in the press or investment community;


the failure of research analysts to cover our Class A common stock;


75


Table of Contents
   

sales of our Class A common stock by us or other stockholders, or the perception that such sales may occur;


equity capital markets transactions by other proppant companies, including by way of initial public offerings;


changes in accounting principles, policies, guidance, interpretations or standards;


additions or departures of key management personnel;


actions by our stockholders;


general market conditions, including fluctuations in commodity prices;


changes in, or investors’ perception of, the oil and natural gas industry;


litigation involving us, our industry, or both;


domestic and international economic, legal and regulatory factors unrelated to our performance; and


the realization of any risks described under this “Risk Factors” section.

The stock markets in general have experienced extreme volatility that has often been unrelated to the operating performance of particular companies. These broad market fluctuations may adversely affect the trading price of our Class A common stock. Securities class action litigation has often been instituted against companies following periods of volatility in the overall market and in the market price of a company’s securities. Such litigation, if instituted against us, could result in very substantial costs, divert our management’s attention and resources and harm our business, operating results and financial condition.

If Atlas Operating were to become a publicly traded partnership taxable as a corporation for U.S. federal income tax purposes, we and Atlas Operating might be subject to potentially significant tax inefficiencies.

We intend to operate such that Atlas Operating does not become a publicly traded partnership taxable as a corporation for U.S. federal income tax purposes. A “publicly traded partnership” is a partnership the interests of which are traded on an established securities market or are readily tradable on a secondary market or the substantial equivalent thereof. Under certain circumstances, redemptions of Atlas Units pursuant to the Redemption Right or Call Right, or other transfers of Atlas Units, could cause Atlas Operating to be treated as a publicly traded partnership. Applicable U.S. Treasury regulations provide for certain safe harbors from treatment as a publicly traded partnership, and we intend to operate such that redemptions or other transfers of Atlas Units qualify for one or more such safe harbors. For example, we intend to limit the number of holders of Atlas Units, and the Atlas Operating LLC Agreement, which will be entered into in connection with the corporate reorganization, will provide for limitations on the ability of holders of Atlas Units to transfer their Atlas Units and will provide us, as managing member of Atlas Operating, with the right to impose restrictions (in addition to those already in place) on the ability of holders of Atlas Units to redeem their Atlas Units pursuant to the Redemption Right to the extent we believe it is necessary to ensure that Atlas Operating will continue to be treated as a partnership for U.S. federal income tax purposes.

If Atlas Operating were to become a publicly traded partnership taxable as a corporation for U.S. federal income tax purposes, significant tax inefficiencies might result for us and for Atlas Operating, including as a result of the inability to file a consolidated U.S. federal income tax return with Atlas Operating.


76


Table of Contents

Our organizational structure confers certain benefits upon the Legacy Owners that hold Atlas Units that will not benefit the holders of our Class A common stock to the same extent as it will benefit such Legacy Owners.

Our organizational structure confers certain benefits upon the Legacy Owners that hold Atlas Units that do not benefit the holders of our Class A common stock to the same extent as it will benefit such Legacy Owners. We are a holding company and have no material assets other than our ownership of Atlas Units. As a consequence, our ability to declare and pay dividends to the holders of our Class A common stock is subject to the ability of Atlas Operating to provide distributions to us. If Atlas Operating makes such distributions, the Legacy Owners that hold Atlas Units will be entitled to receive equivalent distributions from Atlas Operating on a pro rata basis. However, because we must pay taxes, amounts ultimately distributed as dividends to holders of our Class A common stock are expected to be less on a per share basis than the amounts distributed by Atlas Operating to such Legacy Owners on a per unit basis. This and other aspects of our organizational structure may adversely impact the future trading market for our Class A common stock.

The U.S. federal income tax treatment of distributions on our Class A common stock to a holder will depend upon our tax attributes and the holder’s tax basis in our stock, which are not necessarily predictable and can change over time.

Distributions of cash or other property on our Class A common stock, if any, will constitute dividends for U.S. federal income tax purposes to the extent paid from our current or accumulated earnings and profits, as determined under U.S. federal income tax principles. To the extent those distributions exceed our current and accumulated earnings and profits, the distributions will be treated as a non-taxable return of capital to the extent of the holder’s tax basis in our Class A common stock and thereafter as capital gain from the sale or exchange of such common stock. Also, if any holder sells our Class A common stock, the holder will recognize a gain or loss equal to the difference between the amount realized and the holder’s tax basis in such Class A common stock.

To the extent that the amount of our distributions is treated as a non-taxable return of capital as described above, such distribution will reduce a holder’s tax basis in the Class A common stock. Consequently, such excess distributions will result in a corresponding increase in the amount of gain, or a corresponding decrease in the amount of loss, recognized by the holder upon the sale of the Class A common stock or subsequent distributions with respect to such stock. Additionally, with regard to U.S. corporate holders of our Class A common stock, to the extent that a distribution on our Class A common stock exceeds both our current and accumulated earnings and profits and such holder’s tax basis in such shares, such holders would be unable to utilize the corporate dividends-received deduction (to the extent it would otherwise be applicable to such holder) with respect to the gain resulting from such excess distribution.

Investors in our Class A common stock are encouraged to consult their tax advisors as to the tax consequences of receiving distributions on our Class A common stock that are not treated as dividends for U.S. federal income tax purposes.

Because we have elected to take advantage of the extended transition period pursuant to Section 107 of the JOBS Act, our financial statements may not be comparable to those of other public companies.

Section 107 of the JOBS Act provides that an emerging growth company can use the extended transition period provided in Section 7(a)(2)(B) of the Securities Act for complying with new or revised accounting standards. This permits an emerging growth company to delay the adoption of certain accounting standards until those standards would otherwise apply to private companies. We are choosing to take advantage of this extended transition period and, as a result, we will comply with new


77


Table of Contents

or revised accounting standards on the relevant dates on which adoption of such standards is required for private companies. Accordingly, our financial statements may not be comparable to companies that comply with public company effective dates, and our stockholders and potential investors may have difficulty in analyzing our operating results by comparing us to such companies.

General Risk Factors

The requirements of being a public company, including compliance with the reporting requirements of the Exchange Act, and the requirements of Sarbanes-Oxley, may strain our resources, increase our costs and distract management, and we may be unable to comply with these requirements in a timely or cost-effective manner.

As a public company, we need to comply with laws, regulations and requirements, certain corporate governance provisions of Sarbanes-Oxley and related regulations of the SEC and the requirements of the NYSE. Complying with these statutes, regulations and requirements occupies a significant amount of time of our board of directors and management and significantly increases our costs and expenses. We will need to:


institute a more comprehensive compliance function to test and conclude on the sufficiency of our internal controls around financial reporting;


comply with rules promulgated by the NYSE;


prepare and distribute periodic public reports;


establish new internal policies, such as those relating to insider trading; and


involve and retain to a greater degree outside professionals in the above activities.

Furthermore, while we must comply with Section 404 of Sarbanes-Oxley, we are not required to have our independent registered public accounting firm attest to the effectiveness of our internal controls until our first annual report subsequent to our ceasing to be an “emerging growth company” within the meaning of Section 2(a)(19) of the Securities Act. Accordingly, we may not be required to have our independent registered public accounting firm attest to the effectiveness of our internal controls until as late as our annual report for the fiscal year ending December 31, 2028. Once it is required to do so, our independent registered public accounting firm may issue a report that is adverse in the event it is not satisfied with the level at which our controls are documented, designed, operated or reviewed. Compliance with these requirements may strain our resources, increase our costs and distract management, and we may be unable to comply with these requirements in a timely or cost-effective manner.

We believe that the out-of-pocket costs, diversion of management’s attention from running the day-to-day operations and operational changes caused by the need to comply with the requirements of Section 404 of Sarbanes-Oxley could be significant. If the time and costs associated with such compliance exceed our current expectations, our results of operations could be adversely affected.

If we fail to comply with the requirements of Section 404 or if we or our independent registered public accounting firm identify and report such material weaknesses, the accuracy and timeliness of the filing of our annual and quarterly reports may be adversely affected and could cause investors to lose confidence in our reported financial information, which could have a negative effect on the stock price of our Class A common stock. In addition, a material weakness in the effectiveness of our internal control over financial reporting could result in an increased chance of fraud and the loss of customers, reduce our ability to obtain financing and require additional expenditures to comply with these requirements, each of which could have an adverse effect on our business, results of operations and financial condition.


78


Table of Contents

In addition, being a public company subject to these rules and regulations may make it more difficult and more expensive for us to obtain director and officer liability insurance and we may be required to accept reduced policy limits and coverage or incur substantially higher costs to obtain the same or similar coverage. As a result, it may be more difficult for us to attract and retain qualified individuals to serve on our board of directors or as executive officers.

If securities or industry analysts do not publish research or reports or publish unfavorable research about our business, the price and trading volume of our Class A common stock could decline.

The trading market for our Class A common stock depends in part on the research and reports that securities or industry analysts publish about us or our business. If one or more of the analysts who covers us downgrades our securities, the price of our securities would likely decline. If one or more of these analysts ceases to cover us or fails to publish regular reports on us, interest in the purchase of our securities could decrease, which could cause the price of our Class A common stock and other securities and their trading volume to decline.

If we fail to develop or maintain an effective system of internal controls, we may not be able to accurately report our financial results or prevent fraud. As a result, current and potential stockholders could lose confidence in our financial reporting, which would harm our business and the trading price of our Class A common stock.

Effective internal controls are necessary for us to provide reliable financial reports, prevent fraud and operate successfully as a public company. If we cannot provide reliable financial reports or prevent fraud, our reputation and operating results would be harmed. We cannot be certain that our efforts to develop and maintain our internal controls will be successful, that we will be able to maintain adequate controls over our financial processes and reporting in the future or that we will be able to comply with our obligations under Section 404 of the Sarbanes-Oxley Act. Any failure to develop or maintain effective internal controls, or difficulties encountered in implementing or improving our internal controls, could harm our operating results or cause us to fail to meet our reporting obligations. Ineffective internal controls could also cause investors to lose confidence in our reported financial information, which would likely have a negative effect on the trading price of our Class A common stock.

Natural disasters and unusual weather conditions could disrupt business and result in operational delays and otherwise have an adverse effect on our business.

The occurrence of one or more natural disasters, such as tornadoes, hurricanes, tsunamis, fires, droughts, floods and earthquakes or unusual weather conditions or temperatures in the regions in which our facilities are located could adversely result in delayed operations or repair costs. For example, in February 2021, Texas and New Mexico experienced record-setting cold temperatures from Winter Storm Uri. Proppant volumes were negatively impacted in February and March 2021 as the cold weather delayed completion schedules and pushed forecasted producer activity into the latter half of the year. Events such as this could have an adverse effect on our business and may become more frequent and/or intense as a result of climate change.

A terrorist attack or armed conflict could harm our business.

Global and domestic terrorist activities, anti-terrorist efforts and other armed conflicts involving the United States could adversely affect the U.S. and global economies and could prevent us from meeting financial and other obligations. We could experience loss of business, delays or defaults in payments from payors or disruptions of fuel supplies and markets if pipelines, production facilities, processing plants, refineries or transportation facilities are direct targets or indirect casualties of an act of terror or


79


Table of Contents

war. Such activities could reduce the overall demand for oil and natural gas, which, in turn, could also reduce the demand for our proppant. Global and domestic terrorist activities and the threat of potential terrorist activities and any resulting physical damage and economic downturn could adversely affect our results of operations, impair our ability to raise capital or otherwise adversely impact our ability to realize certain business strategies.


80


Table of Contents

CAUTIONARY NOTE REGARDING FORWARD-LOOKING STATEMENTS

The information in this prospectus includes “forward-looking statements.” All statements, other than statements of historical fact included in this prospectus, regarding our strategy, future operations, financial position, estimated revenues and losses, projected costs, prospects, plans and objectives of management are forward-looking statements. When used in this prospectus, the words “could,” “would,” “believe,” “anticipate,” “intend,” “estimate,” “expect,” “project” and similar expressions are intended to identify forward-looking statements, although not all forward-looking statements contain such identifying words. These forward-looking statements are based on our current expectations and assumptions about future events and are based on currently available information as to the outcome and timing of future events. When considering forward-looking statements, you should keep in mind the risk factors and other cautionary statements described under the section titled “Risk Factors” included in this prospectus. By their nature, forward-looking statements involve known and unknown risks and uncertainties because they relate to events and depend on circumstances that may or may not occur in the future. Although we believe that the forward-looking statements contained in this prospectus are based on reasonable assumptions, you should be aware that many factors could affect our actual financial results or results of operations and could cause actual results to differ materially from those in such forward-looking statements, including but not limited to:


higher than expected costs to operate our Kermit and Monahans facilities and develop the Dune Express;


the amount of proppant we are able to produce, which could be adversely affected by, among other things, operating difficulties and unusual or unfavorable geologic conditions;


the volume of proppant we are able to sell and our ability to enter into supply contracts for our proppant on acceptable terms;


the prices we are able to charge, and the margins we are able to realize, from our proppant sales;


the demand for and price of proppant, particularly in the Permian Basin;


the success of our e-mining transition efforts;


fluctuations in the demand for certain grades of proppant;


the domestic and foreign supply of and demand for oil and natural gas;


changes in the price and availability of natural gas, diesel fuel or electricity that we use as fuel sources for our proppant production facilities and related equipment;


the availability of capital and our liquidity;


the level of competition from other companies;


pending legal or environmental matters;


changes in laws and regulations (or the interpretation thereof) or increased public scrutiny related to the proppant production and oil and natural gas industries, silica dust exposure or the environment;


facility shutdowns in response to environmental regulatory actions;


technical difficulties or failures;


liability or operational disruptions due to pit-wall or pond failure, environmental hazards, fires, explosions, chemical mishandling or other industrial accidents;


health epidemics, such as the ongoing COVID-19 pandemic, natural disasters or inclement or hazardous weather conditions, including but not limited to cold weather, droughts, flooding, tornadoes and the physical impacts of climate change;


81


Table of Contents
   

unanticipated ground, grade or water conditions;


inability to obtain government approvals or acquire or maintain necessary permits or mining, access or water rights;


changes in the price and availability of transportation services;


inability of our customers to take delivery;


difficulty collecting receivables;


the level of completion activity in the oil and natural gas industry;


inability to obtain necessary production equipment or replacement parts;


the amount of water available for processing;


any planned or future expansion projects or capital expenditures;


our ability to finance equipment, working capital and capital expenditures;


inability to successfully grow organically, including through future land acquisitions;


inaccuracies in estimates of volumes and qualities of our frac sand reserves;


failure to meet our minimum delivery requirements under our supply agreements;


material nonpayment or nonperformance by any of our key customers;


development of either effective alternative proppants or new processes that replace hydraulic fracturing;


our ability to borrow funds and access capital markets;


our ability to comply with covenants contained in our debt instruments;


the severity, operational challenges and duration of the ongoing COVID-19 pandemic and efforts to mitigate the spread of the virus, including logistical challenges, protecting the health and well-being of our employees, remote work arrangements, performance of contracts and supply chain disruptions, which have caused economic slowdowns and interruptions to our and our customers’ operations;


the potential deterioration of our customers’ financial condition, including defaults resulting from actual or potential insolvencies;


changes in global political or economic conditions, including sustained inflation and associated changes in monetary policy, both generally and in the markets we serve;


physical, electronic and cybersecurity breaches;


the effects of litigation;


plans, objectives, expectations and intentions contained in this prospectus that are not historical; and


other factors discussed elsewhere in this prospectus including in the section titled “Risk Factors.”

We caution you that these forward-looking statements are subject to all of the risks and uncertainties, most of which are difficult to predict and many of which are beyond our control. These risks include, but are not limited to, the risks described under “Risk Factors” in this prospectus. Should one or more of the risks or uncertainties described in this prospectus occur, or should underlying assumptions prove incorrect, our actual results and plans could differ materially from those expressed in any forward-looking statements.


82


Table of Contents

All forward-looking statements, expressed or implied, included in this prospectus are expressly qualified in their entirety by this cautionary statement. This cautionary statement should also be considered in connection with any subsequent written or oral forward-looking statements that we or persons acting on our behalf may issue. Except as otherwise required by applicable law, we disclaim any duty to update any forward-looking statements, all of which are expressly qualified by the statements in this section, to reflect events or circumstances after the date of this prospectus.


83


Table of Contents

USE OF PROCEEDS

We estimate that our net proceeds from this offering, based on an assumed initial public offering price of $                 per share of Class A common stock (the midpoint of the price range set forth on the cover of this prospectus), after deducting estimated underwriting discounts and commissions and estimated offering expenses payable by us, will be approximately $                 million, or approximately $                 million if the underwriters’ option to purchase additional shares of Class A common stock is exercised in full.

Each $1.00 increase or decrease in the assumed initial public offering price of $                 per share of Class A common stock (the midpoint of the price range set forth on the cover of this prospectus) would increase or decrease the net proceeds to us from this offering by approximately $                 million (or approximately $                 million if the underwriters’ option to purchase additional shares of Class A common stock is exercised in full), assuming that the number of shares of Class A common stock offered by us, as set forth on the cover page of this prospectus, remains the same and after deducting estimated underwriting discounts and commissions and estimated offering expenses payable by us. Similarly, each increase or decrease of one million in the number of shares of Class A common stock offered by us would increase or decrease the net proceeds to us from this offering by approximately $                 million (or approximately $                 million if the underwriters’ option to purchase additional shares of Class A common stock is exercised in full), assuming no change in the assumed initial public offering price of $                 per share and after deducting estimated underwriting discounts and commissions and estimated offering expenses payable by us.

The principal purposes of this offering are to help fund our current growth initiatives, create a public market for our Class A common stock, and facilitate our future access to the capital markets. We intend to contribute all of the net proceeds of this offering to Atlas Operating in exchange for Atlas Units, and Atlas Operating will further contribute the net proceeds received to Atlas LLC. Atlas LLC will, in turn, use:


approximately $                 million of the net proceeds of this offering to fund the construction of the Dune Express; and


approximately $                 million of the net proceeds of this offering to fund general corporate purposes.

We do not currently intend to use any of the net proceeds from this offering to make payments in connection with the Redemption Right or Call Right.

The expected use of net proceeds from this offering represents our intentions based upon our present plans and business conditions. We cannot predict with certainty all of the particular uses for the proceeds of this offering or the amounts that we will actually spend on the uses set forth above. Accordingly, our management will have significant flexibility in applying the net proceeds of this offering. The timing and amount of our actual expenditures will be based on many factors, including cash flows from operations and the anticipated growth of our business.


84


Table of Contents

DIVIDEND POLICY

We commenced paying cash distributions in December 2021 and, as of January 31, 2023, have paid $70.0 million in aggregate distributions to our unitholders since that time. We intend to continue to recommend to our board of directors that we regularly return capital to our stockholders in the future through a dividend framework that will be communicated to stockholders in the future. Following completion of this offering, our board of directors may elect to declare cash dividends on our Class A common stock, subject to our compliance with applicable law, and depending on, among other things, our financial condition, results of operations, projections, liquidity, earnings, legal requirements, and restrictions in the agreements governing our indebtedness (as further discussed herein). The payment of any future dividends will be at the discretion of our board of directors, which will be constituted upon completion of this offering and be comprised of a majority of independent directors, from time to time. Please see “Risk Factors—Risks Related to Our Financial Condition—Our indebtedness could adversely affect our financial flexibility and our competitive position.”

Our ability to pay any dividends depends on our receipt of cash dividends from our operating subsidiaries, which may further restrict our ability to pay dividends as a result of the laws of their jurisdiction of organization, agreements of our subsidiaries or covenants under any existing and future outstanding indebtedness we or our subsidiaries incur.

Our ABL Credit Agreement generally permits Atlas LLC to pay distributions to us, if (i) no Event of Default (as defined in the ABL Credit Agreement) exists or would occur as a result of making a distribution, and (ii) Atlas LLC’s Availability (as defined in the ABL Credit Agreement) would be in excess of the greater of (a) $12.0 million or (b) 20% of the Borrowing Base (as defined in the ABL Credit Agreement) immediately after giving pro forma effect to such distribution. If Availability is less than these levels then our ability to pay distributions is either limited or is contingent on our ability to satisfy certain conditions such as a fixed charge coverage ratio.

Our 2021 Term Loan Credit Facility generally permits Atlas LLC to pay distributions to us if (i) no Event of Default has occurred and is continuing and (ii) immediately after giving pro forma effect thereto, (a) Atlas LLC’s Cash and Cash Equivalents (as defined in the 2021 Term Loan Credit Facility) is greater than or equal to $30.0 million, and (b) Atlas LLC’s Annualized Leverage Ratio (as defined in the 2021 Term Loan Credit Facility) is less than 2.00x. Concurrently with any such distribution, Atlas LLC is required to make a Related Paydown (as defined in the 2021 Term Loan Credit Facility) of the Term Loan based on the pro forma Leverage Ratio (as defined in the 2021 Term Loan Credit Facility). If the Leverage Ratio on a pro forma basis immediately after giving effect to such distribution would be greater than 1.25x, then Atlas LLC is required to make a Related Paydown of the Term Loan in an amount equal to one-third (1/3) of such distribution and if the Leverage Ratio on a pro forma basis immediately after giving effect to such distribution would be less than or equal to 1.25x, then Atlas LLC is required to make a Related Paydown of the Term Loan in an amount equal to one-fourth (1/4) of such distribution. If Cash and Cash Equivalents is less than $30.0 million or the Annualized Leverage Ratio is greater than or equal to 2.00x, then our ability to pay distributions may be limited. Notwithstanding these limitations, our Term Loan Facility also permits Atlas LLC to make Permitted Payments (as defined in the 2021 Term Loan Credit Facility) and to pay distributions to us following completion of this offering in an amount per year not to exceed 10.00% of the aggregate net proceeds received from this offering and contributed to Atlas LLC.

We will be a holding company upon the completion of this offering, and will have no material assets other than our ownership of Atlas Units. As a consequence, our ability to declare and pay dividends to the holders of our Class A common stock will be subject to the ability of Atlas Operating to provide distributions to us. The ability of our subsidiaries to make distributions to Atlas Operating depends upon the amount of cash they generate from their operations and the restrictions contained in


85


Table of Contents

our credit facilities and such subsidiaries’ governing documents. If Atlas Operating makes such distributions, the Legacy Owners holding Atlas Units will be entitled to receive equivalent distributions from Atlas Operating on a pro rata basis. However, because Atlas Inc. must pay taxes, amounts ultimately distributed as dividends to holders of our Class A common stock are expected to be less on a per share basis than the amounts distributed by Atlas Operating to such Legacy Owners on a per unit basis. For additional information, please see “Risk Factors—Risks Related to this Offering and Our Class A Common Stock and Organizational Structure—We are a holding company. Our sole material asset after completion of this offering and our corporate reorganization will be its equity interest in Atlas Operating, and we will accordingly be dependent upon cash distributions from Atlas Operating to cover our taxes and corporate and overhead expenses, among other expenses.”

Assuming Atlas Operating makes distributions to Atlas Inc. and the Legacy Owners holding Atlas Units in any given year, the determination to pay dividends, if any, in respect of our Class A common stock out of the portion, if any, of such distributions remaining after our payment of taxes and our expenses (any such portion, an “excess distribution”) will be made by our board of directors. Because our board of directors may determine to pay or not pay dividends in respect of shares of our Class A common stock, our holders of Class A common stock may not necessarily receive dividend distributions relating to excess distributions, even if Atlas Operating makes such distributions to us.


86


Table of Contents

CAPITALIZATION

The following table sets forth the consolidated cash, cash equivalents and capitalization as of December 31, 2022, as follows:


of Atlas LLC on an actual basis;


of Atlas Inc. on a pro forma basis to give effect to the transactions described under “Corporate Reorganization”; and


of Atlas Inc. adjusted to give pro forma effect to (i) the transactions described under “Corporate Reorganization,” (ii) the sale of shares of our Class A common stock in this offering at the assumed initial offering price of $                 per share (the midpoint of the price range set forth on the cover of this prospectus) and the application of the net proceeds therefrom as described under the section titled “Use of Proceeds” and (iii) the repayment in full of the 2018 ABL Credit Facility and entrance into the 2023 ABL Credit Facility in February 2023.

The table below should be read in conjunction with, and is qualified in its entirety by reference to the section titled “Management’s Discussion and Analysis of Financial Condition and Results of Operations” and the historical condensed consolidated financial information of our Predecessor and our pro forma financial information for the periods and as of the dates indicated.


     As of December 31, 2022  
     Atlas LLC(1)      Pro Forma
Atlas Inc.
     Pro Forma
as adjusted
Atlas Inc.(2)
 
     (In thousands, except number
of shares)
 

Cash and cash equivalents

   $ 82,010      $                    $                


Total debt:


2018 ABL Credit Facility(3)

   $ 148,995      $        $ —    

2021 Term Loan Credit Facility

   $ 148,995        

2023 ABL Credit Facility(3)

   $          

Total debt

   $ 148,995      $        $    

Members’ / stockholders’ equity:


Members’ / stockholders’ equity

   $ 511,357      $        $    

Class A common stock, $0.01 par value; no shares authorized, issued or outstanding (actual);             shares authorized,             shares issued and outstanding (as adjusted)


Class B common stock, $0.01 par value, no shares authorized, issued or outstanding (actual);             shares authorized,             shares issued and outstanding (as adjusted)


Additional paid-in capital


Non-controlling interests


Total members’ / stockholders’ equity

   $                      $        $  


Total capitalization

   $        $        $    


(1)

Atlas LLC was formed in April 2017. The data in this table has been derived from the historical consolidated financial statements included in this prospectus which pertain to the assets, liabilities, revenues and expenses of our accounting predecessor.

(2)

A $1.00 increase (decrease) in the assumed initial public offering price of $                 per share, which is the midpoint of the price range set forth on the cover page of this prospectus, would


87


Table of Contents
  increase (decrease) the as adjusted additional paid-in capital, total members’ / stockholders’ equity and total capitalization by approximately $                 million, $                 million and $                 million, respectively, assuming that the number of shares offered by us, as set forth on the cover page of this prospectus, remains the same, after deducting the estimated underwriting discounts and commissions payable by us. We may also increase (decrease) the number of shares we are offering. An increase (decrease) of one million shares offered by us at the assumed initial public offering price of $                 per share, which is the midpoint of the price range set forth on the cover page of this prospectus, would increase (decrease) the as adjusted additional paid-in capital, total members’/stockholders’ equity and total capitalization by approximately $                 million, $                 million and $                 million, respectively, after deducting the estimated underwriting discounts and commissions and estimated offering expenses payable by us.
(3)

As of December 31, 2022, the 2018 ABL Credit Facility included undrawn letters of credit in the amount of $1.1 million. On February 22, 2023, the 2018 ABL Credit Facility was repaid in full, and the Company entered into the 2023 ABL Credit Facility. As of February 23, 2023, no amounts are outstanding under the 2023 ABL Credit Facility.


88


Table of Contents

DILUTION

Purchasers of the Class A common stock in this offering will experience immediate and substantial dilution in the net tangible book value per share of the Class A common stock for accounting purposes. Our as adjusted net tangible book value as of December 31, 2022, after giving pro forma effect to the transactions described under the section titled “Corporate Reorganization,” was approximately $                 million, or $                 per share of Class A common stock. Pro forma net tangible book value per share is determined by dividing our pro forma tangible net worth (tangible assets less total liabilities) by the total number of outstanding shares of Class A common stock (assuming that 100% of Atlas Units have been redeemed for Class A common stock) that will be outstanding immediately prior to the closing of this offering, including giving effect to our corporate reorganization. After giving effect to the sale of the shares in this offering and further assuming the receipt of the estimated net proceeds from this offering (after deducting estimated underwriting discounts and commissions and estimated offering expenses), our pro forma as adjusted net tangible book value as of December 31, 2022 would have been approximately $                 million, or $                 per share. This represents an immediate decrease in the net tangible book value of $                 per share to the Legacy Owners and an immediate dilution (i.e., the difference between the offering price and the as adjusted net tangible book value after this offering) to new investors of $                 per share. The following table illustrates the per share dilution to new investors (assuming that 100% of Atlas Units have been redeemed for Class A common stock):


Initial public offering price per share of Class A common stock

   $                    

As adjusted net tangible book value per share of Class A common stock as of December 31, 2022 (after giving pro forma effect to our corporate reorganization as described above)

   $    
  

Decrease per share of Class A common stock attributable to this offering and related transactions as described above


Pro forma as adjusted net tangible book value per share of Class A common stock (after giving further effect to this offering and related transactions as described above)


Dilution in pro forma as adjusted net tangible book value per share of Class A common stock to new investors

   $    


The dilution information discussed above is illustrative only and will change based on the actual public offering price and other terms of this offering to be determined at pricing. A $1.00 increase (decrease) in the assumed initial public offering price of $         per share, which is the midpoint of the price range set forth on the cover page of this prospectus, would increase (decrease) the pro forma as adjusted net tangible book value per share by approximately $         million, or by approximately $         per share, assuming the number of shares offered by us, as set forth on the cover page of this prospectus, remains the same, after deducting estimated underwriting discounts and commissions and estimated offering expenses payable by us. Similarly, an increase (decrease) of one million in the number of shares offered by us would increase (decrease) the pro forma as adjusted net tangible book value per share by approximately $         million, or approximately $         per share, assuming the assumed public offering price remains the same, after deducting estimated underwriting discounts and commissions and estimated offering expenses payable by us.

The following table summarizes, on an as adjusted basis as of December 31, 2022, the total number of shares of Class A common stock owned by the Legacy Owners (assuming that 100% of our Class B common stock and Atlas Units have been redeemed for Class A common stock) and to be owned by new investors, the total consideration paid, and the average price per share paid by the Legacy Owners and to be paid by new investors in this offering at our initial offering price of $                


89


Table of Contents

per share, calculated before deduction of estimated underwriting discounts and commissions and estimated offering expenses payable by us.


     Shares Acquired     Total Consideration     Average Price
Per Share
 
     Number      Percent     Amount      Percent  

Legacy Owners

                                $                             $                

New investors in this offering


Total

        100.0   $          100.0   $    


The above table and discussion are based on the number of shares of our Class A common stock and Class B common stock to be outstanding as of the closing of this offering. The table does not reflect                  shares of Class A common stock reserved for issuance under our LTIP, which we intend to adopt in connection with the completion of this offering.

If the underwriters’ option to purchase additional shares is exercised in full, the number of shares held by new investors will be increased to                 , or approximately     % of the total number of shares of our Class A common stock.


90


Table of Contents

MANAGEMENT’S DISCUSSION AND ANALYSIS OF FINANCIAL CONDITION AND RESULTS OF OPERATIONS

The following discussion and analysis should be read in conjunction with the section titled “Summary—Summary Historical and Pro Forma Financial and Operating Data” and the financial statements and related notes appearing elsewhere in this prospectus. This discussion contains “forward-looking statements” reflecting our current expectations, estimates and assumptions concerning events and financial trends that may affect our future operating results or financial position. Actual results and the timing of events may differ materially from those contained in these forward-looking statements due to a number of factors. Factors that could cause or contribute to such differences include, but are not limited to, market prices for oil and natural gas, capital expenditures, economic and competitive conditions, regulatory changes and other uncertainties, as well as those factors discussed below and elsewhere in this prospectus, particularly in the sections titled “Risk Factors” and “Cautionary Note Regarding Forward-Looking Statements,” all of which are difficult to predict. In light of these risks, uncertainties and assumptions, the forward-looking events discussed may not occur. We assume no obligation to update any of these forward-looking statements except as otherwise required by applicable law.

Overview

We are a leading provider of proppant and logistics services to the oil and natural gas industry within the Permian Basin of West Texas and New Mexico, the most active oil and natural gas basin in North America. Our core mission is to maximize value for our stockholders by generating strong cash flow and allocating our capital resources efficiently, including providing a regular and durable return of capital to our investors through industry cycles. In our pursuit of this mission, we deploy innovative techniques and technologies to develop our high-quality resource base and efficiently deliver our products to customers through leading-edge logistics solutions. We believe that our uniquely-positioned asset base and our differentiated approach are distinct competitive advantages that make us a more reliable supplier than our competitors. We believe we have developed a strong brand recognition for reliability and strong customer service that has enabled us to increase the volume of proppant sold every year since the founding of the Company in 2017.

Our unique assets and market positioning, along with our innovation and demonstrated reliability, enables us to expand our business beyond proppant sales. We are launching a transformational logistics offering that we believe will bring a step change in efficiency, safety and sustainability benefits to the Permian Basin. This will include the “Dune Express,” an overland conveyor infrastructure solution, which, coupled with our fleet of fit-for-purpose trucks and trailers, we anticipate will remove a significant number of trucks from public roadways within the Permian Basin.

The Dune Express will be the first long-haul overland conveyor system to deliver proppant. We have secured the contiguous right-of-way for our initial system, which is expected to follow a 42-mile-long route from our facilities into the heart of the prolific Northern Delaware Basin. The Dune Express will significantly shorten the distance that proppant needs to travel by truck, which is expected to provide meaningful productivity gains while decreasing emissions. We expect the Dune Express to make public roadways safer by removing trucks from public roadways, thus reducing traffic, accidents and fatalities on public roadways in the region.

Our supplying partners are currently manufacturing fit-for-purpose equipment for our trucking fleet to be used in our existing logistics business. We have designed our trucking operations and delivery processes to significantly expand the daily payload capacity per truck compared to traditional assets. We believe these fit-for-purpose assets with expanded payload capacity are already driving


91


Table of Contents

productivity gains since their deployment in January 2023, and will continue to do as we build our fleet. Our long-term goal is to bring autonomous wellsite delivery to the Permian Basin, which we expect to drive further productivity gains as the technology is developed over the next several years.

Each of these solutions independently represents a significant leap forward in the logistics space. Combined, we believe that our logistics offering will bring substantial benefits to our customers, investors and the local community in the Permian Basin. The relocation of commercial traffic from public roads to private roads creates a dynamic closed-loop system that is well suited for the rapid deployment and advancement of our trucking fleet, while also increasing the mobility and safety of the public roadways for the residents of the region.

According to Lium Research, Permian Basin proppant demand currently exceeds in-basin production capacity and third-party research indicates that this supply shortage has the potential to grow significantly. In 2022, while Permian operators accelerated completions, they also maintained a healthy drilled uncompleted (“DUC”) well inventory at approximately 94% of the 2018–2022 average. Furthermore, Lium Research estimated that Permian operators would spend approximately $42.8 billion in 2022 with spending levels estimated to be approximately 50% higher in 2024, signaling for a significant and continued increase in completions activity. In response to this supply shortage, we are in the process of adding a facility capable of 5.0 million tons of annual production capacity at our location in Kermit, Texas, and we anticipate that construction will be completed by the end of 2023. Due to the robust levels of industry demand for our product, our existing facilities are currently sold out, our contracted volumes continue to grow, and we are both extending term and adding logistics contracts to our portfolio. The modular design of our existing facilities and the size of our resource base provide us with the ability to further expand our production footprint to meet future market demand, should we determine that the potential investment enhances our long-term profitability and free cash flow profile.

Market Conditions, Operational Trends and Outlook

Increasing global economic activity, from historic lows brought about by the COVID-19 pandemic, has supported a higher oil and natural gas price environment. As the global demand for hydrocarbons has returned to pre-pandemic levels, historically low levels of capital investment into the oil and natural gas industry over the preceding two years, has led to significant supply imbalances as the supply of oil and natural gas has not kept pace with growing global demand. Russia’s invasion of Ukraine has further exacerbated the tightness in the markets for oil and natural gas.

Oil and natural gas prices experienced some volatility during the third quarter of 2022 as global oil demand continued to decelerate, weighed down by a worsening economic outlook and fears of recession; however, robust oil use for power generation in the Middle East and Europe provided a partial offset to the softening in global oil demand. Russia’s invasion of Ukraine and its effects on commodity markets, supply chains, inflation and financial conditions have added uncertainty to future global economic activity and global oil demand. The price for West Texas Intermediate (“WTI”) crude oil declined by more than $31.07 per barrel during the period, largely fueled by a broader equities markets sell off, before ending the period at $81.54 per barrel.

The slowdown in global oil demand has been significantly offset by critically low global oil inventories, which have been exacerbated by global Russian oil embargos and regulatory changes affecting the oil industry in certain non-OPEC countries. In addition, Saudi Arabia announced production cuts by upwards of two million barrels per day, starting in November 2022, while domestically, U.S. hydrocarbon producers remain prudent with their capital budgets and have not increased production to levels seen prior to the pandemic. As the market continues to price in these dynamics, we expect the price of WTI to remain at elevated levels.


92


Table of Contents

This supply and demand imbalance has led to a higher oil and natural gas price environment which in turn has prompted Permian Basin operators to prudently increase activity levels with the Permian Basin ending the period with 328 active horizontal rigs.

As a result of the increase in drilling and completions activity in the Permian Basin, we have seen a significant tightening in the Permian Basin proppant market, where proppant demand is presently at an all-time high. While the available Permian Basin proppant supply stack has returned to pre-pandemic levels, there remains a significant undersupply which has led to strong increases in the spot price market for proppant. While Atlas has significantly benefited from the tightness in the market, as evidenced through our ability to secure several long-term fixed contracts, there remains a growing deficit in sand supply to forecasted demand levels.

In addition to increased industry activity levels, we expect to benefit from increased horizontal drilling as well as other long-term macro industry trends that improve drilling economics such as (i) greater rig efficiencies that result in more wells drilled per rig and (ii) enhanced well completion designs, including higher proppant usage per well.

Russia’s invasion of Ukraine and the limitations of renewables to provide a consistent supply of energy has increased both the cost of energy and the risk of energy supply disruptions. As such, we believe there exists a significant and unique opportunity to put strategic capital to work to address these concerns. To that end, Atlas has been investing in (i) significant capital projects that will address the growing demand for proppant as shale producers look to meet the growing global oil demand and (ii) new disruptive technologies (i.e., the Dune Express and autonomous wellsite delivery) that will both provide meaningful environmental benefits but also increase oilfield efficiencies, further driving growth that we believe will generate a positive community and environmental impact.

We believe these supportive tailwinds within the industry will continue. Atlas remains focused on positively disrupting the oilfield services space through the implementation of innovative technologies and will continue to capitalize on the growing market opportunity to benefit both our stockholders over the long term.

How We Generate Revenue

We generate revenue by mining, processing and distributing proppant that our customers use in connection with their operations. We sell proppant to our customers under supply agreements or as spot sales at prevailing market rates, which is dependent upon the cost of producing proppant, the proppant volumes sold and the desired margin and prevailing market conditions.

In some instances, revenues also include charges for sand logistics services provided to our customers. Our logistics service revenue fluctuates based on several factors, including the volume of proppant transported and the distance between our facilities and our customers. Revenue is generally recognized as products are delivered in accordance with the contract.

Some of our contracts contain shortfall provisions that calculate agreed upon fees that are billed when the customer does not satisfy the minimum purchases over a period of time defined in each contract.

As of December 31, 2022, our Kermit and Monahans production facilities have a total combined annual production capacity of 10.0 million tons.

Costs of Conducting our Business

We incur operating costs primarily from direct and indirect labor, freight charges, utility costs, fuel and maintenance costs and royalties. We incur labor costs associated with employees at our Kermit


93


Table of Contents

and Monahans facilities, which represent the most significant cost of converting proppant to finished product. We may incur variable freight charges from trucking companies related to our delivery of sand to customer wellsites. Our Kermit and Monahans facilities undergo maintenance to minimize unscheduled downtime and ensure the ongoing quality of our proppant and ability to meet customer demands. We may incur variable utility costs in connection with the operation of our processing facilities, primarily natural gas and electricity, which are both susceptible to market fluctuations. We lease equipment in many areas of our operations including our proppant production hauling equipment. We incur variable royalty expense and/or delay rentals related to our agreements with the owners of our reserves. In addition, other costs including overhead allocation, depreciation and depletion are capitalized as a component of inventory and are reflected in cost of goods sold when inventory is sold.

How We Evaluate Our Operations

Our management uses a variety of financial and operating metrics to evaluate and analyze the performance of our business, including Adjusted EBITDA, Adjusted EBITDA Margin, Adjusted Free Cash Flow, Adjusted EBITDA less Capital Expenditures, Adjusted Free Cash Flow Margin, Adjusted EBITDA less Capital Expenditures Margin, Adjusted Free Cash Flow Conversion, Contribution Margin and Net Debt.

Adjusted EBITDA, Adjusted EBITDA Margin, Adjusted Free Cash Flow, Adjusted EBITDA less Capital Expenditures, Adjusted Free Cash Margin, Adjusted EBITDA less Capital Expenditures Margin, Adjusted Free Cash Flow Conversion, Contribution Margin and Net Debt are non-GAAP supplemental financial measures used by our management and by external users of our financial statements such as investors, research analysts and others, in the case of Adjusted EBITDA, to assess our operating performance on a consistent basis across periods by removing the effects of development activities, provide views on capital resources available to organically fund growth projects and, in the case of Adjusted Free Cash Flow and Adjusted EBITDA less Capital Expenditures, assess the financial performance of our assets and their ability to sustain dividends over the long term without regard to financing methods, capital structure, levels of reinvestment or historical cost basis.

We define Adjusted EBITDA as net income (loss) before depreciation, depletion and accretion, interest expense, net, income tax expense, expense related to workforce reduction, impairment of long-lived assets, unit-based compensation, loss on disposal of property, plant and equipment, gain (loss) on extinguishment of debt and unrealized commodity derivative gain (loss). Management believes Adjusted EBITDA is useful because it allows them to more effectively evaluate our operating performance and compare the results of our operations from period to period and against our peers without regard to our financing methods or capital structure. We exclude the items listed above from net income in arriving at Adjusted EBITDA because these amounts can vary substantially from company to company within our industry depending upon accounting methods and book values of assets, capital structures and the method by which the assets were acquired.

We define Adjusted EBITDA Margin as Adjusted EBITDA divided by total sales.

We define Adjusted Free Cash Flow as Adjusted EBITDA less maintenance capital expenditures. We define Adjusted EBITDA less Capital Expenditures as Adjusted EBITDA less Net Cash Used in Investing Activities. We believe that Adjusted Free Cash Flow and Adjusted EBITDA less Capital Expenditures are useful to investors as it provides a measure to of the ability of our business to generate cash, which can be used to pay dividends, capital expenditures or debt repayment.

We define Adjusted Free Cash Flow Margin as Adjusted Free Cash Flow divided by total sales.


94


Table of Contents

We define Adjusted EBITDA less Capital Expenditures Margin as Adjusted EBITDA less Capital Expenditures divided by total sales.

We define Adjusted Free Cash Flow Conversion as Adjusted Free Cash Flow divided by Adjusted EBITDA.

We define Contribution Margin as gross profit plus depreciation, depletion and accretion expense.

We define Maintenance Capital Expenditures as capital expenditures excluding growth capital expenditures.

We define Net Debt as total debt, net of discount and deferred financing costs, plus discount and deferred financing costs, plus right-of-use lease liabilities, less cash and cash equivalents.

Adjusted EBITDA, Adjusted EBITDA Margin, Adjusted Free Cash Flow, Adjusted EBITDA less Capital Expenditures, Adjusted Free Cash Flow Margin, Adjusted EBITDA less Capital Expenditures Margin, Adjusted Free Cash Flow Conversion, Contribution Margin and Net Debt do not represent and should not be considered alternatives to, or more meaningful than, net income, income from operations, cash flows provided by operating activities or any other measure of financial performance presented in accordance with generally accepted accounting principles in the United States of America (“GAAP”) as measures of our financial performance. Adjusted EBITDA, Adjusted Free Cash Flow and Adjusted EBITDA less Capital Expenditures have important limitations as analytical tools because they exclude some but not all items that affect net income, the most directly comparable GAAP financial measure. Our computation of Adjusted EBITDA, Adjusted EBITDA Margin, Adjusted Free Cash Flow, Adjusted Free Cash Flow Margin, Adjusted EBITDA less Capital Expenditures, Adjusted EBITDA less Capital Expenditures Margin, Adjusted Free Cash Flow Conversion, Contribution Margin and Net Debt may differ from computations of similarly titled measures of other companies.

Adjusted EBITDA, Adjusted EBITDA Margin, Adjusted Free Cash Flow, Adjusted EBITDA less Capital Expenditures, Adjusted Free Cash Flow Margin, Adjusted EBITDA less Capital Expenditures Margin, and Adjusted Free Cash Flow Conversion are non-GAAP supplemental financial measures used by our management and external users of our financial statements such as investors, research analysts and others, in the case of Adjusted EBITDA, to assess the financial performance of our assets and their ability to sustain dividends over the long term without regard to financial methods, capital structure or historical cost basis, and, in the case of Adjusted Free Cash Flow and Adjusted EBITDA less Capital Expenditures, to assess our operating performance on a consistent basis across periods by removing the effects of development activities.

Factors Affecting the Comparability of Our Results of Operations

COVID-19

In March 2020, the World Health Organization categorized the outbreak of COVID-19 as a pandemic. The COVID-19 pandemic has led to significant economic disruption globally, including in the areas of the United States in which we operate. Governmental authorities took actions to limit the spread of COVID-19 through travel restrictions and stay-at-home orders, which caused many businesses to adjust, reduce or suspend activities. Concerns about global economic growth, as well as uncertainty regarding the timing, pace and extent of an economic recovery in the United States and abroad, have had a significant adverse impact on commodity prices and financial markets. COVID-19 cases in the United States have decreased from their highest levels and vaccines are being distributed, but additional uncertainty remains regarding the timing, pace and extent of an economic recovery in the United States.


95


Table of Contents

Beginning in March 2020, we took action to protect the health and safety of our workers, while continuing to operate, and to maintain the safety and integrity of, our assets. Where possible, our employees have worked remotely to support our business. Where continuous remote work was not possible, we implemented strategies to reduce the likelihood of spreading the disease. In compliance with Center for Disease Control guidance, these strategies include requiring sick employees to stay home, implementing policies and practices for social distancing and wearing cloth face coverings, educating employees about steps they can take to protect themselves at work and at home, performing enhanced cleaning and disinfecting, limiting non-essential travel, and minimizing meetings and gatherings.

COVID-19 contributed to a significant downturn in oil and natural gas commodity prices, and we experienced a corresponding drop in activity levels from our customers in the Permian Basin in 2020. We took action to reduce operating and general and administrative expenses while maintaining safe and reliable performance of our systems. We anticipate that these cost improvements are sustainable and will continue to benefit us in the future. We also expect a significant recovery in operator activity levels as the impact of COVID-19 diminishes and commodity prices continue to recover. However, we are unable to predict the future impact of COVID-19, and it is possible that such impact could be negative. For more information on the risks relating to COVID-19, please read the risks under the section titled “Risk Factors”, including “Risk Factors—Risks Related to Our Business and Operations—Our business and results of operations have been adversely affected by, and may again in the future be adversely affected by, the ongoing COVID-19 pandemic.”

Long-Term Incentive Plan

In order to incentivize management members following the completion of this offering, we anticipate that our board of directors will adopt a LTIP for employees and directors prior to the completion of this offering. Our principal executive officer and our next two most highly compensated executive officers (our “Named Executive Officers”) will be among those eligible to participate in this plan, which will become effective upon the consummation of this offering. We anticipate that the LTIP will provide for the grant of options, stock appreciation rights, restricted stock, restricted stock units, stock awards, dividend equivalents, other stock-based awards, cash awards, substitute awards and performance awards intended to align the interests of employees, directors and service providers with those of our stockholders. As such, our historical financial data may not present an accurate indication of what our actual results would have been if we had implemented the LTIP program prior to the periods presented within.

Income Taxes

Atlas Inc. is a corporation and will be subject to U.S. federal, state and local income taxes. Although the Predecessor is subject to franchise tax in the State of Texas (at less than 1% of modified pre-tax earnings), it is and historically has been treated as a pass-through entity for U.S. federal and other state and local income tax purposes, and as such is and was generally not subject to U.S. federal income taxes or other state or local income taxes. Rather, the tax liability with respect to the taxable income of the Predecessor is and was passed through to its owners. Accordingly, the financial data attributable to Predecessor contains no provision for U.S. federal income taxes or income taxes in any state or locality (other than franchise tax in the State of Texas). We estimate that we will be subject to U.S. federal, state and local taxes at a blended statutory rate of approximately 21.75% (plus any applicable state income tax) of pre-tax earnings, based upon the federal statutory rate of 21%, plus Texas franchise tax rate of 0.75%.

Atlas Inc. accounts for income taxes under the asset and liability method. Under this method, deferred tax assets and liabilities are recognized for the estimated future tax consequences attributable to differences between the financial statement carrying amounts of existing assets and liabilities and


96


Table of Contents

their respective tax basis. Deferred tax assets and liabilities are measured using enacted tax rates in effect for the year in which those temporary differences are expected to be recovered or settled pursuant to the provisions of Accounting Standards Codification (“ASC”) 740, Income Taxes. The effect on deferred tax assets and liabilities of a change in tax rate is recognized in earnings in the period that includes the enactment date. Valuation allowances are established when necessary to reduce deferred tax assets to the amounts more likely than not to be realized.

We expect to record a full valuation allowance on our net deferred tax assets based on our assessment that it is more likely than not that the deferred tax asset will not be realized. A change in these assumptions could cause a decrease to the valuation allowance, which could materially impact our results of operations.

Results of Operations


     Predecessor  
     For the Year Ended December 31,  
     2022     2021     2020  
     (in thousands)  

Product sales

   $ 408,446     $ 142,519     $ 80,527  

Service sales

     74,278       29,885       31,245  


Total sales

     482,724       172,404       111,772  

Cost of sales (excluding depreciation, depletion and accretion expense)

     198,918       84,656       73,118  

Depreciation, depletion and accretion expense

     27,498       23,681       20,887  


Gross profit

     256,308       64,067       17,767  

Selling, general and administrative expense

     24,317       17,071       17,743  

Impairment of long-lived assets

     —         —         1,250  


Operating income (loss)

     231,991       46,996       (1,226

Interest expense, net

     (15,760     (42,198     (32,819

Other income (loss)

     2,631       291       (25

Income tax expense

     (1,856     (831     (372


Net income (loss)

   $ 217,006     $ 4,258     $ (34,442


Year Ended December 31, 2022 Compared To Year Ended December 31, 2021

Product Sales.     Product sales increased by $265.9 million to $408.4 million for the year ended December 31, 2022, as compared to $142.5 million for the year ended December 31, 2021. An increase in proppant prices between the periods contributed to a $233.1 million positive impact, while an increase in sales volume contributed a $32.8 million positive impact.

Service Sales.     Services sales, which includes freight for last-mile logistics services, increased by $44.4 million to $74.3 million for the year ended December 31, 2022, as compared to $29.9 million for the year ended December 31, 2021. The increase in logistics revenue was due to higher sales volumes shipped to last-mile logistics customers.

Cost of sales (excluding depreciation, depletion and accretion expense).     Cost of sales (excluding depreciation, depletion and accretion expense) increased by $114.2 million to $198.9 million for the year ended December 31, 2022, as compared to $84.7 million for the year ended December 31, 2021. Cost of sales (excluding depreciation, depletion and accretion) related to product sales increased by $73.0 million due to higher sales volumes, which increased costs for utilities, maintenance, royalties and transition costs related to purchase of dredge equipment, requiring temporary usage of traditional mining rental equipment.


97


Table of Contents

Cost of sales (excluding depreciation, depletion and accretion expense) related to services increased by $41.2 million due to higher sales volumes shipped to last-mile logistics customers during the period.

Depreciation, depletion and accretion expense.     Depreciation, depletion and accretion expense increased by $3.8 million to $27.5 million for the year ended December 31, 2022, as compared to $23.7 million for the year ended December 31, 2021. The increase in depreciation, depletion and accretion expense is due to increased units of production depletion due to higher sand production and additional depreciable assets placed into service when compared to the prior period.

Selling, general and administrative expense.     Selling, general and administrative expense increased by $7.2 million to $24.3 million for the year ended December 31, 2022, as compared to $17.1 million for the year ended December 31, 2021. The increase is primarily due to an increase of $5.1 million of employee costs, including an increase of $0.6 million of unit-based compensation expense, and $2.1 million of travel, sales and other corporate expenses associated with increased opportunities to conduct commercial business development efforts in person during the year ended December 31, 2022, compared to the year ended December 31, 2021.

Our selling, general and administrative expenses include the non-cash expense for unit-based compensation for equity awards granted to our employees. For the year ended December 31, 2022, unit-based compensation expense was $0.7 million, as compared to $0.1 million of unit-based compensation expense for the year ended December 31, 2021.

Interest expense, net.     Interest expense, net decreased by $26.4 million to $15.8 million for the year ended December 31, 2022, as compared to $42.2 million for the year ended December 31, 2021. The decrease is primarily due to the recognition of a loss on extinguishment of debt of $16.4 million resulting from the recognition of unamortized debt discount and deferred financing costs of $11.9 million and a make-whole premium of $4.5 million paid upon redemption of the 2018 Term Loan Credit Facility during the year ended December 31, 2021. This decrease was partially offset by the recognition of gain on extinguishment of debt of $4.5 million due to the forgiveness of the SBA Paycheck Protection Program Loan and the related accrued interest expense during the year ended December 31, 2021. The remaining decrease is due to the outstanding 2021 Term Loan Credit Facility, which accrued $14.0 million of interest expense and $0.7 million of amortization of debt discount and deferred financing costs during the year ended December 31, 2022, as compared to the 2018 Term Loan Credit Facility and 2021 Term Loan Facility, which accrued $22.0 million of interest expense and $7.7 million of amortization of debt discount and deferred financing costs during the year ended December 31, 2021.

Income tax expense.     Income tax expense increased by $1.1 million to $1.9 million for the year ended December 31, 2022, as compared to $0.8 million for the year ended December 31, 2021. The increase is primarily due to increased revenues, which increased our liability related to Texas franchise taxes.

Year Ended December 31, 2021 Compared To Year Ended December 31, 2020

Product Sales.      Product sales increased by $62.0 million to $142.5 million for the year ended December 31, 2021, as compared to $80.5 million for the year ended December 31, 2020. An increase in proppant prices between the periods contributed to a $37.0 million positive impact, while an increase in sales volume contributed a $25.0 million positive impact.

Service Sales.      Services sales, which includes freight for last-mile logistics services decreased by $1.3 million to $29.9 million for the year ended December 31, 2021, as compared to $31.2 million for the year ended December 31, 2020. The decrease in logistics revenue was due to lower sales volumes shipped to last-mile logistics customers.


98


Table of Contents

Cost of sales (excluding depreciation, depletion and accretion expense).      Cost of sales (excluding depreciation, depletion and accretion expense) increased by $11.6 million to $84.7 million for the year ended December 31, 2021, as compared to $73.1 million for the year ended December 31, 2020. Cost of sales (excluding depreciation, depletion and accretion) related to product sales increased by $10.7 million due to increased sales volumes, which increased costs for utilities, maintenance and royalties. These increases were partially offset by decreased mining and rental equipment costs, due to dredge mining for the full year, and cost efficiencies gained during the period. Cost of sales (excluding depreciation, depletion and accretion expense) related to services increased by $0.9 million due to higher operating costs, despite lower sales volumes shipped to last-mile logistics customers during the period.

Depreciation, depletion and accretion expense.      Depreciation, depletion and accretion expense increased by $2.8 million to $23.7 million for the year ended December 31, 2021, as compared to $20.9 million for the year ended December 31, 2020. The increase in depreciation, depletion and accretion expense is due to increased component depreciation for certain product belts used in the proppant production process, as well as increased units of production depletion due to higher sand production when compared to the prior period.

Selling, general and administrative expense.      Selling, general and administrative expense decreased by $0.6 million to $17.1 million for the year ended December 31, 2021, as compared to $17.7 million for the year ended December 31, 2020. The decrease is primarily due to a decrease of $2.4 million in unit-based compensation expense during the year ended December 31, 2021, compared to the year ended December 31, 2020. This decrease was partially offset by an increase of $1.8 million of employee and marketing costs associated with increased economic activity, from historic lows brought about by the COVID-19 pandemic during the year ended December 31, 2021, compared to the year ended December 31, 2020.

Our selling, general and administrative expenses include the non-cash expense for unit-based compensation for equity awards granted to our employees. For the year ended December 31, 2021, unit-based compensation expense was $0.1 million, as compared to unit-based compensation expense of $2.5 million for the year ended December 31, 2020.

Impairment of Long-Lived Assets.      We recognized no impairment of long-lived assets expense for the year ended December 31, 2021. We recognized $1.3 million of impairment of long-lived assets expense for the year ended December 31, 2020, due to a write off of a vendor deposit during the period.

Interest expense, net.      Interest expense, net increased by $9.4 million to $42.2 million for the year ended December 31, 2021, as compared to $32.8 million for the year ended December 31, 2020. The increase is primarily due to the recognition of a loss on extinguishment of debt of $16.4 million resulting from the recognition of unamortized debt discount and deferred financing costs of $11.9 million and a make-whole premium of $4.5 million paid upon redemption of the 2018 Term Loan Credit Facility. This increase was partially offset by the recognition of gain on extinguishment of debt of $4.5 million due to the forgiveness of the SBA Paycheck Protection Program Loan and the related accrued interest expense during the period, and decreased interest expense of $1.7 million and decreased debt discount amortization of $0.8 million related to the 2021 Term Loan Credit Facility.

Income tax expense.      Income tax expense increased by $0.4 million to $0.8 million for the year ended December 31, 2021, as compared to $0.4 million for the year ended December 31, 2020. The increase is primarily due to increased revenues, which increased our liability related to Texas franchise taxes.


99


Table of Contents

Liquidity and Capital Resources

Overview

Our primary sources of liquidity to date have been capital contributions from our owners, cash flows from operations, and borrowings under our 2018 Term Loan Credit Facility, which was refinanced by our 2021 Term Loan Credit Facility, and our 2023 ABL Credit Facility. Our primary uses of capital have been capital expenditures for the construction of our Kermit and Monahans facilities and to support organic growth. In addition, we have routine facility upgrades and additional ancillary capital expenditures associated with, among other things, contractual obligations and working capital obligations. Funding for these cash needs may be provided by any combination of internally generated cash flow, borrowings under our 2023 ABL Credit Facility, additional capital investment from our owners, or other external financing sources. We strive to maintain financial flexibility and proactively monitor potential capital sources, including equity and debt financing, to meet our investment and target liquidity requirements and to permit us to manage the cyclicality associated with our business.

As of December 31, 2022, we had working capital, defined as current assets less current liabilities, of $90.1 million and $48.9 million of availability under the 2018 ABL Credit Facility. Our cash and cash equivalents totaled $82.0 million.

We intend to contribute all of the net proceeds of this offering to Atlas Operating in exchange for Atlas Units, and Atlas Operating will further contribute the net proceeds received to Atlas LLC. The principal purposes of this offering are to help fund our current growth initiatives, create a public market for our Class A common stock, and facilitate our future access to the capital markets. Atlas LLC will use:


approximately $             million of the net proceeds of this offering to fund the construction of the Dune Express; and


approximately $             million of the net proceeds of this offering to fund general corporate purposes.

We do not currently intend to use any of the net proceeds from this offering to make payments in connection with the Redemption Right or Call Right. Please see the section titled “Use of Proceeds” for more information.

Cash Flow

The following table summarizes our cash flow for the periods indicated:


     Predecessor  
     For the Year Ended December 31,  
     2022      2021     2020  
     (in thousands)  

Consolidated Statement of Cash Flow Data:


Net cash provided by operating activities

   $ 206,012      $ 21,356     $ 12,486  

Net cash used in investing activities

     (89,592)        (19,371     (9,532

Net cash provided by (used in) financing activities

     (74,811)        2,344       11,826  


Net increase in cash

   $ 41,609      $ 4,329     $ 14,780  


100


Table of Contents

Year Ended December 31, 2022 Compared To The Year Ended December 31, 2021

Net Cash Provided by Operating Activities

Net cash provided by operating activities was $206.0 million and $21.4 million for the years ended December 31, 2022 and 2021, respectively. The increase is primarily attributable to increased net income.

Net Cash Used in Investing Activities

Net cash used in investing activities was $89.6 million and $19.4 million for the years ended December 31, 2022 and 2021, respectively. The increase was due to an increase in capital spending at the Kermit and Monahans facilities, Dune Express and logistics assets during the year ended December 31, 2022 when compared to the year ended December 31, 2021.

Net Cash Provided by and Used in Financing Activities

Net cash used in financing activities was $74.8 million year ended December 31, 2022. Net cash provided by financing activities was $2.3 million for the year ended December 31, 2021. The change is due to a decrease of $178.2 million of proceeds from term loan borrowings related to the funding of the 2021 Term Loan Credit Facility, a decrease of $148.8 million of payments on payments on term loan borrowings and debt prepayment and extinguishment costs related to the repayment of the 2018 Term Loan Credit Facility, an increase of $35.0 million for member distributions, and a decrease in proceeds from equity issuances of $12.6 million during the year ended December 31, 2022 compared to the year ended December 31, 2021.

Year Ended December 31, 2021 Compared To The Year Ended December 31, 2020

Net Cash Provided by Operating Activities

Net cash provided by operating activities was $21.4 million and $12.5 million for the year ended December 31, 2021 and 2020, respectively. The increase is primarily attributable to increased revenues of $60.6 million. The increase was partially offset by an $11.5 million increase in cost of sales (excluding depreciation, depletion and accretion expense), a $22.2 million increase in repayment of paid-in-kind interest upon the repayment of the 2018 Term Loan Credit Facility and an $8.8 million decrease in interest paid-in-kind through the issuance of additional term loans, as we elected not to pay certain term loan interest in-kind as of June 30, 2021.

Net Cash Used in Investing Activities

Net cash used in investing activities was $19.4 million and $9.5 million for the year ended December 31, 2021 and 2020, respectively. The increase was due to the purchase of Wyatt’s Lodge and an increase in capital spending at the Kermit and Monahans facilities during the year ended December 31, 2021 when compared to the year ended December 31, 2020.

Net Cash Provided by Financing Activities

Net cash provided by financing activities was $2.3 million and $11.8 million for the year ended December 31, 2021 and 2020, respectively. The decrease is primarily due to an increase of $165.6 million for the repayment of the 2018 Term Loan Credit Facility partially offset by an increase of $163.2 million from proceeds of term loan borrowings during the year ended December 31, 2021 compared to the year ended December 31, 2020.


101


Table of Contents

Capital Requirements

Outside of our growth and technology initiatives, our business is not presently capital intensive in nature and only requires the maintenance of our two existing proppant production facilities. Our current level of capital expenditures is expected to remain within our internally generated cash flow as we maintain significant flexibility around the timing of capital expenditures.

We intend to fund capital requirements through our primary sources of liquidity, which include cash on hand and cash flows from operations and, if needed, our borrowing capacity under the Credit Facility.

If and to the extent our board of directors were to declare a cash distribution to our Class A common stockholders, we currently expect the dividend to be paid from free cash flow. We do not currently expect to borrow funds or to adjust planned capital expenditures to finance dividends on our Class A common stock, if any such dividends were to be declared by our board of directors. The timing, amount and financing of dividends, if any, will be subject to the discretion of our board of directors from time to time following this offering. Please see the section titled “Dividend Policy.”

Debt Agreements

2018 ABL Credit Facility

On December 14, 2018, the Company and the ABL Lenders entered into the ABL Credit Agreement pursuant to which the ABL Lenders provided revolving credit financing to the Company in an aggregate principal amount of up to $50.0 million with availability thereunder subject to a borrowing base as described in the loan agreement governing the 2018 ABL Credit Facility (the “2018 ABL Credit Agreement’’). The 2018 ABL Credit Facility included a letter of credit sub-facility, which permitted issuances of letters of credit up to an aggregate amount of $10.0 million. As of December 31, 2022, the Company had an aggregate principal amount of $1.1 million in letters of credit outstanding under the 2018 ABL Credit Facility.

The 2018 ABL Credit Facility was repaid in full in February 2023 in connection with the Company’s entrance into the 2023 ABL Credit Facility.

2023 ABL Credit Facility

On February 22, 2023, the Company, Bank of America, N.A., as administrative agent, and certain financial institutions party thereto as lenders (the “ABL Lenders”) entered into a Loan, Security and Guaranty Agreement (the “ABL Credit Agreement”) pursuant to which the ABL Lenders provide revolving credit financing to the Company in an aggregate principal amount of up to $75.0 million with availability thereunder subject to a borrowing base as described in the ABL Credit Agreement. The 2023 ABL Credit Facility includes a letter of credit sub-facility, which permits issuances of letters of credit up to an aggregate amount of $25.0 million. The scheduled maturity date of the 2023 ABL Credit Facility is February 22, 2028.

Borrowings under the 2023 ABL Credit Facility bear interest, at the Company’s option, at either a base rate or Term SOFR, as applicable, plus an applicable margin based on average excess availability as set forth in the ABL Credit Agreement. Term SOFR loans bear interest at Term SOFR for the applicable interest period plus an applicable margin, which ranges from 1.50% to 2.00% per annum based on average excess availability as set forth in the ABL Credit Agreement. Base rate loans bear interest at the applicable base rate, plus an applicable margin, which ranges from 0.50% to 1.00% per annum based on average excess availability as set forth in the ABL Credit Agreement. In addition to paying interest on outstanding principal under the 2023 ABL Credit Facility, the Company is required to pay a commitment fee which ranges from 0.375% per annum to 0.500% per annum with respect to the


102


Table of Contents

unutilized commitments under the 2023 ABL Credit Facility, based on the average utilization of the 2023 ABL Credit Facility. The Company is also required to pay customary letter of credit fees, to the extent that one or more letter of credit is outstanding.

The 2023 ABL Credit Facility is unconditionally guaranteed, jointly and severally, by the Company and certain of its subsidiaries and secured by substantially all of the assets of the Company and certain of its subsidiaries.

2021 Term Loan Credit Facility

On October 20, 2021, we entered into a credit agreement with Stonebriar Commercial Finance LLC (the “Term Lender”) pursuant to which the Term Lender extended a $180.0 million single advance term loan credit facility (the “2021 Term Loan Credit Facility”). The term loan outstanding under the 2021 Term Loan Credit Facility is payable in seventy-two consecutive monthly installments in varying amounts as more particularly set forth in the promissory note that was executed and delivered in connection with the 2021 Term Loan Credit Facility and has a final maturity date of October 1, 2027. The amortization of the 2021 Term Loan Credit Facility carries an implied interest rate of 8.47% per annum.

At any time prior to the October 1, 2027 maturity date, we may redeem the 2021 Term Loan Credit Facility, in whole or in part, at a price equal to 100% of the principal amount plus a prepayment fee. The prepayment fee ranges from 3% on or before October 19, 2022, to 2% after October 19, 2022, and on or before October 19, 2023, and 1% thereafter. Upon maturity of the 2021 Term Loan Credit Facility, the entire unpaid principal amount, together with interest, fees and other amounts payable in connection with the facility, will be immediately due and payable without further notice or demand. Mandatory debt service (inclusive of principal repayment and interest) is $30 million per year for the first two years of the 2021 Term Loan Credit Facility, increasing to $45 million for the final four years.

The 2021 Term Loan Credit Facility includes certain non-financial covenants, including but not limited to restrictions on incurring additional debt and certain distributions. The 2021 Term Loan Credit Facility is not subject to financial covenants, but does require us to maintain a minimum average liquidity balance of not less than $20.0 million at any time there are loans of $5.0 million or more in the aggregate outstanding under our 2023 ABL Credit Facility.

Proceeds from the 2021 Term Loan Credit Facility were used to repay of outstanding indebtedness under our previous 2018 Term Loan Credit Facility with BlackGold Capital Management to make permitted distributions, and for general corporate purposes.

Quantitative and Qualitative Disclosure about Market Risk

Commodity Price Risks

The market for our services is indirectly exposed to fluctuations in the price of crude oil and natural gas, to the extent such fluctuations impact drilling and completion activity levels and thus impact the activity levels of our customers in the exploration and production and oilfield services industries. We do not currently intend to hedge our indirect exposure to commodity price risk.

Our natural gas purchases expose us to commodity price risk. Our facility operations require natural gas consumption for equipment used in the manufacturing of proppant. Pricing for natural gas has been volatile and unpredictable for several years, and this volatility is expected to continue in the future. The cost we pay for our natural gas depends on many factors outside of our control, such as the strength of the global economy and global supply and demand for the commodities we produce. To


103


Table of Contents

reduce the impact of fluctuations in natural gas prices on our operational costs, we periodically enter into commodity derivative contracts with respect to certain of our forecasted natural gas usage through various transactions that reduce the impact of price volatility. We plan to continue our practice of entering into such transactions to reduce the impact of commodity price volatility on our cash flow from operations. These hedging activities are intended to manage our exposure to natural gas price fluctuations.

Interest Rate Risks

We are subject to interest rate risk on a portion of our long-term debt under the 2023 ABL Credit Facility. The amounts owed under our 2023 ABL Credit Facility use SOFR as a benchmark for establishing the rate at which interest accrues. We do not currently have any borrowings under our 2023 ABL Credit Facility and do not currently have or intend to enter into any derivative arrangements to protect against fluctuations in interest rates applicable to our outstanding indebtedness under our 2023 ABL Credit Facility.

Market Risks

The demand, pricing and terms for proppant and last-mile services provided by us are largely dependent upon the level of drilling activity in the oil and natural gas industry in the Permian Basin. These activity levels are influenced by numerous factors over which we have no control, including, but not limited to: the supply of and demand for oil and natural gas; the level of prices, and expectations about future prices of oil and natural gas; the cost of exploring for, developing, producing and delivering oil and natural gas; the expected rates of declining current production; the discovery rates of new oil and natural gas reserves; available rail and other transportation capacity; weather conditions; domestic and worldwide economic conditions; political instability in oil-producing countries; environmental regulations; technical advances affecting energy consumption; the price and availability of alternative fuels; the ability of oil and natural gas companies to raise equity capital and debt financing; and merger and divestiture activity among oil and natural gas companies.

The level of U.S. oil and natural gas drilling is volatile. Expected trends in oil and natural gas production activities may not materialize and demand for our services may not reflect the level of activity in the industry. Any prolonged and substantial reduction in oil and natural gas prices would likely affect oil and natural gas production levels and therefore affect demand for our services. A material decline in oil and natural gas prices or Permian Basin activity levels could have an adverse effect on our business, financial condition, results of operations and cash flows.

Credit Risks

We are subject to risks of loss resulting from nonpayment or nonperformance by our customers. We examine the creditworthiness of third-party customers to whom we extend credit and manage our exposure to credit risk through credit analysis, credit approval, credit limits and monitoring procedures, and for certain transactions, we may request letters of credit, prepayments or guarantees, although collateral is generally not required. For the year ended December 31, 2022, we had 39 customers, of which ten were investment grade. For the year ended December 31, 2021, we had 39 customers, of which seven were investment grade.

Inflation Risks

Inflationary factors such as increases in the cost of our products and overhead costs may adversely affect our results of operations. Although we do not believe that inflation has had a material impact on our financial position or results of operations to date, a high rate of inflation in the future may


104


Table of Contents

have an adverse effect on our ability to maintain current levels of gross margin and selling, general and administrative expenses as a percentage of net revenue if the selling prices of our products do not increase with these increased costs.

Critical Accounting Policies and Estimates

The preparation of financial statements requires the use of judgments and estimates. Our critical accounting policies are described below to provide a better understanding of how we develop our assumptions and judgments about future events and related estimates and how they can impact our financial statements. A critical accounting estimate is one that requires our most difficult, subjective or complex estimates and assessments and is fundamental to our results of operations.

We base our estimates on historical experience and on various other assumptions we believe to be reasonable according to the current facts and circumstances, the results of which form the basis for making judgments about the carrying values of assets and liabilities that are not readily apparent from other sources. We believe the following are the critical accounting policies used in the preparation of our combined financial statements, as well as the significant estimates and judgments affecting the application of these policies. This discussion and analysis should be read in conjunction with our combined financial statements and related notes included in this report.

Our significant accounting policies are described in Note 2 to our audited consolidated financial statements as of and for the years ended December 31, 2022, 2021 and 2020 included elsewhere in this prospectus. We prepare our consolidated financial statements in conformity with GAAP, which requires us to make estimates and assumptions about future events that affect the amounts reported in the consolidated financial statements and accompanying footnotes. Actual results could differ from those estimates. For additional information concerning certain estimates and assumptions, see the respective footnotes to our audited consolidated financial statements as of and for the years ended December 31, 2022, 2021 and 2020 included elsewhere in this prospectus. We believe that the following discussion addresses our most critical accounting estimates, which require management’s most subjective and complex judgments.

Property, Plant and Equipment, Including Depreciation and Depletion

In order to calculate depreciation for our fixed assets, other than plant facilities and mine development costs, we use the best estimated useful lives at the time the asset is placed into service.

Mining property and development costs, including plant facilities directly associated with mining properties, are amortized using the units of production method on estimated measures of tons of in-place reserves. The impact to reserve estimates is recognized on a prospective basis. Drilling and related costs are capitalized for deposits where proven and probable reserves exist. These activities are directed at obtaining additional information on the deposit or converting non-reserve minerals to proven and probable reserves, with the benefit being realized over a period greater than one year. At a minimum, we will assess the useful lives and residual values of all long-lived assets on an annual basis to determine if adjustments are required. The actual reserve life may differ from the assumptions we have made about the estimated reserve life.

We review property, plant and equipment for impairment annually or whenever events or changes in circumstances indicate that the carrying value of such assets may not be recoverable. If such a review should indicate that the carrying amount of long-lived assets is not recoverable, the Company will reduce the carrying amount of such assets to fair value.


105


Table of Contents

Recently Issued Accounting Pronouncements

Under the JOBS Act, we expect that we will meet the definition of an “emerging growth company,” which would allow us to have an extended transition period for complying with new or revised accounting standards pursuant to Section 107(b) of the JOBS Act. We intend to take advantage of all of the reduced reporting requirements and exemptions, including the longer phase-in periods for the adoption of new or revised financial accounting standards under Section 107 of the JOBS Act until we are no longer an emerging growth company. Our election to use the phase-in periods permitted by this election may make it difficult to compare our financial statements to those of non-emerging growth companies and other emerging growth companies that have opted out of the longer phase-in periods under Section 107 of the JOBS Act and who will comply with new or revised financial accounting standards. If we were to subsequently elect instead to comply with these public company effective dates, such election would be irrevocable pursuant to Section 107 of the JOBS Act.

In March 2020, the Financial Accounting Standards Board (“FASB”) issued Accounting Standards Update (“ASU”) 2020-04, Reference Rate Reform (Topic 848): Facilitation of the Effects of Reference Rate Reform on Financial Reporting, which provides optional guidance for a limited time to ease the potential burden in accounting for reference rate reform. The new guidance provides optional expedients and exceptions for applying GAAP to contracts, hedging relationships and other transactions affected by reference rate reform if certain criteria are met. The amendments apply only to contracts and hedging relationships that reference LIBOR or another reference rate expected to be discontinued due to reference rate reform. These amendments are effective immediately and may be applied prospectively to contract modifications made and hedging relationships entered into or evaluated on or before December 31, 2022. In December 2022, FASB issued ASC 2022-06, Reference Rate Reform (Topic 848), Deferral of the Subset Date of Topic 848, which deferred the sunset date to Topic 848 to December 31, 2024. The Company is evaluating the impact of this standard on its condensed consolidated financial statements and does not believe it will have a material impact on the condensed consolidated financial statements.

In June 2016, the Financial Accounting Standards Board issued ASU 2016-13, Financial Instruments — Credit Losses (Topic 326), which amends the guidance on the impairment of financial instruments. The standard adds an impairment model, referred to as current expected credit loss, which is based on expected losses rather than incurred losses. The standard applies to most debt instruments, trade receivables, lease receivables, reinsurance receivables, financial guarantees and loan commitments. Under the guidance, companies are required to disclose credit quality indicators disaggregated by year of origination for a five-year period. In May 2019, ASU 2016-13 was subsequently amended by ASU 2019-04, Codification Improvements to Topic 326, Financial Instruments – Credit Losses, ASU 2019-05, Financial Instruments – Credit Losses (Topic 326): Targeted Transition Relief. The new guidance is effective for fiscal years beginning after December 15, 2021. The Company is currently evaluating the impact of the ASU on the consolidated financial statements and does not believe it will have a material impact on the consolidated financial statements.

On January 1, 2022, the Company adopted ASU 2016-02, Leases (Topic 842), as amended by other ASUs issued since February 2016, using the modified retrospective transition method applied at the effective date of the standard. By electing this option transition method, information prior to January 1, 2022 has not been restated and continues to be reported under the accounting standards in effect for the period (ASC Topic 840).

The Company elected the package of practical expedients permitted under the transition guidance within the new standard, including the option to carry forward the historical lease classifications and assessment of initial direct costs, account for lease and non-lease components as a single lease, and to not include leases with an initial term of less than 12 months in the lease assets and liabilities.


106


Table of Contents

The adoption of ASC Topic 842 resulted in the recognition of finance lease right-of-use assets, operating lease right-of-use assets, and lease liabilities for finance and operating leases. As of January 1, 2022, the adoption of the new standard resulted in the recognition of finance lease right-of-use assets of $0.7 million, including $0.7 million reclassified from property, plant and equipment, net, and finance lease liabilities of $0.6 million. Additionally, the Company recorded operating lease right-of-use assets of $5.4 million and operating lease liabilities of $7.1 million, including $2.3 million and $4.8 million recorded to other short-term liabilities and other long-term liabilities, respectively as of January 1, 2022. There was no significant impact to the condensed consolidated statements of income, equity or cash flows. Refer to Note 5, Leases, for additional disclosures required under ASC Topic 842.

Internal Controls and Procedures

We are not currently required to comply with the SEC’s rules implementing Section 404 of the Sarbanes-Oxley Act and are therefore not required to make a formal assessment of the effectiveness of our internal control over financial reporting for that purpose. Upon becoming a public company, we will be required to comply with the SEC’s rules implementing Section 302 of the Sarbanes-Oxley Act, which will require our management to certify financial and other information in our quarterly and annual reports and provide an annual management report on the effectiveness of our internal control over financial reporting. We will not be required to make our first assessment of the effectiveness of our internal control over financial reporting under Section 404 until our second annual report on Form 10-K after we become a public company.

Further, our independent registered public accounting firm is not yet required to formally attest to the effectiveness of our internal controls over financial reporting and will not be required to do so for as long as we are an “emerging growth company” pursuant to the provisions of the JOBS Act. Please see “Summary—Emerging Growth Company Status” for more information.

Off Balance Sheet Arrangements

We currently have no material off-balance sheet arrangements.

Environmental and Other Governmental Regulations

We are subject to a variety of federal, state and local regulatory environmental requirements affecting the proppant production and mineral processing industry, including among others, those relating to employee health and safety, environmental permitting and licensing, air and water emissions, GHG emissions, water pollution, waste management, remediation of soil and groundwater contamination, land use, restoration of properties, hazardous materials and natural resources. We have made, and expect to make in the future, expenditures to comply with such laws and regulations, but cannot predict the full amount of such future expenditures.

We discuss certain environmental matters relating to our various production and other facilities, certain regulatory requirements relating to human exposure to crystalline silica and our proppant production activity under the subsection titled “Business—Environmental and Occupational Health and Safety Regulations.”


107


Table of Contents

INDUSTRY

Proppant and Proppant Logistics Industry

The oil and natural gas proppant industry is comprised of businesses involved in the mining, manufacturing, distribution and sale of the propping agents used in the stimulation of hydrocarbon-bearing shale reservoirs as a method to enable production from oil and natural gas wells. During this process, proppants are blended into a fluid mixture and injected downhole into the wellbore at high pressure. This creates cracks in the resource-bearing rock allowing for proppants to become lodged in these cracks, resulting in increased permeability of the reservoir, and in turn, driving greater production of hydrocarbons over the life of the well.

The quantity of proppant used in a typical well in North America often exceeds 10,000 tons. Prior to the development of in-basin sand facilities, proppants were predominately shipped long distances in bulk from processing facilities in the midwestern United States by rail and barge to various resource basins. It was then further transferred to a truck for “last mile” wellsite delivery. This long supply chain made transportation costs a significant portion of the customer’s overall proppant cost. The discovery, and subsequent development, of in-basin proppant deposits afforded customers a significant cost saving alternative. The supply chain was shortened to remove the costly rail or barge portion of the transportation cost, and in the Permian Basin customers have effectively reached full adoption of in-basin proppants, although meaningful consumption of out of basin proppant can occur from time to time during periods when demand exceeds local production capabilities as is occurring in today’s market. As the Permian Basin does not regularly experience extended seasonal disruptions, the proppant industry has been transformed into a “just-in-time” delivery model reliant on large quantities of trucks to fulfill orders. This places a premium on in-basin proppant production facilities to maximize uptime and on trucking companies to supply a sufficient quantity of trucks to effectively and efficiently fulfill deliveries to end-users.

As customers continue to drive efficiencies and productivity in their drilling and completions programs, in turn driving the demand for more proppant, we expect increased demand of the products and services that we provide.


108


Table of Contents

Permian Basin Proppant Consumption Density Map: 2018 - 2022

LOGO

Source: Enverus and Atlas Energy Solutions

The Permian Basin

The Permian Basin is the leading onshore U.S. resource basin with respect to drilling activity and oil production. The Permian Basin is an oil-and-gas-producing area located in West Texas and the adjoining area of southeastern New Mexico and covers an area of approximately 75,000 square miles and is composed of more than 7,000 fields, according to the Railroad Commission of Texas.


109


Table of Contents

The Permian Basin


LOGO

Source: Permian Strategic Partnership

The Permian Basin can be further delineated into sub-basins, with the Midland, Delaware, and Central Basin Platform being the major sub-basins. The significant resource base is best represented by the multiple benches, or target hydrocarbon-producing geological formations, with oil and natural gas production depths ranging from a few hundred feet to up to five miles below the surface. The recent increased use of enhanced-recovery practices in the Permian Basin has resulted in a substantial, and positive, impact on domestic oil production.

As a result of the substantial size and significant amount of estimated resource in-place in the Permian Basin, Texas not only receives an enormous economic benefit but also helps to provide energy security for the United States. In the first half of 2022 the Permian Basin accounted for nearly 43% of all domestic oil production and nearly 17% of total domestic natural gas production, according to the Federal Reserve Bank of Dallas. However, significant production growth potential remains. In 2018, the U.S. Geological Survey estimated that the Delaware Basin alone has the potential to produce 46.3 billion barrels of oil and 281 trillion cubic feet of natural gas.


110


Table of Contents

The Permian Basin is the Most Active On-Shore Basin in the U.S.

Active Rig Count by Basin as of December 31, 2022


LOGO

Average Production by Basin (MMBbls/d) in December 2022


LOGO

Source: EIA

Overview of the Proppant Production Process

Raw silica sand is a naturally occurring material that is mined and processed for various commercial uses. While the specific extraction method utilized depends primarily on the geologic setting, most raw silica sand is mined using conventional open-pit bench extraction methods. The composition, depth and chemical purity of the sand also dictates the processing method and equipment utilized.

In West Texas, much of the reserves are accessible from buried deposits, which require the removal of some overburden. The giant open dunes, where our facilities are located, can be mined readily without the need to remove any overburden. After extraction, the raw silica sand is washed with water to remove fine impurities such as clay and organic particles, with additional procedures used when contaminants are not easily removable. The final steps in the production process involves the drying and sorting of the raw silica sand according to mesh size.


111


Table of Contents

The unique size, location and depth of our large open-dune reserves provides us with a distinct advantage relative to our competitors, including the fact that in the Winkler Sand Trend we uniquely benefit from a naturally occurring water table near the surface of our deposits, providing an ample natural supply of costless water for dredge and wash plant operations, minimizing the impacts on regional aquifers. Furthermore, this has allowed us to implement e-mining, or mining via electric dredge, which significantly reduces the environmental impacts associated with mining, positively differentiating us relative to our competition.

One of Atlas Energy Solutions’ Two Proppant Production Facilities (Located in Kermit, Texas)


LOGO

Overview of the Trucking and Logistics Market

Transportation and logistics costs incurred in the delivery of proppant from the mine to the wellsite represents the majority of cost per ton of proppant paid by the end user. Furthermore, costs attributable to proppant sourcing and delivery represents a significant portion of the total expenses incurred by the E&P operator in completing a well.

While trucking is the default mode of wellsite delivery for proppant, the industry is currently characterized by low levels of technological differentiation between service providers, minimal barriers to entry, and high levels of price competition. As a result, the market is highly fragmented, and operating margins for incumbent service providers are typically 10%. A significant amount of wellsite delivery transportation is ultimately delivered by private owner-operators, whether providing services through their own offering, participating through a 3rd-party marketplace platform, or in partnership with an end-consumer. Most of the mileage traveled on the trip to deliver proppant to the wellsite occurs over interstate highways, state roads, and county roads, while the remaining portion of the trip occur over lease roads that are generally built and maintained by wellsite operators. For wellsite delivery, the roundtrip driving distance between the mine and wellsite is typically more than 35 miles and often exceeds 100 miles. The payload can range from 22 to 27 tons per truck depending on the selected trailer design. There are currently three main trailer designs utilized for proppant delivery, Box, Pneumatic, and Belly Dump, with average payloads of 22, 24, and 26 tons, respectively.


112


Table of Contents

Once the payload has reached the wellsite it will be offloaded to an on-site storage system, or a designated storage area, before being utilized in the fracturing process.

A typical horizontal well-design in the Permian Basin can call for greater than 10,000 tons of proppant for completion, which implies greater than 425 truckloads of proppant per well, more than 50,000 miles driven per well, and more than 250 million miles driven per year according to Rystad Energy. Rystad Energy also estimates an average day in 2021 in the Permian Basin had more than 3,000 trucks transporting proppant over the surrounding network of public highways and lease roads.

Consistent with our technology focus, we are expanding our footprint in the proppant delivery logistics business and pursuing autonomous wellsite delivery. The Company will begin operations with 10 trucks, which we anticipate will be deployed by early 2023. The implementation of autonomous wellsite delivery solutions is intended to improve the reliability and consistency of proppant delivery, mitigate risks to operations and lessen the probability or impact of traffic congestion and accidents, weather events and other disruptions that frequently affect the delivery of oilfield products within the United States currently. We also believe our autonomous wellsite delivery initiative will amplify the positive impacts on the environments and communities in which we operate.

Proppant and Proppant Logistics Market Dynamics in the Permian Basin

Key Demand Drivers

The demand for proppant in the Permian Basin is predominately influenced by the level of drilling and completions activity by oil and natural gas exploration and production companies operating in the region. Drilling and completion (“D&C”) activity is driven by well profitability and returns, which are driven by a number of factors, including current domestic and international supply and demand for oil and natural gas, current and expected future prices for oil and natural gas, and the perceived stability and sustainability of those prices. As a result of the transition by exploration and production (“E&P”) companies from vertical to horizontal drilling that occurred during the previous decade, a vast inventory of previously uneconomic resources became profitable to drill and complete. Consequently, demand for pressure pumping and the proppant used during the well completion process has increased substantially over the last ten years.

Growth in Global Energy Demand

Supported by the backdrop of improved global economic growth, global energy demand rebounded in 2021 and is forecasted to continue to increase. According to the IEA, global oil demand is expected to grow by 7% and natural gas demand by 3% from 2021 through 2025.


113


Table of Contents

Global Historical and Projected

Natural Gas Demand (bcf/d)


Global Historical and Projected

Oil Demand (MMBbIs/d)


LOGO


LOGO

Source: IEA

Global gasoline demand is higher than it was pre-pandemic, and continued economic recovery is expected to drive oil demand beyond the pre-pandemic peak toward the end of 2022 or beginning of 2023. Additionally, building off a strong 2021, continued momentum is expected in the global natural gas markets in 2022 and beyond, certain policy movements in Europe have shown that natural gas is gaining popularity as a transition and destination fuel for a reduced emissions world. Furthermore, recent geopolitical considerations are expected to result in continued reconfiguration of oil and natural gas flows between key producing and consuming nations. Supply of these commodities from the U.S. offers increased energy security to allied nations versus reliance on producers involved in geopolitical conflict.

Significant Identified U.S. Oil and Natural Gas Supply Base

The U.S. represents a significant share of identified oil and natural gas supplies, with proven reserves at the end of 2020 of more than 68 billion barrels of oil and 445 trillion cubic feet of natural gas, according to the BP Statistical Review of World Energy. Furthermore, per the EIA, the Permian Basin accounts for more than 62% of oil and 16% natural gas reserves in the U.S.


U.S. Oil Reserves by Region   U.S. Natural Gas Reserves by Region
LOGO   LOGO

Source: EIA


114


Table of Contents

Attractive Extraction Economics in the Permian Basin

The Permian Basin is North America’s most active basin due to its size, geology and attractive economics. The Permian Basin consists of mature, legacy, onshore oil and liquids rich natural gas reservoirs that span from West Texas through New Mexico inclusive of large in-basin sand reserves utilized in unconventional hydraulic fracturing production techniques. The Permian Basin is divided by the Central Basin platform, creating the Midland and Delaware sub-basins, which have contributed to the growth in the Permian Basin. Furthermore, the Permian Basin is made up of more than a dozen oil-containing shale formations, with several of these formations layered atop one another, resulting in a stacking of economically viable hydrocarbon reservoirs, ultimately supporting significantly higher recoverable reserves per acre versus other regions that do not possess this geology. According to Rystad Energy, the Permian Basin accounts for reserves with among the lowest breakeven costs across unconventional oil fields in the U.S., supporting attractive profitability for operators that incentivizes increased drilling and completion activity.

Unconventional Oil Cost Curve Based on 2022 Results ($/Bbl)


LOGO

Source: Rystad Energy

Demand for proppant is predominantly influenced by the level of drilling and completions spending by E&P companies, which, in turn, depends largely on the current and anticipated profitability of developing oil and natural gas reserves. The largest unconventional operators are present in the Permian Basin and have achieved better well economics by lowering drilling and completion costs without sacrificing production performance, including by reducing costs related to proppant and last


115


Table of Contents

mile logistics. To this end, the oil and natural gas industry is shifting towards more cost-effective and efficient proppants and technologies, such as sourcing in-basin proppant. Additionally, modern drilling and well completion technology and techniques, such as those related to horizontal drilling and hydraulic fracturing, coupled with in-basin proppant have made the extraction of oil and gas increasingly cost-effective in formations that historically would have been uneconomic to develop and have substantially increased the pace of demand growth for proppant. According to Rystad Energy, the cost per foot incurred by E&P companies to drill and complete a well in the Permian Basin has declined by more than 50% since 2013.

Permian Basin Drilling and Completion Cost by Year ($/Ft)


LOGO

Source: Rystad Energy

In conjunction with the cost efficiencies and increased reliability driven by in-basin proppant, new, unconventional well completion continues to rise; in combination with rising well completion intensity, as evidenced by trends including longer lateral lengths, increasing proppant per well and rising adoption of zipper and simul-frac completion techniques, this is expected to result in compounding demand for proppant. Logistical constraints associated with the location of some in-basin proppant mines combined with inefficiencies in trucking provide an opportunity for strategically located, efficient and reliable producers to disproportionately benefit in the future.

Increased Spending on Drilling and Completion in the Permian Basin

We expect the positive momentum in Permian Basin drilling and completion activities to continue as oil and gas exploration and production companies increased their 2022 capital investment in the aggregate, further increasing the total rig and frac fleet count. Notwithstanding the slowdown from COVID-19 shutdowns, the portion of total U.S. drilling and completions capital expenditures spent in the Permian Basin has increased over time, and represented 50% of the total in 2021, according to Rystad Energy.


116


Table of Contents

Total Spending on Drilling and Completions ($ Billions)

LOGO

Source: Rystad Energy

Increased Prevalence of Horizontal Drilling

Horizontal drilling has become the default method in the industry for the economic extraction of shale resources. According to Rystad Energy, active horizontal drilling rigs as a percentage of total active drilling rigs in the Permian Basin has increased rapidly for ten consecutive years to approximately 95% at the end of 2022. We expect U.S. oil and natural gas exploration and production companies to continue to focus on the development of unconventional resources utilizing horizontal drilling techniques. The successful economic development and ultimate production of horizontal wells typically relies on advanced stimulation techniques in which proppants are a critical component.

Avg. Permian Horizontal Drilling Rig Count as a Percent of Total Avg. Permian Drilling Rig Count

LOGO

Source: Rystad Energy

Growing Adoption of Pad Drilling and Increasing Pad Sizes

Oil and gas exploration and production companies have increasingly adopted multi-well pads and zipper or simultaneous completions of unconventional oil and natural gas wells. Multi-well pads allow for the drilling of multiple wellbores from a single drilling pad, reducing drilling times. According to Rystad Energy, the average wells completed per pad in the Permian Basin has risen by 57% since 2013.


117


Table of Contents

Average Wells Completed Per Pad in the Permian Basin

LOGO

Source: Rystad Energy

Rising Lateral Lengths per Well

As Permian Basin oil and gas exploration and production companies have increased horizontal development activities, the industry has made significant efficiency gains, driving down cycle times and finding and development costs per barrel of oil equivalent. Among the more significant factors in this trend is the shift towards longer lateral lengths. These longer lateral lengths increase the surface area, or exposure, to the hydrocarbon-bearing zone, thus increasing the productivity of a well. Lateral lengths have increased by approximately 43% from an average of 6,477 feet in 2016 to an average of 9,266 feet in 2022, according to Rystad Energy. This trend is expected to continue as operators pursue continuous operational improvements. As operators have extended well lengths, the demand for proppant has also increased – we expect this trend to continue.

Lateral Length per Well (Ft)

LOGO

Source: Rystad Energy

Increasing Rate of Stimulation

E&P and pressure pumping companies continuing to develop methods to enhance the rate of stimulation of unconventional wells in an effort to accelerate well completion, combined with rising operating efficiencies on the part of the hydraulic fracturing service providers, has resulted in an increase in the lateral length stimulated per day of approximately 60% over the past five years, according to data from Rystad Energy. An increase in lateral feet completed per day in turn drives an increase in proppant consumption on a daily basis.


118


Table of Contents

Median U.S. Shale Lateral Feet Stimulated (Ft per Day)


LOGO

Source: Rystad Energy

Additionally, these same companies have increasingly adopted zipper and simul-frac completions to allow for reduced capital expenditures per well and cycle times. While these advancements have resulted in cost savings per well through the reduced duration of rentals of rigs and pressure pumping spreads, this trend is favorable for proppant providers as it results in accelerated proppant consumption, translating in increased proppant consumed per day. In 2022, zipper and simul-frac completion operations consumed approximately five times the proppant used in legacy single well completion techniques on a daily basis, according to Rystad Energy.

U.S. Land Proppant Pumped Per Day Per Completion Job (Million Lbs per Day)


LOGO

Source: Rystad Energy

Increasing Proppant Loading per Lateral Foot

Similar to drilling efficiencies, oil and gas exploration and production companies have also focused on improving completion efficiencies. Over time, operators have increased the amount of proppant pumped per lateral foot in an effort to increase conductivity in the subsurface formation, increasing the ultimate recovery of hydrocarbons from the hydrocarbon-bearing zones. This trend is expected to continue as operators continuously aim to improve overall well returns, further driving the demand for proppant.


119


Table of Contents
  Average Proppant Loading (Lbs/Ft)       Average Permian Proppant per Well (Tons)  
  LOGO       LOGO  

Source: Rystad Energy

Among the oil and natural gas producing regions, the Permian Basin features significantly higher proppant loading or sand intensity relative to other basins, according to data from Lium.

Sand Intensity Relative to U.S. Average Shale Well (0% Baseline)


LOGO

Source: Lium Research

Growth in Permian Basin Proppant Demand

According to the 4Q 2022 Lium Sheets - Frac Sand report, the Permian Basin comprises the majority of estimated proppant demand in the U.S. due to attractive extraction economics resulting in increased drilling and completion activity in combination with greater well completion intensity.

Proppant Demand by U.S. Basin (MMTPY)


LOGO

Source: Lium Research


120


Table of Contents

Furthermore, supported by increasing operating efficiency and unconventional well completion intensity, the annual proppant demand per operating hydraulic fracturing fleet is expected to increase by 286% in 2022 versus 2013 levels. As a result, total proppant demand is expected to grow meaningfully, and the Permian Basin is expected to continue to gain market share through 2023.

Permian Proppant Demand per Frac Fleet (Thousand Tons per Active Fleet)


LOGO

Source: Rystad Energy

Increasing Demand for Pressure Pumping and Associated Well Completion Products and Services

According to Rystad Energy the total U.S. active pressure pumping fleet count has recovered from the May 2020 trough of 77 active fleets to over 200 active fleets by the end of 2021, representing an increase of over 180%. As oil and natural gas producers have accelerated their development programs, the demand for pressure pumping fleets has significantly increased. The increase in the demand for pressure pumping fleets is expected to increase well beyond 2021 levels, to more than 290 active fleets by the end of 2023. We expect the strong demand for pressure pumping fleets to continue, which will drive additional demand for the products and services we provide.

Average U.S. Historical and Projected Active Pressure Pumping Fleets (Number of Fleets)


LOGO

Source: Rystad Energy

As of Q4 2022, the Permian Basin accounted for 46% of all active U.S. pressure pumping fleet activity, indicating the Permian Basin continues to see outsized completions activity.


121


Table of Contents

U.S. Average Pressure Pumping Fleets by Basin


LOGO

Source: Rystad Energy

Proppant Logistics Market Drivers

End use of proppant in hydraulic fracturing operations is dependent on the transportation of proppant from the mine to the wellsite utilizing commercial trucking methods. Since the hauling capacity per truck has not increased substantially over time, proppant demand is significantly correlated with demand for last-mile transportation and logistics solutions. As a result, rising proppant demand is expected to translate into a commensurate increase in demand for proppant transportation and logistics services.

Increasing Logistics Costs for Last-Mile Delivery

As a result of long-term inflation and supply and demand imbalances following disruptions due to the global pandemic, freight costs associated with overland trucking has increased substantially. The U.S. Bureau of Labor Statistics estimates that producer price index for long-distance truckload general freight trucking has increased by almost 50% since 2020.

General Freight Trucking Producer Price Index (Indexed to 100 at 2003)


LOGO

Source: U.S. Bureau of Labor Statistics


122


Table of Contents

Labor costs now represent 45% of total per mile costs of operating a semi-truck, a 12% increase since 2015. Labor costs are the largest component of the cost per mile of operating a semi-truck, with the second largest cost per mile being fuel costs. These labor costs exclude additional costs that have become prevalent in the industry, such as driver training, recruiting, and retention expenses, which increase the labor costs on a fully burdened basis.

Increasing Traffic in the Permian Basin

Existing interstate highway, state highway and other road infrastructure in the Permian Basin region was originally established to serve lower total regional population and traffic. Infrastructure upgrades in the Permian Basin have progressed at a slower pace when compared to the growth in drilling and completion activity, resulting in increased congestion that drives operational delays and total cost for oilfield products. According to Rystad Energy, there were greater than 3,000 proppant trucks on the road per day on average in the Permian Basin in 2021, which is more than double the levels in 2015. Rystad Energy estimates this number to exceed 4,000 per day in 2022 and 2023. We expect our Dune Express combined with our wellsite delivery assets will alleviate trucking congestion by removing trucks from public roads.

Permian Proppant Trucks on the Road per Day Since 2015


LOGO

Source: Rystad Energy

Increase in Safety-Related Trucking Incidents in the Permian Basin

The significant increase in truck traffic in the Permian Basin has resulted in a meaningful increase in trucking-related safety incidents and fatalities, impacting E&P operators, service companies and local communities. The average number of trucking fatalities in the Permian Basin in 2019-2021 increased by 77% relative to the 2003-2005 average according to data from the Texas Department of Transport. We expect our autonomous wellsite delivery initiative combined with our conveyor system to reduce the total miles driven and result in fewer accidents.


123


Table of Contents

Number of Trucking Fatalities in the Permian Basin


LOGO

Source: Texas Department of Transportation

The U.S. Department of Transportation (USDOT) in June 2020 announced its initiative to speed up testing and widespread deployment of autonomous vehicles in order to address increased vehicle related traffic incidents. USDOT’s findings on autonomous vehicles highlighted key benefits including increasing safety, economic and social benefits, efficiency, convenience and mobility. In accordance with USDOT’s stated objectives, we expect our wellsite delivery assets initiative will improve profit margins and safety.

Emissions Associated with Proppant Logistics Operations

Trucking is estimated to be a significant contributor to U.S. greenhouse gas emissions. According to the U.S. Environmental Protection Agency, transportation accounted for 27% of U.S. greenhouse gas emissions in 2020. In 2020, medium and heavy-duty trucks represented 26% of transportation sector greenhouse gas emissions. In conjunction with heavy payloads associated with proppant delivery, truck traffic associated with proppant operations represents a meaningful source of greenhouse gas emissions. We expect our electric conveyor system combined with our wellsite delivery assets will reduce truck miles associated with proppant delivery, thereby resulting in a meaningful reduction in greenhouse gas emissions.


U.S. GHG Emissions by Sector  

U.S. Transportation Sector
GHG Emissions by Source

LOGO  

LOGO

Source: U.S. Environmental Protection Agency


124


Table of Contents

Proppant Supply Outlook

Legacy Proppant Supplies and Transition to In-Basin

Historically, the majority of the proppant used in the U.S. was supplied by mines in Wisconsin; their product, Northern White Sand (“NWS”), was preferred by operators for its reliable properties. However, once sufficient in-basin sand reserves were developed and operators were able to determine in-basin proppants as a reliable substitute for NWS, the legacy supply from Wisconsin was displaced by in-basin supply.

Permian Basin Proppant Source


LOGO

Source: Lium Research

The first in-basin proppant capacity in the Permian Basin was brought online in 2017. Today, the nameplate capacity in the Permian Basin is estimated to be approximately 74 mmtpy according to Rystad Energy. The advantage of moving to a local proppant supply was primarily due to the high transportation cost associated with NWS, as Permian Basin in-basin proppant was ultimately proven to be of sufficient API specification quality for operators. Moving the proppant by rail from Wisconsin to the Permian Basin accounted for the majority of the cost of supply - it is estimated that approximately 60-80% of the cost of out-of-basin frac proppant is associated with transportation.

The discovery of in-basin sand deposits across several U.S. oil and gas basins led to a rush of reserve acquisitions and greenfield mine construction projects, ultimately leading to a disruption of supply dynamics with long-term, in-basin mine economics being more attractive relative to the marginal economics of existing NWS capacity. This significant increase in new, in-basin capacity accordingly led to a temporary oversupply in the market, while local proppant adoption was taking place, resulting in a significant decrease in prices. This price decrease, accompanied with the pandemic-induced decline in general oil and gas E&P-led demand, resulted in some capacity reductions and in some instances mine closures, including full abandonment and remediation.

This moderation of supply, coupled with the improved commodity price environment and full adoption of in-basin proppant in the Permian Basin, has resulted in a currently tight Permian Basin proppant market and an improved proppant pricing environment. Additionally, there can be significant capital expenditures or re-start costs associated with bringing idled capacity back online, and because most facilities were built approximately 4-5 years ago, many open sites are beginning to require significant maintenance capital expenditures.


125


Table of Contents

Several factors are expected to continue to influence this market, including:


the difficulty of finding raw silica sand reserves that meet API specifications that can be mined and processed economically;


the difficulty of securing contiguous raw silica sand reserves large enough to justify capital investment required to develop a processing facility;


the lack of available capital investment options;


the added barrier of securing mining, production, water, air, refuse and other state and local operating permits from appropriate authorities;


the long lead time required to design and construct sand processing facilities that can efficiently process large quantities of high-quality proppant;


supply chain factors influencing availability of equipment required to set up or refurbish sand processing facilities; and


the lower achievable capacity and lifespan of reserves for temporary, smaller, or mobile-mini mines.

Cumulative Tons of Proppant Consumed in the Permian Basin by Source since 2010


LOGO

Source: Lium Frac Sand Usage

Overview of the Types of Proppant

Proppant Types

Historically, three primary types of proppant have been commonly utilized in the hydraulic fracturing process: processed silica sand, resin-coated sand, and manufactured ceramic beads. Over the last 10 years, processed silica sand has become the dominant product category in the market as the use of ceramic and resin-coated proppants has become increasingly rare in onshore unconventional completions due to their high cost.

Proppants are produced and sold at differing sizes depending on customer preferences and market availability. Over the last several years, oil and natural gas companies have shifted towards finer-mesh products as they have increasingly pursued “slickwater” completion designs. Older well designs utilized gels and other substances that aided in the delivery of proppants into the fracture network around the well. As these agents have been removed from most wells in current completion designs, slickwater designs rely only on the velocity of the fluids delivered to the fracture network to carry the proppants into place, thus making finer mesh proppants like those found in-basin more desirable as they are more easily conveyed into the fracture network unaided.


126


Table of Contents

Processed Silica Sand

There are three major types of raw silica sand deposits that have historically generated the proppants most widely used in onshore oil and gas well completions in North America: (a) Northern White; (b) Brady Brown; and (c) in-basin. Northern White is a specific type of white sand mined primarily in Wisconsin, Minnesota, and Illinois, and is generally considered to be of higher quality than Brady Brown due to its crush strength, sphericity, and monocrystalline structure. Due to its quality, Northern White historically commanded premium prices relative to Brady Brown and experienced greater market demand relative to supply, although with the recent emergence of lower cost, and high quality in-basin proppant, demand in basins in which local and viable sand deposits have been discovered has materially shifted away from Northern White. This shift in proppant preference is no more prevalent than in the Permian Basin, where in-basin sand has shown to exhibit quality specifications nearly analogous to Northern White in the higher quality large open-dune deposits, similar to the reserves found at our Kermit and Monahans facilities.

The API has identified thresholds that various physical characteristics of proppants should pass, and our proppant consistently meets these thresholds. The stringent API specifications for proppants include, among others, coarseness, crush resistance, roundness and sphericity, acid solubility, turbidity (low levels of contaminants), and particle size distribution.

Proppant Mesh Size

Mesh size is used to describe the size of the proppant and is determined by sieving the proppant through screens with uniform openings corresponding to the desired size of the proppant. Each type of proppant comes in various sizes, and the various mesh sizes are used in different applications in the oil and natural gas industry. The mesh number system is a measure of the number of equally sized openings there are per square inch of screen through which the proppant is sieved. For example, a 40-mesh screen has 40 equally sized openings per linear inch. Therefore, as the mesh size increases, the granule size decreases. In order to meet API specifications, 90% of the proppant described as 40/70 mesh size proppant must consist of granules that will pass through a 40-mesh screen but not through a 70-mesh screen.

In-basin silica sand produced in West Texas predominately yields 40/70 and 100 mesh, with both the Delaware and Midland Basins consuming almost exclusively these two sizes of proppant.

Sand Pricing

In-Basin Spot Pricing

In-basin sand pricing has historically been volatile as the shift to in-basin production facilities was a disruptive event. Customers quickly aimed to realign their proppant procurement programs, although frictions to faster adoption such as legacy contracts, quality testing and new vendor evaluation created a lag in adoption and a temporary oversupply of in-basin proppant. Supply can sometimes require significant capital expenditures or re-starting costs and cannot always be brought online in time to meet rapid resurgence in demand. According to Rystad Energy, median minegate prices for proppant in the Permian Basin are forecasted to be between $35/ton to $40/ton through 2026. We expect to profitably produce high-quality proppant at such levels.


127


Table of Contents

Median In-Basin Permian Sand Minegate Price Forecast ($/Ton)


LOGO

Source: Rystad Energy


128


Table of Contents

BUSINESS

Our Company

Overview

We are a leading provider of proppant and logistics services to the oil and natural gas industry within the Permian Basin of West Texas and New Mexico, the most active oil and natural gas basin in North America. Our core mission is to maximize value for our stockholders by generating strong cash flow and allocating our capital resources efficiently, including providing a regular and durable return of capital to our investors through industry cycles. In our pursuit of this mission, we deploy innovative techniques and technologies to develop our high-quality resource base and efficiently deliver our products to customers through leading-edge logistics solutions.

We were founded in 2017 by Ben (“Bud”) Brigham, our Executive Chairman and Chief Executive Officer, and are led by an entrepreneurial team with a history of constructive disruption bringing significant and complementary experience to this enterprise, including the perspective of longtime E&P operators, which provides for an elevated understanding of the end users of our products and services. While we believe this experience and our associated knowledge base differentiates us from our competitors and facilitates our ability to identify and execute as an early mover on critical value drivers, enabling us to maximize the full potential of our business and outcomes for our stockholders and stakeholders alike, past performance is not a guarantee of our future success or similar results. You should not rely on the historical record of our management team, our directors or their affiliates as indicative of the future performance of an investment in us or the returns we will, or are likely to, generate going forward.

Our executive management team has a proven track record and over 90 years of combined industry experience with a history of generating positive returns and value creation, exemplified by Bud Brigham’s significant experience leading several companies through a successful IPO, or an acquisition event:


In 2011, Brigham Exploration, a pioneer in the use of 3-D seismic and horizontal drilling and completions techniques within the oil-rich Bakken Shale was acquired by Statoil ASA (“Statoil”) for $4.7 billion. Brigham Exploration completed an IPO in 1997.


In 2017, Brigham Resources, an innovator in Delaware Basin drilling and completions techniques (as an early adopter of e-frac technology and tested proppant loadings in excess of 5,000 pounds per foot) was acquired by Diamondback Energy, Inc. (“Diamondback”) for $2.6 billion.


In 2022, Brigham Minerals, a technically sophisticated oil and gas minerals company, combined with Sitio Royalties in an all-stock merger with a combined enterprise value of approximately $4.8 billion (representing a $2.2 billion value to Brigham Minerals, or a 108% total return since its IPO, with total return calculated as cumulative dividends plus stock price appreciation).

Our experience as E&P operators was instrumental to our understanding of the opportunity created by in-basin sand production and supply in the Permian Basin, which we view as North America’s premier shale resource and which we believe will remain its most active through economic cycles. Though the industry has always been focused on increasing efficiencies in resource development, mission critical proppant production and related logistics were historically chaotic and inefficient, particularly given the long and inefficient legacy midwestern supply chain.

We identified the two giant open dunes of the Winkler Sand Trend as the premier sand resource in the region due to their differentiated geologic characteristics, advantaged water access and their large scale/long resource life. As the reserves of these large open dunes have not been subjected to


129


Table of Contents

the same degree of soil development, organics and impurities as buried sand deposits, they tend to produce higher and more consistent mining yields relative to buried sand deposits, making the large open dunes economically superior deposits. The giant open dunes’ advantaged access to water stems from the nature of the perched aquifers that have been found to form within these deposits. It is the nature of this water table that has enabled Atlas to become the first and, to our knowledge, the only proppant producer in the Permian Basin to mine by electric dredge, and we expect to transition more of our mining to electric dredging over the next twelve to twenty-four months. We control over 14,500 acres on the giant open dunes, which represents more than 70% of the total giant open dune acreage available for mining. Large open-dune reserves accounted for 100% of our produced volumes for the years ended December 31, 2022 and 2021. As the reserves of these large open dunes have not been subjected to the same degree of soil development, organics and impurities as buried sand deposits, they tend to produce better yields relative to buried sand deposits. Large open-dune reserves have also been proven to produce a higher-quality product (as measured by tests of crush strength, turbidity, etc.) more efficiently and with a smaller environmental footprint as compared to buried sand reserves throughout the Permian Basin. Furthermore, as referenced in a 2019 study attributable to Dr. Robert E. Mace of Texas State University, the large open dunes provide for advantaged access to water.

“More recently, Machenberg (1982, 1984) mentions “interdunal ponds” at Monahans Sandhills State Park and includes photographs of them. Machenberg (1982) notes that unvegetated dunes immediately absorb rainfall (there is no surface drainage in the dune field) and can store large amounts of rainfall and that the surficial sand is a locally important aquifer. She also notes that perched water tables form where the caliche is sufficiently thick. The Atlas Sand Company’s north facility (Atlas North near Kermit) has a shallow dugout (“no more than 10-15 ft. deep”) that they used as a source of water for construction (Triepke 2018b; Figure 3.19).”

Atlas Electric Dredges


LOGO

As our geologic analysis and land acquisition program was ongoing, we developed a thesis that a substantial redesign of the typical proppant plant was necessary to fit the just-in-time logistics model


130


Table of Contents

that we believed would develop in the Permian Basin due to the growing scale of proppant demand and industry’s focus on efficiency gains, and began engineering our facilities to fit this model. Our final engineered design resulted in a more expensive construction project on the front-end as we invested in redundant equipment in order to maximize our potential utilization rates. Construction commenced in the second half of 2017 on our Kermit and Monahans facilities and we began selling proppant in July 2018. Once operational, the relationships we formed over many years in the industry helped us to quickly build a brand centered around quality and reliability.

Based on our current total annual production capacity of approximately 10.0 million tons, as of December 31, 2022, our properties have an aggregate expected reserve life of approximately 36 years based on the currently defined mineral reserves, with a potential extension of our reserve life to approximately 200 years based on our total mineral resources.

LOGO

We believe we are the leader in meeting the evolving proppant needs of an increasingly efficiency-focused oil and natural gas industry. From our inception, our disruptive approach has met the needs of the just-in-time supply model we believed would become the best fit for the industry’s increasingly efficiency-driven focus, and we engineered our facilities to fit this model. Our plants include substantial investments in redundant equipment that aim to maximize our uptime and utilization rates. We believe these are key differentiating factors from some other proppant producers serving the Permian Basin.


131


Table of Contents

Atlas Plants Designed with Redundancy to Maximize Reliability


LOGO

The shift to in-basin sand proved to be a disruptive event for the proppant industry, but not sufficient to provide all participants a meaningful advantage. While many companies have attempted to capture the efficiency gains promised by this relocation of the proppant production hub from the midwestern United States to an in-basin model, few have been able to optimize their efficiency with geologically superior acreage positions and properly designed facilities. It is this combination of geology, water availability and plant design that significantly differentiates our proppant production facilities and we believe makes us more reliable than our competition.

Significant Innovation Projects

The Dune Express Electric Conveyor System

The Dune Express, which will originate at our Kermit facility and stretch into the middle of the Northern Delaware Basin, will be the first long-haul proppant conveyor system in the world. While this is the first application of conveyor infrastructure to long-haul proppant, conveyors are widely used in the proppant industry for short movements of product, and are a preferred method of transporting bulk materials in many other industries due to the low transportation cost and increased safety of the accompanying decrease in truck traffic.

Upon completion, we expect the Dune Express to be 42 miles in length, capable of transporting 13 million tons of proppant annually and is designed to have more than 84,000 tons of dry storage within the system. We view the Dune Express as the premier method of moving proppant across the basin and the industry’s best analog to the pipeline infrastructure that moves oil, natural gas, and water around the major producing basins in the U.S. We have secured the contiguous right-of-way, substantially completed the requisite federal and state permitting necessary for construction of the Dune Express and have signed sand supply and logistics contracts with major oil companies for the delivery of proppant by means of the Dune Express. This conveyor system will be strategically located to deliver proppant to the core of the most prolific producing region of the Delaware Basin with flexible loadout capabilities, including both permanent and mobile loadouts. We expect the Dune Express to make public roadways safer by removing trucks from public roadways, thus reducing traffic, accidents and fatalities on public roadways in the region.


132


Table of Contents

The system is comprised of multiple conveyors that transfer proppant from belt to belt at various stages of the transportation process. We plan to install two permanent loadouts near the middle of the conveyor system close to the Texas side of the Texas-New Mexico state line and at the end of the Dune Express right-of-way on BLM land near the Lea-Eddy County line in New Mexico. The system will also utilize one or more “mobile” loadouts, which can be mobilized and relocated from time to time, to maximize delivery efficiencies particularly for operators prosecuting a concentrated development plan in the area that is proximate to the conveyor system but not proximate to one of the two permanent loadouts connected to the system. The acquisition of the initial Dune Express right of way took three years to complete and was finalized in 2021. All material permits, including a federal permit to construct and operate the system (which was needed due to the right of way extending onto BLM lands) have been acquired. Detailed engineering and design has also been completed, as have environmental and traffic studies, evaluation of various alternative delivery methods, detailed survey work and customer education and market sizing. The location of the Dune Express right of way provides efficient access to some of the highest rate of return well locations and deepest inventory in the Permian Basin.

Illustrative Rendering of the Dune Express


LOGO

Wellsite Delivery Assets

Our existing logistics business utilizes third-party transportation contractors which we plan to supplement and bring in-house with our own trucks and trailers. As our trucks and trailers continue to be deployed, we expect to deliver significant productivity gains, as measured by tons per truck that can be delivered daily, compared to the throughput performance of traditional trucking assets. These immediate productivity gains will be made possible through a combination of process improvements and targeted investments in fit-for-purpose equipment. We have partnered with a provider of autonomy and robotic technology with experience in the field of GPS-denied off-road autonomous driving applications to procure a fleet of vehicles equipped with technology designed to test and ultimately support autonomous wellsite delivery. We expect to begin testing in the field during 2023 with the goal of developing this technology over the next several years.


133


Table of Contents

Atlas Logistics Solutions Can Expand Potential Throughput per Vehicle Dramatically


LOGO

Our technology partner’s highly-customizable, self-driving technology can be applied to a variety of platforms – from tugs, UAVs, and shuttles, to heavy-duty transit buses and full-size logistics trucks. We chose our technology partner due to their long history of deploying autonomous vehicle technology in military and other applications, with full 360-degree wheel movement capabilities.

While many autonomous vehicle companies focus on slight wheel movements for long-haul applications, our technology partner pioneered solutions for use in applications that required 90-degree+ turns to be performed. Furthermore, the technology package has the capacity to record the locations of the vehicles (whether or not Wi-Fi/cellular is available) to map out the road network in preparation for the transition to increasingly less labor-intensive deliveries. We expect to receive our initial vehicles by early 2023 and will begin training shortly thereafter.

In addition to the technology enhancements that are expected to reduce the operating costs of our logistics business through the decreased labor intensity associated with autonomous delivery, we also expect to realize early productivity gains due to the expanded payloads of our deliveries and high levels of asset utilization. We plan to achieve increased payloads due to a combination of equipment design and operational planning. Our business model can potentially achieve a fourfold increase in the daily throughput of a truck as compared to conventional delivery in 2023, and when combined with the mileage reduction delivered by the Dune Express can extend that throughput advantage to 15x or greater depending on the location of the wellsite.

Together, we believe these initiatives could have a significant impact in driving future revenue and increasing cash flow, reducing emissions, improving safety and relieving traffic and other burdens produced by the existing means of last-mile delivery. Furthermore, by reducing the intermittency of proppant delivery to the wellsite – and thereby increasing the reliability of delivery and potential throughput per truck per day – we believe our delivery solutions significantly mitigate a major bottleneck to the completions supply chain that may support increased pressure-pumping efficiencies.

The graphic below shows the estimated amount of proppant, in tons, that can be delivered to Delaware Basin drilling spacing units in a day by an individual truck. Based on the current supply chain configuration, each truck is limited to very few deliveries per day for a variety of reasons, including the distance from local mines to wellsites that are distributed across a large geographic area, a limited public roadway network and the hours per day that a driver can work. Upon commercialization of the Dune Express and our wellsite delivery assets, this throughput potential expands dramatically due to the reduced delivery distance higher payload capacity and increased asset utilization.


134


Table of Contents

Atlas Logistics Solutions Expand Potential Throughput per Vehicle Dramatically


LOGO

Source: Enverus.

In addition to the efficiency and reliability gains that we expect to realize through our logistics solutions, we anticipate that we will also be able to deliver significant safety benefits to the communities of the Permian Basin. The public road network in the Permian Basin today is ill-equipped for the massive amounts of oilfield traffic that is required for the industry to operate. By reducing the number of trucks required to fulfill proppant deliveries and removing these trucks from public roads, we anticipate that the rate of traffic accidents and associated injuries and fatalities will be reduced. Please see the subsection titled “—Value Proposition to Our Community and Stakeholders: A Demonstration of the Harmony of Capitalism with Sustainable Environmental & Social Progress” below for additional information regarding our anticipated community impact.

Our logistics solutions have been designed to offer a further extension of our promise of reliability to our customers. We believe that customers will seek out our logistics solutions not only due to the compelling technology and infrastructure solutions we offer but also because they are tied into highly reliable production assets in our Kermit and Monahans facilities.

Value Proposition to Our Stockholders

Strong Margins and Cash Flow Generation – Our ability to generate cash flow is paramount to our value proposition, as it enables us to reinvest in growth, maintain a healthy balance sheet and regularly return capital to our stockholders. A brief summary of several of our key performance and financial metrics is provided below. Please see “Summary—Summary Historical and Pro Forma Financial and Operating Data—Non-GAAP Financial Measures” for more information.


135


Table of Contents
     Predecessor  
     Year Ended December 31,  
     2022     2021     2020  
     (in thousands, except percentages)  

Net Income

   $ 217,006     $ 4,258     $ (34,442

Adjusted EBITDA(1)

   $ 263,983     $ 71,954     $ 24,667  

Adjusted EBITDA Margin(1)

     54.7     41.7     22.1

Net Cash Provided by Operating Activities

   $ 206,012     $ 21,356     $ 12,486  

Adjusted Free Cash Flow(1)

   $ 228,510     $ 64,239     $ 19,686  

Adjusted Free Cash Flow Margin(1)

     47.3     37.3     17.6


(1)

Please read “Summary—Summary Historical and Pro Forma Financial and Operating Data—Non-GAAP Financial Measures” for the definitions of Adjusted EBITDA, Adjusted EBITDA Margin, Adjusted Free Cash Flow and Adjusted Free Cash Flow Margin and a reconciliation of these measures to our most directly comparable financial measures calculated and presented in accordance with GAAP.

Focus on Return of Capital – We commenced paying cash distributions in December 2021 and have paid $70.0 million in distributions to our unitholders since that time. We intend to continue to recommend to our board of directors that we continue to regularly return capital to our stockholders through a dividend framework that will be communicated to stockholders in the future. Furthermore, our credit agreements contain provisions that allow us to pay dividends, subject to certain covenants, including pro forma liquidity and leverage ratios. Please see the section titled “Dividend Policy” for more information.

Management & Historical Successes – We were founded by Bud Brigham, our Executive Chairman and Chief Executive Officer, and are led by an experienced team of entrepreneurs from oil and natural gas, transportation, industrial automation and proppant industry backgrounds. We believe our management team’s deep industry experience, record of successful value creation and established history as entrepreneurs and positive disruptors in the energy industry are unique advantages that enable us to continually identify critical value-creation drivers that will allow us to maximize the full potential of our business and the outcomes for our stockholders and stakeholders alike. While our management team has had significant success, past performance is not a guarantee of our future success or similar results. You should not rely on the historical record of our management team, our directors or their affiliates as indicative of the future performance of an investment in us or the returns we will, or are likely to, generate going forward.


Brigham Exploration - Prior to founding Atlas LLC, Bud Brigham founded Brigham Exploration, a positive disruptor and innovator in the E&P space. Brigham Exploration was an early pioneer in 3-D seismic exploration onshore, and completed its IPO in 1997. In subsequent years, Bud oversaw the identification, acquisition, delineation and development of approximately 375,000 net acres in the Williston Basin. Brigham Exploration established itself as a leading innovator in horizontal drilling and fracking, as well as oil, gas and water gathering and distribution. The company delivered industry leading operational and economic performance, leading up to Brigham Exploration’s sale to Statoil in December 2011 for an enterprise value of $4.7 billion.


Brigham Resources - Immediately following the sale of Brigham Exploration, Bud Brigham and others from the Brigham Exploration management team founded Brigham Resources and executed on similar strategies in the Southern Delaware Basin in West Texas. By applying rigorous geologic evaluation criteria, Brigham Resources was an early entrant in the Southern Delaware Basin in Pecos County, Texas, where it assembled an approximately 80,185 net acre leasehold position in a largely contiguous block. Like Brigham Exploration, Brigham Resources again was a leading innovator in the play, generating significant enhancements in operational and economic performance, prior to selling its assets to Diamondback in February 2017 for approximately $2.6 billion.


136


Table of Contents
   

Brigham Minerals - In 2012, Bud Brigham and other members of his management team founded Brigham Minerals, a mineral acquisition company that leverages its knowledge base and experience to acquire mineral ownership in top-tier liquids rich domestic resource plays. Subsequent to its rapid growth as a private enterprise, Brigham Minerals’ management executed an upsized $300 million IPO in April 2019. Brigham Minerals aggregated a portfolio of approximately 81,800 net royalty acres across 36 counties within the Delaware and Midland Basins in West Texas and New Mexico, in the Anadarko Basin in Oklahoma, the Denver-Julesburg Basin in Colorado and Wyoming and the Williston Basin in North Dakota, prior to entering into an all-stock merger with Sitio Royalties in 2022 with a combined enterprise value of approximately $4.8 billion (representing a $2.2 billion value to Brigham Minerals, or a 108% total return since its IPO, with total return calculated as cumulative dividends plus stock price appreciation).

Value Proposition to Our Community and Stakeholders: A Demonstration of the Harmony of Capitalism with Sustainable Environmental & Social Progress

Across our past and current ventures, we have a well-established history of being good stewards of not only stockholder capital but also of the environments and communities in which we live and operate. Our core obligation is to our stockholders, and we recognize that maximizing value for our stockholders requires that we build goodwill and optimize the outcomes for our broader stakeholders, including our employees and the communities in which we operate. As a result, we deliver leadership across all aspects of Sustainable Environmental and Social Progress (“SESP”). Our aptitude on SESP benefits from our commitment to identifying and executing upon opportunities to transform our business which enhance our growth and profitability through the implementation of new technologies. Our planned Dune Express is one of several initiatives we have undertaken that exhibits our initiatives to transform our business, enhance growth and increase our profitability, while simultaneously providing substantial environmental and safety benefits. This is the harmony of capitalism – innovation can and often does drive both profitability and environmental and/or social progress through free market activity.

The graphic below summarizes our estimates of the reduction in the truck miles driven and associated traffic accidents, traffic fatalities, truck miles driven and emissions attributable to the anticipated operation of the Dune Express as compared to traditional practices.

The Potential Long-Range Environmental & Safety Benefits from The Dune Express are Significant3


LOGO

Source: Management’s internal analysis, based on results of study completed by Texas A&M Transportation Institute

Sustainable Environmental Progress (“SEP”)

To our knowledge, we are the only proppant producer in the Permian Basin that engages in e-mining. Furthermore, we plan to continue transitioning our mining activities from diesel powered mining


3 

Chart reflects anticipated reductions over a 30-year period.


137


Table of Contents

methods to electric dredging over the next twelve to twenty-four months, which generates materially lower emissions when compared to traditional sand mining. Our shift towards e-mining at both of our Kermit and Monahans facilities exemplifies the alignment of both our operational and SEP leadership, as dredge mining, based on our estimates, will materially improve safety and, reduces emissions by approximately 50% versus traditional sand mining methods due to the significant reduction in diesel, fuel usage required to mine sand traditionally, partially offset by increased electricity consumption from our electric dredges. Our dredge mining process also leads to less surface area disturbance per ton of sand produced as we mine to greater depth as compared to mining associated with buried sand deposits.

Our giant open-dune reserves, paired with the replenishing water sources from our acreage’s in-ground aquifers, are the key reasons why we are able to adopt a technology more often reserved for use in rivers and other naturally occurring bodies of water for use in the desert of West Texas. Our reserves benefit from a naturally occurring water table near the surface of our mines, which is unique in the Winkler Sand Trend and provides an ample natural supply of costless water for dredge and wash plant operations.

Atlas Electric Dredges


LOGO

Additionally, the results of a study commissioned by us with the Texas A&M Transportation Institute, an independent research agency (the “Transportation Study”), when integrated with our management’s internal analysis, support our estimate that our planned Dune Express could significantly reduce emissions that would otherwise be produced by trucking-related activities associated with the delivery of proppant from the mines of Permian Basin providers to end users. Our estimates project that the system will result in an approximate 70% reduction in carbon dioxide emissions and other emissions, including other pollutants that are harmful to humans. Please see the subsection titled “—Significant Innovation Projects—Dune Express” above for additional information regarding the Dune Express.

Our management team has been proactive with respect to the protection of the DSL and its habitat in an effort to reduce the risk that our business and operations will be materially interrupted in the event that the DSL is listed under the ESA. We have adopted numerous best practices to promote


138


Table of Contents

active conservation measures for the benefit of the DSL, including our identification of up to 17,000 acres of land for potential set asides, our pursuit of more environmentally friendly mining practices and our participation in the CCAA for the DSL. Please see the subsection titled “—Competitive Strengths—Proactive approach to the well-being of the environment and our employees” below. In January 2021, the CCAA was approved by the USFWS to provide a framework for entry into voluntary conservation agreements between the USFWS and stakeholder participants under which the parties work together to identify threats to the DSL, design and implement conservation measures to address these threats and monitor their effectiveness, among other things. Atlas has been a supporter of the CCAA since its inception and was the first proppant producer to apply for a permit under, and be accepted into, the CCAA. Due to our participation in the CCAA and other conservation measures that we have voluntarily adopted, we do not anticipate that a listing of the DSL as an endangered species would materially reduce sand production at our Kermit and Monahans facilities. We are currently only one of three companies participating in the CCAA. In the event that the DSL is listed as an endangered species under the ESA, it is possible that companies that are not participants in the CCAA at the time of a potential ESA listing would see a disruption to their operations.

Sustainable Social Progress (“SSP”)

We have committed to fostering a safe environment at our worksites and we are committed to extending this culture of safety far beyond our premises. We have a rigorous safety training program with well-developed protocols. We have automated or have invested in remote operations technology to substantially reduce the amount of the activities at the plant sites that require physical interaction between human beings and industrial equipment, and in doing so have removed many of the safety hazards at our facilities.

We anticipate that our planned Dune Express will provide significant environmental benefits, while also benefitting the surrounding region, making it a safer place to live and work. Our management’s analysis of the results of the Transportation Study supports our expectation that the Dune Express will contribute to a meaningful reduction in Permian Basin traffic accidents, congestion and automobile fatalities, by taking trucks off public roads and operating in a much more efficient manner than the industry has historically operated. We believe this will also benefit the community by reducing the wear and tear on local infrastructure, while making the region a safer and better place to live and work. Furthermore, by reducing the number of drivers needed per well and in the aggregate, these initiatives can meaningfully reduce trucking-related hazards on customer wellsites and mitigate future driver shortages.

We are actively engaged in the West Texas community in which we operate, as we believe that by supporting our community, our community will support us. We sponsor a number of programs benefitting schools and the youth in Winkler and Ward Counties, Texas, including supporting after-school programs for children and skill-development programs for high school students.

Our Company’s culture is a product of our employees, and as such, we embrace the responsibility of promoting a diverse and inclusive meritocracy, with approximately 64% minority and/or female representation in our workforce as of December 31, 2022. We reward the hard work of our employees by compensating them well, with our median employee earning in excess of $100,000 per year as of 2022. Furthermore, we provide our employees with a high-quality benefits package including fully paid family medical, dental and vision insurance, a company 401(k) match program and substantial paid time off or rotational schedules. For our employees in West Texas, we provide convenient, safe and comfortable living facilities at Wyatt’s Lodge, our distinctive alternative to the traditional, notoriously unsafe and unsanitary housing accommodations provided for many oilfield employees. Wyatt’s Lodge provides employees with fully furnished housing, a full cafeteria with a chef and a diverse menu including healthy options, a workout facility, as well as a recreational room and a movie theater. The success of our efforts to create a high-quality workplace is evidenced by our low employee turnover and accolades that include the “Great Place to Work” certification from the Great Place to Work Institute, Inc. for the years ended


139


Table of Contents

December 31, 2019, 2020 and 2021, as well as the “Top Work Places” Award of Recognition from Austin American-Statesman for the years ended December 31, 2021 and 2022.

We believe that the men and women who have served in the United States armed forces have earned a special place in our society. As such, at our founding we created a dedicated effort to support our veterans in our hiring. We have found our focus on recruiting veterans to work for Atlas has brought us many hardworking and outstanding employees over the years and has positively influenced our corporate values. We have received external recognition for our veteran hiring practices, including the Hire Vets Medallion from the DOL in 2019, 2020 and 2021. As of December 31, 2022, 8.4% of our employees served in the U.S. military as compared to an average of 5.6% across all employers nationally.

Governance

We believe that the alignment of our employees, our management and our board of directors with our stockholders is paramount. A few examples of the actions that we will take in connection with this offering or the characteristics that highlight the alignment of interests between our management and stockholders are as follows:


We will establish a diverse and independent board of directors with complementary skills and backgrounds.


We will adopt an executive compensation program that encourages return of capital to stockholders, including through the use of performance-based compensation, with performance metrics that focus business strategy and corporate objectives on total shareholder return, and equity-based long-term incentives.


We will adopt a director compensation policy for our non-employee directors in which a significant portion of the total compensation package is equity based to further align the interests of our directors with our stockholders.


Management will maintain significant initial ownership in the Company after completion of this offering.

Our organizational structure following the offering and corporate reorganization is commonly referred to as an Up-C structure. Pursuant to this structure, following this offering we will hold a number of Atlas Units equal to the number of shares of Class A common stock issued and outstanding, and the Atlas Unitholders (other than us) will hold a number of Atlas Units equal to the number of shares of Class B common stock issued and outstanding. The Up-C structure was selected in order to (i) allow certain Legacy Owners the option to continue to hold their direct and indirect economic ownership in Atlas LLC in “pass-through” form for U.S. federal income tax purposes through their ownership of Atlas Units, and (ii) potentially allow us to benefit from certain net cash tax savings that we might realize as a result of certain increases in tax basis that may occur as a result of Atlas Inc.’s acquisition (or deemed acquisition for U.S. federal income tax purposes) of Atlas Units pursuant to the exercise of the Redemption Right or the Call Right. In contrast to many offerings by issuers choosing an Up-C structure, we have made the decision not to enter into a tax receivable agreement with the Legacy Owners with respect to any such cash tax savings we might realize, which we believe provides for increased alignment between us and our stockholders over the long term.

Assets and Operations

We currently control the largest and, we believe, the highest quality sand position in West Texas. We have developed our Kermit and Monahans facilities as in-basin proppant mines on approximately 38,000 surface acres that we own or lease in Winkler and Ward Counties, Texas. We control 14,575


140


Table of Contents

acres of large open-dune reserves and resources, which represent more than 70% of the total giant open dune acreage in the Winkler Sand Trend available for sand mining. The Monahans Dune consists of approximately 8,750 acres of premium open-dune reserves. Additionally, we have substantial off-dune acreage at Monahans that is not included in our estimated reserves or resources but that could be mined following our removal of material, such as soil and unusable sand, that lies above the useable sand and must be removed to excavate the useable sand, which we refer to as “overburden.” The Kermit Dune consists of approximately 5,826 acres of premium open-dune reserves.

The following map shows the location of our Kermit and Monahans facilities in Winkler and Ward Counties, Texas, as well as the secured right-of-way for the Dune Express alongside a recent snapshot of the rig count in the Permian Basin as of December 31, 2022:

Map of Operations


LOGO

Source: Enverus, Baker Hughes.

Our “twin” mines, located on the bookends of the Winkler Sand Trend, provide optimal logistics to serve both the Southern and Northern portions of the Delaware and Midland Basins and, as of December 31, 2022, have a combined annual production capacity of 10.0 million tons, 70,000 tons of dry storage, 700,000 tons of wet storage and 14 loadout lanes. Innovative plant design and large-scale operations ensure low-cost operations and continuity on site. Redundancies were designed into our facilities to remove singular points of failure that can disrupt the production process, ensuring maximum reliability of proppant production and delivery.


141


Table of Contents

Atlas’s Facilities are Strategically Located


LOGO

Source: Enverus. Baker Hughes.

Our Kermit and Monahans facilities were built to produce high quality 40/70-mesh and 100-mesh sands, each of which are used extensively in upstream operations in the Permian Basin. As of December 31, 2022, each facility is capable of producing 5.0 million tons of proppant annually for a combined annual production capacity of 10.0 million tons.

Each facility was constructed with a modular design that provides us with the flexibility to expand one or both of the existing facilities to achieve incremental production capacity if such expansion were found to be necessary or desirable in light of customer demand, broader market conditions or other relevant considerations. The facilities are capable of operating year-round and feature advanced safety designs, onsite water supply, power infrastructure and access to low-cost natural gas through connections to interstate natural gas lines. Further, we strategically benefit from the locations of our facilities proximal to major highways at the south and north ends of the Winkler Sand Trend. Our Kermit facility is bisected by two state highways, while our Monahans facility its adjacent to two highways, one of which is Interstate 20, facilitating efficient transportation of our proppant to customers located at various points within the Permian Basin.

The operations of both sand facilities are managed and monitored in a highly automated manner from our command center in Austin, Texas. We have designed and/or adopted cutting-edge technology that we believe delivers one of the most efficient production and truck loading processes in the industry. The remote ecosystem allows our employees to simultaneously manage processes at both facilities, resulting in significant personnel productivity gains.

As of December 31, 2022, we had 357 million tons of proven and probable sand reserves at our Kermit and Monahans facilities according to estimates by John T. Boyd Company, our independent mining


142


Table of Contents

engineers and geologists. Based on our current total annual expected production capacity of approximately 10.0 million tons as of December 31, 2022, our reserve life is expected to be approximately 36 years. As of December 31, 2022, our reserves are composed of approximately 59% 40/70-mesh and 41% 70/140-mesh substrate sand. We believe our reserve composition is attractive to customers that want to consolidate sourcing and positions us as a go-to provider of high quality in-basin proppant.

In response to the significant increase in market demand and also in connection with the expansion of our logistics offering, we are expanding our Kermit production capacity to add a facility capable of 5.0 million tons of annual production capacity by the end of 2023. Our plants were designed modularly to accommodate efficient expansion—maximizing the increase in production capacity while minimally increasing the facilities’ footprint.

Competitive Strengths

We believe the following competitive strengths will allow us to successfully execute our business strategies, achieve our primary business objectives and generate free cash flow, including:


Superior geology combined with next-generation plant design promotes efficiency & reliability.     Our Kermit and Monahans acreage holds a unique combination of key attributes that drive our differentiated business profile, including (i) unmatched scale of reserves and acreage within the two large open-dune deposits at the northern and southern ends of the Winkler Sand Trend, (ii) the associated high quality of proppant, (iii) the associated ease of access to our reserves and resources, (iv) the depth of our deposit, which provides a smaller areal footprint per ton produced, and (v) plentiful availability of water. We are not aware of any other area in the Permian Basin that is able to replicate this combination of key attributes. As of December 31, 2022, our combined facilities have 10.0 million tons of annual production capacity, two dredges, six dryers, 70,000 tons of onsite, finished-good storage, 14 dedicated truck loadout lanes with high-speed loadout silos, a comprehensive water recycling system at each plant, which allows us to reuse approximately 95% of the water used in the production process, and 700,000 tons of damp sand storage. Our facilities are capable of operating year-round and feature advanced safety designs, onsite water supply and recycling, power infrastructure and access to low-cost natural gas through connections to interstate natural gas lines.


High margins and strong balance sheet drive compelling combination of growth & yield.     Our margin profile has been tested through industry cycles, and we have demonstrated strong performance relative to our peers in both high and low proppant price environments. We maintain modest levels of debt and intend to continue to reduce our debt over time. Pro forma for this offering, as of December 31, 2022, we will have a Net Debt/LTM Adjusted EBITDA multiple of 0.3x. We are currently pursuing attractive growth projects and have been returning capital to stockholders. We plan to offer a balanced value proposition to stockholders that we believe will include growth and yield while maintaining financial flexibility and a strong balance sheet.


Unique logistics offering.    Our Dune Express and wellsite delivery assets hold the potential to revolutionize the delivery of proppant in the Permian Basin. By leveraging technology and infrastructure, we will increase asset utilization and payload per delivery resulting in increased efficiency and reliability for our customers. This will also reduce the miles driven on public roadways in the Permian Basin, which will improve the road safety in the basin.


Strategically located facilities.     Our facilities are located on the giant open dunes near Kermit and Monahans, Texas, that bookend the Winkler Sand Trend and enable us to reliably and efficiently meet the proppant demand of our customers in both the Delaware and Midland


143


Table of Contents
 

Basins. In addition, we strategically located our Kermit facility to be bisected by two state highways and positioned our Monahans facility adjacent to two highways to facilitate the efficient transportation of our proppant. Our Kermit facility’s location also provides a strategic origination point for the initial Dune Express, which will travel across the Texas-New Mexico state line area, one of the highest development intensity sections of the Permian Basin.


Strong brand recognition for reliability drives contracting and solidifies valuable relationships with a diverse group of customers.     The success of our business has been underpinned by our relationships with some of the most respected operators and service companies in the Permian Basin. Our customers range from high-profile, public oil and natural gas and service companies to private, independent enterprises. We also have a diverse customer base, which we believe minimizes counterparty risk. During the year ended December 31, 2022, we had 39 customers, with the top 10 customers accounting for approximately 68% of our revenue for that period. During the year ended December 31, 2021, we had 39 customers, with the top 10 customers accounting for approximately 79% of our revenue for that period. Our ability to secure and maintain these robust relationships lends support to our ability to weather economic headwinds. In 2020, we continued to operate throughout the height of the pandemic, grew sales volumes year over year from 2019 to 2020, and increased our market share, as we expanded our customer base by the addition of 14 new customers since January 1, 2020. While our contracting strategy changes over time and through industry cycles, we are currently highly contracted on our existing production capacity, which provides for significant visibility in our future revenue and cash flow. We plan to continue to pursue contracts when they stand to benefit our business over the long term.


Ability to leverage technology in optimizing cost structure and addressing our customer’s sustainable environmental progress (SEP) goals.     Our ability to generate cash flow in various commodity price environments and through industry cycles is underpinned by our commitment to the continuous optimization of our operating and capital cost structures. The move from traditional excavation methods to e-mining reduces the need for on-site personnel, heavy equipment and diesel fuel. Further, this technology also provides us the ability to enhance our customers’ SEP initiatives. Numerous employees once located on-site in the Permian Basin now work in a smaller group at our command center in Austin, Texas, monitoring and operating the facilities by video and telecom. This has led to cost reductions and also has enabled us to attract and retain an exceptionally credentialed workforce as compared to competitors with traditional operations that by nature do not provide such flexibility with respect to the location of personnel deployment.


Unique equity investor capitalization of the Company.      We are differentiated and advantaged by our unique equity investor capitalization. Rather than sourcing private equity capital, Bud Brigham funded the initial investments in us. Subsequently, we conducted a successful “friends and family” equity capital raise, which included many investors that had previously invested in Bud Brigham’s prior enterprises. Importantly, approximately 40 of our equity investors are energy entrepreneurs, energy executives and sophisticated energy investors, providing both a validation of the business and facilitating our growth. As a result, we are differentiated in our space with a diverse and sophisticated investor group that is aligned and actively supportive of our shareholder value creation objectives. Furthermore, the lack of traditional private-equity ownership has enabled us to elect to forgo a tax receivable agreement, which we believe provides for increased alignment between the Company and its stockholders over the long term. This is an example of the shareholder alignment we intend to instill through corporate governance policy.


Incentivized board of directors and management team with significant experience in the Permian Basin and a track record of stockholder value creation.     Our executive management team has a combined total of over 90 years of experience in the energy industry.


144


Table of Contents
 

This experience includes two successful IPOs, three successful company sales or mergers, multiple asset monetization events and the successful building of other enterprises. Please see the subsection titled “—Value Proposition to Our Stockholders—Management & Historical Successes” above. Management benefits from extensive experience in the Permian Basin, where our founder was born and raised, and he and other management members have extensive relationships built over a long history of involvement with various businesses in the region across upstream operations, non-operated enterprises, sand mine development, mineral acquisitions and water sourcing. We believe our management team’s experience managing upstream operations in the Permian Basin lends a unique perspective that provides us with a network of key potential customers, suppliers, vendors and employees, contributes to our ability to provide a high-quality customer experience and serves as a strong foundation for our role as a collaborative partner in meeting the advanced completion needs of our customers. Further, our management team has extensive experience in identifying attractive operating areas and evaluating resource potential through a variety of means, including extensive geologic studies; we believe this experience will continue to allow us to expand our operations by selectively pursuing organic development opportunities and innovations in the Permian Basin.


Proactive approach to the well-being of the environment and our employees.     Our voluntary agreement under the CCAA ensures that the USFWS will not require us to comply with conservation measures or impose any restrictions on our use of resources beyond those which we have already agreed. Our large acreage position also provides us with the flexibility to set aside as much as 17,000 acres of high suitability DSL habitat for conservation protection, which would exempt us from certain enrollment fees otherwise required under the CCAA. The smaller acreage position of many of our Permian Basin competitors may make similar set-asides commercially challenging for them. We believe that our voluntary participation under the CCAA will help to safeguard our assets and operations against adverse effects that could result from non-participation or any future listing of the DSL as an endangered species. We believe potential customers, focused on improving the sustainability profile of their own operations, value our proactive stance towards environmental risk management. As we focus on the well-being of the environment we operate in, we also focus on the well-being of our employees through initiatives such as our compensation and benefits package and Wyatt’s Lodge. We believe that this differentiated investment in our employees creates a culture of pride and ownership that fosters the positive disruptions and innovations our business successes are built on.

Business Strategies

Our principal business objective is to drive improvements to critical products and services in the Permian Basin through innovation which may reduce environmental impacts and optimize our cost structure, while driving notable value creation for our stockholders and stakeholders alike.


Continuously optimize cost structure in order to deliver free cash flow across commodity cycles.    Demand for services used in the development of unconventional resources in the United States varies notably based on the pace and intensity of such development, which is driven in large part by the prevailing commodity price environment. Since the beginning of 2020 through December 31, 2022, per-barrel prices of WTI crude oil exhibited substantial volatility ranging from $16.55 to $114.84, and we expect commodity prices to continue to be unpredictable going forward; as such, since our inception, we have continuously strived to optimize our cost structure and we believe we are able to provide our stockholders with a return of capital through cycles. For instance, substantial up-front investments were made in our Kermit and Monahans facilities and associated equipment in


145


Table of Contents
 

order for their design to maximize uptime and reliability. Our access to a natural water table near the surface of our deposit has allowed us to significantly lower our production costs through dredge mining. Our transition to e-mining, when fully completed is expected to result in reduced production costs, as we have seen historically when we have been able to use electric dredging as our primary mining method. In the future, the modular designs of our facilities will accommodate future expansions at a significantly reduced expense as compared to the conventionally designed facilities of our Permian Basin competitors.


Seek out opportunities to positively disrupt the market for products and services critical to unconventional resource development projects.     Innovation is central to our corporate culture, as it has been since the leadership role of certain members of our management team in the Bakken Formation’s evolution via Brigham Exploration, and we continuously strive to holistically improve unconventional resource development in the United States, particularly in the Permian Basin. We were a leader in the disruption in the proppant supply chain as early entrants into “in-basin” sand which eliminated the need for in excess of 1,000-mile train hauls from the midwestern United States and in excess of 250-mile truck hauls from central Texas, providing substantial economic and environmental benefits. More recently, we were the first to bring e-mining to the Permian Basin, and we are advancing our initiative to meaningfully electrify sand delivery operations in the Permian Basin through our Dune Express and autonomous wellsite delivery initiatives.


Use our unmatched scale to amplify innovation and disruptive technology to improve the unconventional resource supply chain.     Our Kermit and Monahans facilities represent a complete reinvention of the more traditional proppant production facility. Most proppant production facilities were historically located far from the point of consumption and therefore had long supply lines. Generally speaking, these facilities frequently experienced downtime on an unpredictable schedule. With the onset of in-basin sand, we recognized the need for our facilities to operate on a just-in-time delivery basis and took to redesigning the traditional facility to ensure that redundancy was built in at critical junctures to mitigate the effects of unplanned equipment downtime. Additional early measures included investments into the automation of our loadout lanes to drive down load times and the automation of many of our operations activities to improve efficiency and safety. More recently, we were the first, and currently the only, Permian Basin miner to partially electrify the mining of proppant through the use of electric dredges, and we plan to increase our electric dredge volumes over the next twelve to twenty-four months. Our Dune Express and wellsite delivery assets are the next positive major disruptions that we are bringing to the Permian Basin. As a positive disruptive industry technology, the Dune Express replaces much of the trucking haul with electric, conveyor-based transportation, which is likely to provide substantial SESP benefits, including a significant reduction in the emissions generated, relative to the traditional delivery of sand to customer wellsites due to the reduction in miles driven per ton of payload delivered. These strategic initiatives and other innovations are clear demonstrations of our commitment to evaluate and pursue strategies and technologies that positively disrupt our industry and continue to establish, maintain and optimize aspects of our business that provide distinct advantages over our competitors.


Grow business around anchor contracts with high quality counterparties. Innovation and the pursuit of additional projects like the Dune Express are central to our strategy, but they are only made possible by our relationships with high-quality, top-tier companies that operate in the Permian Basin. We have supply contracts in place with a variety of leading oil and natural gas and oilfield services companies, many of which are high-credit quality customers. The quality of our customer base is reflected in our collections rate over the year ended December 31, 2022, which exceeded 99.9%. We had similar collection rates for the years ended December 31, 2021, 2020 and 2019, which also exceeded 99.9%. We have signed sand supply and logistics


146


Table of Contents
 

contracts with major oil companies that includes the delivery of proppant by means of the Dune Express. While many factors influence the selection of proppant providers, we believe that our differentiated environmental profile, resulting from our major electrification projects, paired with our ability to reliably provide large volumes of quality proppant at attractive rates makes us a preferred partner for customers similarly prioritizing enhanced sustainability of operations and cost structure optimization.


Drive stockholder value creation by prioritizing our other stakeholders through sustainable environmental and social progress. We have recognized, from our founding, that long-term profitability for our stockholders can be achieved only by delivering positive outcomes for our other stakeholders—treating our employees well, executing as good stewards in the communities and the environments we do business in, and operating with the highest governance and diligence standards. Though many of our stakeholders are not owners of our business, they do have a meaningful influence in the success of our business. Therefore, to optimize value creation for our stockholders, we strive to provide attractive outcomes for our stakeholders.


Maintain a conservative financial profile in order to provide durable capital returns in a cyclical industry. The energy services business is historically cyclical, and we believe that a strong balance sheet and substantial liquidity are key, not only for the long-term health of the Company, but also for its ability to continuously return capital to its stockholders through-cycles. On a pro forma basis after giving effect to this offering, we expect to have approximately $                 million of cash on hand, $                 million available under the 2023 ABL Credit Facility, and $                 outstanding under our 2021 Term Loan Credit Facility. Further, we plan to continue making regular stockholder distributions as we transition into a public company, likely in the form of regular base dividends and potentially a combination of special dividends and share repurchases. Please see “Summary—Recent Developments—Cash Distribution” and the section titled “Dividend Policy.”


147


Table of Contents

Our Facilities

We currently operate our Kermit and Monahans facilities in Winkler and Ward Counties, Texas. The following map shows the location of both facilities:


LOGO


148


Table of Contents

Kermit, Texas

As of December 31, 2022, our Kermit mine had production capacity of 5.0 million tons and is located on 5,826 gross acres of land (of which 5,341 net acres are controlled by us either through lease or fee ownership) in Winkler County, Texas, with onsite processing and truck loading facilities. We commenced construction of our Kermit mine in October of 2017, and commenced operations in June 2018. Geographically, our Kermit facility is located at approximately 31° 58’ 6.29”N latitude and 103° O’ 39.46” W longitude and is situated approximately 7 miles northeast of Kermit, Texas, and is accessible via Texas State Highway 18. The Midland International Air and Space Port is located approximated 45 miles southeast of the facility. The facility’s primary utilities include three phase power, natural gas from an interstate transmission line and groundwater from onsite wells, all of which are present in sufficient quantities to sustainably support a facility producing in excess of 10 million tons annually. The facility was designed with redundancies to provide enhanced reliability and minimize the potential for bottlenecks throughout the processing and loadout operation.

The Kermit facility has 188.0 million tons of associated proven reserves as of December 31, 2022. The sand deposits generally range from 60 to over 100 feet thick and consist of 40/70-mesh and 100-mesh sand, with an anticipated production mix of approximately 30% 40/70-mesh and approximately 70% 100-mesh. The crush strength of the sand mined at the facility is between 7,000 to 8,000 pounds-per-square-inch (“PSI”) for 40/70-mesh and between 10,000 to 11,000 PSI for 100-mesh. Given the open-dune reserves and natural aquifer, sand is generally extracted from the mine through surface excavation through mining by electric dredge. The facility was constructed with a modular design that facilitates future expansion opportunities. The Kermit facility and has onsite transportation infrastructure capable of loading more than 35 trucks per hour on average.

We lease a portion of the reserves associated with our Kermit facility. In December 2017, we also entered into the Kermit Royalty Agreement providing Permian Dunes with an overriding royalty interest in revenues we receive from the sale of proppant mined from the reserves associated with our Kermit facility. Under the terms of the Kermit Royalty Agreement, the agreement would terminate in connection with the consummation of this offering. In contrast, the Monahans Lease, including the royalty payment obligations thereunder, will survive the consummation of this offering or any other Capital Event. See Please see “Certain Relationships and Related Party Transactions–Historical Transactions with Affiliates–Permian Dunes Holding Company, LLC” and “—Our Lease and Royalty Arrangements” for more information. We have received the material permits required to operate our Kermit facility from the Air Permits Division of the Texas Commission on Environmental Quality (the “TCEQ”), Winkler County, the MSHA and TxDOT. Please see “—Our Permits” for more information.

Monahans, Texas

As of December 31, 2022, our Monahans mine had production capacity of 5.0 million tons and is located on approximately 32,224 gross acres of land in Ward County, Texas, with onsite processing and truck loading facilities. We commenced construction of our Monahans mine in February of 2018 and commenced operations in October 2018. Geographically, our Monahans facility is located at approximately 31° 39’ 32.53” N latitude and 102° 52’ 55.46” W longitude and is situated approximately 3 miles northeast of Monahans, Texas, and is accessible via Texas State Highway 115 and Interstate 20. The Midland International Air and Space Port is located approximated 40 miles east of the facility. The facility’s primary utilities include three phase power from natural gas from an interstate transmission line and groundwater from onsite wells, all of which are present in sufficient quantities to sustainably support a facility producing in excess of 10 million tons annually. The facility was designed with redundancies to provide enhanced reliability and minimize the potential for bottlenecks throughout the processing and loadout operation.


149


Table of Contents

The Monahans facility has 113.5 million tons of associated proven reserves as of December 31, 2022. The sand deposits generally range from 60 to over 100 feet thick and consist of 40/70-mesh and 100-mesh sand, with an anticipated production mix of approximately 50% 40/70-mesh and approximately 50% 100-mesh. The crush strength of the sand mined at the facility is 7,000 to 8,000 PSI for 40/70-mesh and between 10,000 to 11,000 PSI for 100-mesh. Given the open-dune reserves and natural aquifer, sand is generally extracted from the mine through surface excavation through mining by electric dredge. The facility was constructed with a modular design that facilitates future expansion opportunities. The Monahans facility has onsite transportation infrastructure capable of loading more than 35 trucks per hour on average.

The rights and access to the mineral reserves associated with our Monahans operations are secured under the Monahans Lease with Permian Dunes. Please see “—Our Lease and Royalty Arrangements” for more information. We have received the material permits required to operate our Monahans facility from the TCEQ Air Permits Division, Ward County, MSHA and TxDOT. Please see “—Our Permits” for more information.

Our Products

We serve the oil and gas end markets, and our sand reserves contain deposits of fine grade 40/70-mesh and 100-mesh sizes that API specifies for use in wellsite fracturing operations. We believe that this mix of finer grade sand reserves is in higher demand and meets current industry preferences. Proppant from our Kermit and Monahans facilities is in our onsite silos before transport and delivery by truck to customers’ well sites located primarily in the Delaware and Midland Basins.

Our proppant is offered to our customers at the mine or as an integrated mine-to-wellhead solution. By providing access to an integrated logistics infrastructure, we are able to provide our customers with a solution-based approach.

Our Reserves

Information concerning our material mining properties in this prospectus has been prepared in accordance with the requirements of Subpart 1300 of Regulation S-K, which first became applicable to us for the fiscal year ended December 31, 2021. As used in this prospectus, the terms “mineral resource,” “mineral reserve,” “proven mineral reserve” and “probable mineral reserve” are defined and used in accordance with Subpart 1300 of Regulation S-K.

We categorize our mineral reserves as proven or probable based on the standards set by our independent mining engineers and geologists, John T. Boyd Company. We estimate that we had a total of approximately 357.4 million tons of proven and probable mineral reserves as of December 31, 2022. As of December 31, 2022, we had approximately 188.0 million tons of proven mineral reserves and 4.8 million tons of probable recoverable mineral reserves associated with our Kermit facility and approximately 113.5 million tons of proven mineral reserves and 51.1 million tons of probable recoverable mineral reserves associated with our Monahans facility. The quantity and nature of the mineral reserves at each of our properties are estimated by our internal geology department. We use drone surveys and three dimensional models to regularly update our reserve estimates, making necessary adjustments for operations and mine plans at each location during the year. Our internal reserve estimates are provided to John T. Boyd Company for review annually so that third-party approved additions or reductions can be made to our mineral reserves and mineral resource calculations due to ore extraction, additional drilling and delineation, property acquisitions and dispositions or quality adjustments. Before acquiring new mineral reserves, we perform surveying, drill core analysis and other tests to confirm the quantity and quality of the acquired mineral reserves.


150


Table of Contents

John T. Boyd Company has reviewed our December 31, 2022 mineral reserves, and we intend to continue retaining third-party engineers to review our mineral reserves on an annual basis.

We lease a portion of the mineral reserves associated with our Kermit facility and all of the mineral reserves associated with our Monahans facilities. As of December 31, 2022, we owned approximately 70% of our mineral reserves and leased approximately 30% of our mineral reserves from third-party landowners at our Kermit facility. To opine as to the economic viability of our mineral reserves, John T. Boyd Company reviewed our operating cost and revenue per ton data at the time of the proven reserve determination. The sand deposits at our facilities do not require crushing or extensive processing to eliminate clays or other contaminants, enabling us to cost-effectively produce high-quality proppant meeting API specifications.

Summary of Reserves

The following tables provide the tonnage and mesh size characteristics of the proven and probable mineral reserves associated with our Kermit and Monahans facilities as of December 31, 2022, based on $30.00 per ton. Since the commissioning of our wet plants in 2018 through the end of 2022, the actual process yield for both plants is approximately 90%. In general, for every 100 tons of run-of-mine material fed into the plant, 90 tons of saleable product is produced. It should be noted that these actual process yields are slightly different than the overall process yields used to estimate our mineral reserves and our mineral resources. Our mineral reserve estimates utilized the average of all of the core-hole laboratory analysis data for each of our Kermit and Monahans facilities, respectively.

Kermit Facility


     Tons By Classification and Mesh Size
(In thousands)
 
     Proven      Probable      By Mesh Size  

Control

   40/70      70/140      Total      40/70      70/140      Total      40/70      70/140      Total  

Owned

     78,433        56,554        134,987        —          —          —          78,433        56,554        134,987  

Leased

     28,580        24,433        53,013        2,599        2,232        4,831        31,179        26,665        57,844  


Total

     107,013        80,987        188,000        2,599        2,232        4,831        109,612        83,219        192,831  


Monahans Facility


     Tons By Classification and Mesh Size
(In thousands)
 
     Proven      Probable      By Mesh Size  

Control

   40/70      70/140      Total      40/70      70/140      Total      40/70      70/140      Total  

Leased

     70,053        43,454        113,507        32,041        19,057        51,098        102,094        62,511        164,605  

Combined Kermit and Monahans Facilities

The following table provides the tonnage and mesh size characteristics of the proven and probable mineral reserves associated with our Kermit and Monahans operations as of December 31, 2022, based on $30.00 per ton, presented on a combined basis.


     Tons By Classification and Mesh Size
(In thousands)
 
     Proven      Probable      Total  

Facility

   40/70      70/140      Total      40/70      70/140      Total      40/70      70/140      Total  

Kermit

     107,013        80,987        188,000        2,599        2,232        4,831        109,612        83,219        192,831  


151


Table of Contents
     Tons By Classification and Mesh Size
(In thousands)
 
     Proven      Probable      Total  

Facility

   40/70      70/140      Total      40/70      70/140      Total      40/70      70/140      Total  

Monahans

     70,053        43,454        113,507        32,041        19,057        51,098        102,094        62,511        164,605  


Total

     177,066        124,441        301,507        34,640        21,289        55,929        211,706        145,730        357,436  


Drilling density utilized by us to determine proven versus probable mineral reserves is based upon the relative characteristics of the mineral resource field evaluated, including the consistency and density of the mineral resource within the drilling core sample. The target drill-hole spacing utilized by our independent mining engineers and geologists, John T. Boyd Company, to estimate proven and probable mineral reserves are as follows:


Proven—less than or equal to 1,500 feet


Probable—less than or equal to 2,500 feet

Material Assumptions:

Estimates of frac sand reserves for our Kermit and Monahans operations were derived contemporaneously with estimates of frac sand resources. To derive an estimate of saleable product tons (proven and probable frac sand reserves), the following modifying factors were applied to the in-place measured and indicated frac sand resources underlying the respective mine plan areas:


A 95% mining recovery factor which assumes that 5% of the mineable (in-place) frac sand resource will not be recovered for various reasons. Applying this recovery factor to the in-place resource results in the estimated run-of-mine sand tonnage that will be delivered to the wet process plant.


Overall processing recoveries, based on exploration sample gradation testing, are 80.9% for the Kermit operation, and 87.6% for the Monahans operation. These recovery factors account for removal of out-sized (i.e. larger than 40-mesh and smaller than 140-mesh) sand and losses in the wet processing plant, and minor dry processing plant inefficiencies.

Further information can be found in Section 6.3.1 of our technical report summary prepared by John T. Boyd Company, which is filed as Exhibit 99.1 to the registration statement of which this prospectus forms a part.

Our Resources

A “mineral resource” is defined by Subpart 1300 of Regulation S-K as a concentration or occurrence of material of economic interest in or on the Earth’s crust in such form, grade or quality, and quantity that there are reasonable prospects for economic extraction. Further, mineral resource is a reasonable estimate of mineralization, taking into account relevant factors such as cut-off grade, likely mining dimensions, location or continuity, that, with the assumed and justifiable technical and economic conditions, is likely to, in whole or in part, become economically extractable. Subpart 1300 of Regulation S-K divides resources between “measured mineral resources” and “indicated mineral resources” and “inferred mineral resources,” which are defined as follows:


Measured mineral resources.    Resources for which quantity and grade or quality are estimated on the basis of conclusive geological evidence and sampling. The level of geological certainty associated with a measured mineral resource is sufficient to allow a qualified person to apply modifying factors, as defined in this section, in sufficient detail to support detailed mine


152


Table of Contents
 

planning and final evaluation of the economic viability of the deposit. Because a measured mineral resource has a higher level of confidence than the level of confidence of either an indicated mineral resource or an inferred mineral resource, a measured mineral resource may be converted to a proven mineral reserve or to a probable mineral reserve.


Indicated mineral resources.    Resources for which quantity and grade or quality are estimated on the basis of adequate geological evidence and sampling. The level of geological certainty associated with an indicated mineral resource is sufficient to allow a qualified person to apply modifying factors in sufficient detail to support mine planning and evaluation of the economic viability of the deposit. Because an indicated mineral resource has a lower level of confidence than the level of confidence of a measured mineral resource, an indicated mineral resource may only be converted to a probable mineral reserve.


Inferred mineral resources.    Resources for which quantity and grade or quality are estimated on the basis of limited geological evidence and sampling. The level of geological uncertainty associated with an inferred mineral resource is too high to apply relevant technical and economic factors likely to influence the prospects of economic extraction in a manner useful for evaluation of economic viability. Because an inferred mineral resource has the lowest level of geological confidence of all mineral resources, which prevents the application of the modifying factors in a manner useful for evaluation of economic viability, an inferred mineral resource may not be considered when assessing the economic viability of a mining project, and may not be converted to a mineral reserve.

The target drill-hole spacing utilized by our independent mining engineers and geologists, John T. Boyd Company, to estimate measured, indicated and inferred resources are as follows:


Measured – less than or equal to 1,500 feet


Indicated – greater than 1,500 feet, but less than or equal to 2,500 feet


Inferred – greater than 2,500 feet, but less than or equal to 5,000 feet

The following tables set forth the mineral resource estimates, exclusive of mineral reserves, associated with our Kermit and Monahans facilities as of December 31, 2021, based on $30.00 per ton. Since the commissioning of our wet plants in 2018 through the end of 2021, the actual process yield for both plants is approximately 90%. In general, for every 100 tons of run-of-mine (“ROM”) material fed into the plant, 90 tons of saleable product is produced. It should be noted that these actual process yields are slightly different than the overall process yields used to estimate our mineral reserves and our mineral resources. Our mineral reserve estimates utilized the average of all of the core-hole laboratory analysis data for each of our Kermit and Monahans facilities, respectively.

Kermit Facility


Resource Category

   Acres      Average Sand
Thickness (ft)
     Estimated In-Place Frac Sand Tons
(in thousands)
 
   Owned      Leased      Adverse      Total  

Measured

     65                  9,700               9,700  

Indicated

     603                  95,390               95,390  

Measured + Indicated

     668                  105,090               105,090  

Inferred

     1,719                            38,904        197,750        56,636        293,290  


Total

     2,387        79        38,904        302,840        56,636        398,380  


153


Table of Contents

Monahans Facility


Resource Category

   Acres      Average Sand
Thickness (ft)
     Estimated In-Place Frac Sand Tons
(in thousands)
 
   Owned    Leased      Total  

Measured

     454              64,144        64,144  

Indicated

     809              108,726        108,726  

Measured + Indicated

     1,263              172,870        172,870  

Inferred

     8,906                               1,093,869        1,093,869  


Total

     10,169        60           1,266,739        1,266,739  


As of December 31, 2021, our mineral resources are estimated at 1.665 billion tons (398 million tons at the Kermit facility and 1.267 billion tons at the Monahans facility). As of December 31, 2021, we leased a portion of the resources associated with our Kermit facility and all of the resources associated with our Monahans facility.

Material Assumptions:

Estimates of in-place frac sand resources for the Kermit and Monahans operations were prepared by performing the following tasks:


Available drilling logs and laboratory testing results were compiled and reviewed to check for accuracy and to support development of each operation’s geologic model. The geologic databases utilized for modeling and estimation consist of results from 61 drill holes completed on the Kermit property, and 80 drill holes completed on the Monahans property. The geologic data was imported into Carlson Software, a geologic modeling and mine planning software suite that is widely used and accepted by the mining industry.


A geologic model of each deposit was created in Carlson Software using industry-standard grid modeling methods well-suited for simple stratigraphic deposits. Each geologic model delineates the top and bottom of the mineable sand horizon and the distribution of the product size fractions across the deposits. The top and bottom of the mineable frac sand interval were established as follows:


As there is minimal overburden material across the subject properties, the top of the mineable sand interval was defined as the current ground surface, as provided by a combination of originally flown aerial topographic surveys and recently surveyed active mining pits.


The bottom of the mineable sand interval on both properties was determined by Westward geologists and geological technicians present during the various exploration and sampling campaigns. Westward defined the bottom of the mineable sand interval as the depth at which a drilled interval no longer contained sand as either the first or second most abundant material present.


After reviewing the continuity and variability of the deposit, suitable resource classification criteria were developed and applied.


Our Independent Mining Engineers then reviewed the proposed initial mining regions identified by Atlas Inc. management. Estimation of the in-place frac sand resources for the Kermit and Monahans properties assumes mining operations using a combination of standard surface excavation equipment for the near-surface initial operations and dredging equipment once initial excavation had reached appropriate depths. This sequence of operating is widely utilized


154


Table of Contents
 

for mining of similar deposit types. As such, the estimates were subject to the following setbacks and slope requirements:


50 ft inside of property lines.


100 ft from pipelines.


50 ft around the wet and dry process plant areas and main access road/right of way.


An overall pit wall slope of 3:1 (approximately 19 degrees).


In-place volumes for each property were estimated from the geologic model within Carlson Software. A dry, in-place, bulk density of 100 pounds per cubic foot was used to calculate the in-place tonnage of frac sand.

Further information can be found in Section 6.2.1 of our technical report summary prepared by John T. Boyd Company, which is filed as Exhibit 99.1 to the registration statement of which this prospectus forms a part.

Our Lease and Royalty Arrangements

We lease a portion of the mineral reserves associated with our Kermit operations and all of the mineral reserves associated with our Monahans operations. The rights and access to the mineral reserves associated with our Monahans operations are secured under a lease agreement (the “Monahans Lease”) with Permian Dunes Holding Company, LLC (“Permian Dunes”), a related party and our largest unitholder. In December 2017, we also entered into an agreement (the “Kermit Royalty Agreement”) providing Permian Dunes with an overriding royalty interest in revenues we receive from the sale of proppant mined from the mineral reserves associated with our Kermit facility.

Under the Monahans Lease and the Kermit Royalty Agreement, we make monthly royalty payments to Permian Dunes based on a percentage of our of gross monthly sales of proppant. The lease also includes an annual minimum royalty payment in any year of the term following the occurrence of certain specified transactions (a “Capital Event”). Our royalty payments are included in our cost of sales.

Under the terms of the Kermit Royalty Agreement, the agreement would terminate in connection with the consummation of this offering. In contrast, the Monahans Lease, including the royalty payment obligations thereunder, will survive the consummation of this offering or any other Capital Event.

Our Transportation Logistics and Infrastructure

We have established a last-mile logistics network that we believe positions us to be highly responsive to our customers’ needs. We believe providing a reliable mine-to-wellhead solution is important because it is the only way to assure customers certainty of supply and efficient delivered cost. Our focus on locating our Kermit and Monahans facilities within close proximity to prolific well activity enables us to deliver proppant directly to our customers’ wellheads using traditional pneumatic assets, portable silos, boxes or portable conveyance systems and significantly reduces handling costs and delivery lead times. The integrated nature of our logistics operations allows us to better serve oil and natural gas companies seeking more control over their well completion schedules and overall well performance by directly sourcing sand and limiting operational delays and wellhead costs.

Our Permits

We have obtained numerous federal, state and local permits required for operations at our Kermit and Monahans facilities. The Kermit and Monahans operations are predominantly regulated by the


155


Table of Contents

TCEQ with respect to environmental compliance. The predominant permitting requirement is an active NSR permit for air pollution control. Both of our operations have a current NSR permit which is renewable next in 2028. Other permits held by our operations include Stormwater, Above Ground Storage Tank, Aggregate Production Operation, and a septic permit. A spill prevention plan is also active at both operations.

While resources invested in securing permits are significant, this cost has not had a material adverse effect on our results of operations or financial condition. We cannot assure that existing environmental laws and regulations will not be reinterpreted or revised or that new environmental laws and regulations will not be adopted or become applicable to us. Revised or additional environmental requirements that result in increased compliance costs or additional operating restrictions could have a material adverse effect on our business.

Our Customers and Contracts

Customers

Our core customers include some of the most active and well capitalized oil and natural gas and oilfield services companies in the Permian Basin. We have signed several supply agreements, which mitigates our risk of non-performance by such customers. We provide our products and services to other customers on the spot market.

Contracts

We sell a portion of our produced volumes under supply agreements. As of December 31, 2022, on a volume basis, approximately     % of our production capacity for fiscal year 2022 was sold or is contracted under supply agreements during the year ended December 31, 2022. Certain of these agreements require the customer to purchase a specified percentage of its proppant requirements from us. Other agreements require the customer to purchase a minimum volume of proppant from us.

Certain of the Company’s contracts contain shortfall provisions that calculate agreed upon fees that are billed when the customer does not meet the minimum purchases over a period of time defined in each contract.

Our proppant is generally sold F.O.B. at our facilities, with title and risk of loss transferring to the customer when we load the proppant onto a truck for delivery to the customer. However, we frequently manage the distribution logistics for our customers and pass on the transportation and related logistics costs to them. Generally, our supply agreements contain customary termination provisions for matters such as bankruptcy-related events and uncured breaches of the applicable agreement.

We also enter into spot contract arrangements whereby we can elect to sell proppant to customers to the extent we have capacity available on our systems at the time of request. We refer to these volumes as spot volumes.

Competition

The market in which we operate is highly competitive. We compete with both public and private regional, local in-basin proppant providers, such as Covia Corp., High Roller Sand, Black Mountain Sand, Freedom Proppants, Hi-Crush Inc., U.S. Silica Inc., Signal Peak Silica, Alpine Silica, Badger Mining Corporation, Vista Proppants and Logistics and Capital Sand Company, among others. Competition in the proppant production industry is based on the geographic location of facilities,


156


Table of Contents

business reputation, operating reliability, available capacity and pricing arrangements for services rendered, among other factors. As we continue to grow our business and provide our services to new customers, we expect to continue to face increasing levels of competition. Our last-mile logistics business also competes with traditional providers of delivery services by truck.

Although some of our competitors may have a broader geographic scope and greater financial and other resources than we may have, we believe that we are competitively well positioned due to our reliability of supply, customer relationships, plant design, premium geology, sustainable environmental and social progress leadership and the proximity of our facilities to customers in the Permian Basin.

Cyclical Nature of Industry

We operate in a highly cyclical industry. The key factor driving demand for our services is the level of drilling activity by oil and natural gas companies, which in turn depends largely on current and anticipated future crude oil and natural gas prices and production depletion rates. Global supply and demand for oil and the domestic supply and demand for natural gas are critical in assessing industry outlook. Demand for oil and natural gas is cyclical and subject to large, rapid fluctuations. Producers tend to increase capital expenditures in response to increases in oil and natural gas prices, which generally results in greater revenues and profits for oilfield service companies such as ours. Increased capital expenditures also ultimately lead to greater production, which historically has resulted in increased supplies and reduced prices which in turn tend to reduce demand for oilfield services. For these reasons, the results of our operations may fluctuate from quarter to quarter and from year to year, and these fluctuations may distort comparisons of results across periods.

Seasonality

In general, seasonal factors do not have a significant and direct effect on our business. However, extreme weather conditions during parts of the year could adversely impact the well-completion activities of our customers, who are oil and natural gas operators, thereby reducing the amount of proppant sold. Our most notable decline in the demand of our product and services occurred in February 2021 as a result of the impact of Winter Storm Uri.

Insurance

We believe that our insurance coverage is customary for the industry in which we operate and adequate for our business. As is customary in the proppant industry, we review our safety equipment and procedures and carry insurance against most, but not all, risks of our business. Losses and liabilities not covered by insurance would increase our costs. To address the hazards inherent in our business, we maintain insurance coverage that includes physical damage coverage, third-party general liability insurance, employer’s liability, environmental and pollution and other coverage, although coverage for environmental and pollution-related losses is subject to significant limitations.

Environmental and Occupational Health and Safety Regulations

We are subject to stringent and complex federal, state and local laws and regulations governing the discharge of materials into the environment or otherwise relating to protection of worker health, safety and the environment and natural resources (including threatened and endangered species). Compliance with these laws and regulations may expose us to significant costs and liabilities and cause us to incur significant capital expenditures in our operations. Any failure to comply with these laws and regulations may result in the assessment of administrative, civil and criminal penalties,


157


Table of Contents

imposition of remedial obligations and the issuance of injunctions delaying or prohibiting operations. Private parties may also have the right to pursue legal actions to enforce compliance as well as to seek damages for non-compliance with environmental laws and regulations or for personal injury or property damage. In addition, the trend in environmental regulation has been to place more restrictions on activities that may affect the environment, and thus, any changes in, or more stringent enforcement of, these laws and regulations that result in more stringent and costly pollution control equipment, the occurrence of delays in the permitting or performance of projects, or waste handling, storage, transport, disposal or remediation requirements could have an adverse effect on our operations and financial position.

We do not believe that compliance by us and our customers with federal, state or local environmental laws and regulations will have an adverse effect on our business, financial position or results of operations or cash flows. We cannot assure you, however, that future events, such as changes in existing laws or enforcement policies, the enactment or promulgation of new laws or regulations or the development or discovery of new facts or conditions adverse to our operations will not cause us to incur significant costs. The following is a discussion of material environmental and worker health and safety laws, as amended from time to time, that relate to our operations or those of our customers that could have an adverse effect on our business.

Worker Health and Safety

We are subject to the requirements of the OSHA, and comparable state statutes that regulate the protection of the health and safety of workers. In addition, the OSHA hazard communication standard requires that information be maintained about hazardous materials used or produced in operations and that this information be provided to employees, state and local government authorities and the public. These laws and regulations are subject to frequent changes and any failure to comply with these laws could lead to the assertion of third-party claims against us, civil or criminal fines and changes in the way we operate our facilities, which one or more events could have an adverse effect on our financial position. Historically, our environmental compliance costs have not had an adverse effect on our results of operations.

Air Emissions

Our operations and the operations of our customers are subject to the CAA and related state and local laws, which restrict the emission of air pollutants and impose permitting, monitoring and reporting requirements on various sources. These regulatory programs may require preconstruction permitting, best available control technology analysis, the installation of emissions abatement equipment, modification of operational practices and obtaining permits or similar authorizations for our operations. Obtaining air emissions permits has the potential to delay the development or continued performance of our operations. Over the next several years, we may be required to incur certain capital expenditures for air pollution control equipment or to address air emissions-related issues as we expand our facilities or develop new ones. Changing and increasingly stricter requirements, future non-compliance or failure to maintain necessary permits or other authorizations could require us to incur substantial costs or suspend or terminate our operations. We could be subject to administrative, civil and criminal penalties as well as injunctive relief for noncompliance with air permits or other requirements of the CAA and comparable state laws and regulations.

Climate Change

In the United States, no comprehensive climate change legislation has been implemented at the federal level. However, following the U.S. Supreme Court finding that GHG emissions constitute a pollutant under the CAA, the EPA has adopted regulations that, among other things, establish


158


Table of Contents

construction and operating permit reviews for emissions from certain large stationary sources, require the monitoring and annual reporting of GHG emissions from certain petroleum and natural gas system sources in the United States, and together with the DOT, implement GHG emissions limits on vehicles manufactured for operation in the United States. It presently appears unlikely that comprehensive climate legislation will be passed by either house of Congress in the near future, although energy legislation and other regulatory initiatives are expected to be proposed that may be relevant to GHG emissions issues. For example in August 2022, U.S. Congress passed, and President Biden signed into law, the Inflation Reduction Act of 2022 which appropriates significant federal funding for renewable energy initiatives and, for the first time ever, imposes a fee on GHG emissions from certain facilities. The emissions fee and funding provisions of the law could increase the operating costs of our customers and accelerate the transition away from fossil fuels, which could in turn adversely affect our business and results of operations.

Additionally, various states and groups of states have adopted or are considering adopting legislation, regulations or other regulatory initiatives that are focused on such areas as GHG cap and trade programs, carbon taxes, reporting and tracking programs, and restriction of emissions. Internationally, the Paris Agreement requires member states to individually determine and submit non-binding emissions reduction targets every five years after 2020. President Biden has recommitted the United States to the Paris Agreement and, in April 2021, announced a goal of reducing the United States’ emissions by 50-52% below 2005 levels by 2030. In November 2021, the international community gathered again in Glasgow at COP26, during which multiple announcements were made, including a call for parties to eliminate certain fossil fuel subsidies and pursue further action on non-CO2 GHGs. Relatedly, while at COP26, the United States and European Union jointly announced the launch of the “Global Methane Pledge,” which aims to cut global methane pollution at least 30% by 2030 relative to 2020 levels, including “all feasible reductions” in the energy sector. Since its formal launch at COP26, over 150 countries have joined the pledge. The impacts of these orders, pledges, agreements and any legislation or regulation promulgated to fulfill the United States’ commitments under the Paris Agreement or other international climate conventions cannot be predicted at this time.

Governmental, scientific, and public concern over the threat of climate change arising from GHG emissions has resulted in increasing political risks in the United States, including climate change related pledges made by certain candidates elected to public office. President Biden has issued several executive orders focused on addressing climate change, including items that may impact our costs to produce, or demand for, oil and natural gas. Additionally, in November 2021, the Biden Administration released “The Long-Term Strategy of the United States: Pathways to Net-Zero Greenhouse Gas Emissions by 2050,” which establishes a roadmap to net zero emissions in the United States by 2050 through, among other things, improving energy efficiency; decarbonizing energy sources via electricity, hydrogen, and sustainable biofuels; and reducing non-CO2 GHG emissions, such as methane and nitrous oxide. Relatedly, in November 2021, the EPA issued a proposed rule under the CAA that was intended to reduce methane and VOC emissions from the oil and natural gas industry, and in particular the crude oil and natural gas source category, which includes crude oil and natural gas production, as well as natural gas processing, transmission, and storage facilities. In November 2022, the EPA announced a supplemental proposed rulemaking intended to strengthen and expand its November 2021 proposed rule, and to impose more stringent requirements on the natural gas and oil industry. The proposed rule is expected to be finalized in 2023. We cannot predict whether and in what form EPA will finalize these amendments; however, any additional regulation of air emissions from the crude oil and natural gas sector could result in increased expenditures for pollution control equipment, which could impact our customers’ operations and negatively impact our business. The Biden Administration is also considering revisions to the leasing and permitting programs for oil and natural gas development on federal lands. For more information, please see “Risk Factors—Risks Related to Environmental, Mining and Other Regulations—Any restrictions on oil and natural gas development on federal lands has the potential to adversely impact our operations and the operations


159


Table of Contents

of our customers.” Other actions that could be pursued may include the imposition of more restrictive requirements for the establishment of pipeline infrastructure or the permitting of LNG export facilities, as well as more strict GHG emission limitations for oil and natural gas facilities. Litigation risks are also increasing, as a number of entities have sought to bring suit against oil and natural gas companies in state or federal court, alleging, among other things, that such companies created public nuisances by producing fuels that contributed to climate change. Suits have also been brought against such companies under stockholder and consumer protection laws, alleging that companies have been aware of the adverse effects of climate change but failed to adequately disclose those impacts. To the extent these risks materially impact our customers, demand for our products may be reduced.

There are also increasing financial risks for fossil fuel producers as stockholders currently invested in fossil fuel energy companies may elect in the future to shift some or all of their investments into other sectors. Institutional lenders who provide financing to fossil fuel energy companies also have become more attentive to sustainable lending practices and some of them may elect not to provide funding for fossil fuel energy companies. For example, at COP26, GFANZ announced that commitments from over 550 firms around the world had resulted in over $130 trillion in capital committed to net zero goals. The various sub-alliances of GFANZ generally require participants to set short-term, sector-specific targets to transition their financing, investing, and/or underwriting activities to net zero emissions by 2050. There is also a risk that financial institutions will be required to adopt policies that have the effect of reducing the funding provided to the fossil fuel sector. Recently, President Biden signed an executive order calling for the development of a “climate finance plan” and, separately, the Federal Reserve has joined the Network for Greening the Financial System, a consortium of financial regulators focused on addressing climate-related risks in the financial sector. In November 2021, the Federal Reserve issued a statement in support of the efforts of the NGFS to identify key issues and potential solutions for the climate-related challenges most relevant to central banks and supervisory authorities. Limitation of investments in and financings for fossil fuel energy companies could result in the restriction, delay or cancellation of our customers’ drilling programs or development and production activities, as well as our own ability to access capital for our projects.

Additionally, in March 2022, the SEC proposed new rules relating to the disclosure of climate-related data, risks and opportunities, including financial impacts, physical and transition risks, related governance and strategy and GHG emissions, for certain public companies. We are currently assessing this rule but at this time we cannot predict the ultimate impact of the rule on our business or those of our customers. To the extent this rule is finalized as proposed, we or our customers could incur increased costs related to the assessment and disclosure of climate-related risks and certain emissions metrics. In addition, enhanced climate disclosure requirements could accelerate the trend of certain stakeholders and lenders restricting or seeking more stringent conditions with respect to their investments in certain carbon intensive sectors.

The adoption and implementation of new or more stringent international, federal or state legislation, regulations or other regulatory initiatives that impose more stringent standards for GHG emissions from the oil and natural gas sector or otherwise restrict the areas in which this sector may produce oil and natural gas or generate GHG emissions could result in increased costs of compliance or costs of consuming, and thereby reduce demand for, oil and natural gas. Additionally, political, litigation and financial risks may result in us or our customers’ restricting or cancelling production activities, incurring liability for infrastructure damages as a result of climatic changes, or having an impaired ability to continue to operate in an economic manner. One or more of these developments could have an adverse effect on our and our customers’ business, financial condition and results of operations.

As a final note, climate change could have an effect on the severity of weather (including hurricanes, droughts and floods), sea levels, the arability of farmland, water availability and quality, and meteorological patterns. If such effects were to occur, our operations and our customers’ development


160


Table of Contents

and production operations have the potential to be adversely affected. Potential adverse effects could include damages to our facilities from powerful winds or flooding in low lying areas, disruption of our and our customers’ operations either because of climate related damages to our facilities or in our costs of operation potentially arising from such climatic effects, less efficient or non- routine operating practices necessitated by climate effects or increased costs for insurance coverage in the aftermath of such effects.

Water Discharges

The CWA and analogous state laws impose restrictions and strict controls with respect to the discharge of pollutants, including spills and leaks of oil and other substances, into waters of the United States. The discharge of pollutants into regulated waters, including jurisdictional wetlands, is prohibited, except in accordance with the terms of a permit issued by the EPA or an analogous state agency. The CWA also prohibits the discharge of dredge and fill material in regulated waters, including wetlands, unless authorized by a permit issued by the U.S. Army Corps of Engineers (the “Corps”). Federal and state regulatory agencies can impose administrative, civil and criminal penalties, as well as require remedial or mitigation measures, for non-compliance with discharge permits or other requirements of the CWA and analogous state laws and regulations. In the event of an unauthorized discharge of wastes, we may be liable for penalties and costs.

The scope of regulated waters under the CWA has been subject to substantial controversy. In June 2015, the EPA and the Corps published a final rule attempting to clarify the federal jurisdictional reach over waters of the United States (“WOTUS”); however, following the change in U.S. presidential administrations, there have been several attempts to modify or eliminate this rule. For example, in January 2020, the EPA and the Corps finalized the Navigable Waters Protection Rule, which narrows the definition of “waters of the United States” relative to the WOTUS rule. However, legal challenges to both rules remain pending. In addition, the Biden administration has announced plans to develop its own definition of such waters, and the EPA and the Corps issued a proposed rule in November 2021 to revoke the Navigable Waters Protection Rule (“NWPR”) in favor of a pre-2015 definition until a new definition is proposed. In addition, in an April 2020 decision defining the scope of the CWA that was handed down just days after the NWPR was published, the U.S. Supreme Court held that, in certain cases, discharges from a point source to groundwater could fall within the scope of the CWA and require a permit. The Court rejected the EPA’s and Corps’ assertion that groundwater should be totally excluded from the CWA. The Court heard arguments on further litigation regarding the WOTUS definition in October 2022, with a decision expected in 2023. Therefore, the scope of jurisdiction under the CWA is uncertain at this time, and any increase in scope could result in increased costs or delays with respect to obtaining permits for such activities as dredge and fill operations in wetland areas. The process for obtaining permits has the potential to delay our operations. Spill prevention, control and countermeasure requirements of federal laws require appropriate containment berms and similar structures to help prevent the contamination of navigable waters by a petroleum hydrocarbon tank spill, rupture or leak. In addition, the CWA and analogous state laws require individual permits or coverage under general permits for discharges of storm water runoff from certain types of facilities. Federal and state regulatory agencies can impose administrative, civil and criminal penalties as well as other enforcement mechanisms for non-compliance with discharge permits or other requirements of the CWA and analogous state laws and regulations. The CWA and analogous state laws provide for administrative, civil and criminal penalties for unauthorized discharges and, impose rigorous requirements for spill prevention and response planning, as well as substantial potential liability for the costs of removal, remediation, and damages in connection with any unauthorized discharges.

Hydraulic Fracturing

We supply proppant to the oil and natural gas industry. Hydraulic fracturing is an important common practice that is used to stimulate production of oil and natural gas from low permeability


161


Table of Contents

hydrocarbon bearing subsurface rock formations. The hydraulic fracturing process involves the injection of water, proppant and chemicals under pressure into the formation to fracture the surrounding rock, increase permeability and stimulate production. Although we do not directly engage in hydraulic fracturing activities, our customers purchase our proppant for use in their hydraulic fracturing activities. Hydraulic fracturing is typically regulated by state oil and natural gas commissions and similar agencies; however, the EPA has asserted jurisdiction over hydraulic fracturing activities in some circumstances. The EPA has also promulgated air emission performance standards for production, processing, and transmission equipment in the oil and natural gas sector. The EPA also released a final report in December 2016 assessing the potential adverse impact of hydraulic fracturing to water resources, concluding that activities relating to water consumption, use and disposal associated with hydraulic fracturing may impact drinking water resources under certain circumstances. To date, EPA has taken no further action in response to the December 2016 report. Some states have adopted, and other states are considering adopting, regulations that could impose new or more stringent permitting, disclosure or well construction requirements on hydraulic fracturing operations. State and federal regulatory agencies have also recently focused on a possible connection between the operation of injection wells used for oil and natural gas waste disposal and seismic activity. Similar concerns have been raised that hydraulic fracturing may also contribute to seismic activity. Aside from state laws, local land use restrictions may restrict drilling in general or hydraulic fracturing in particular. Municipalities may adopt local ordinances attempting to prohibit hydraulic fracturing altogether or, at a minimum, allow such fracturing processes within their jurisdictions to proceed but regulating the time, place and manner of those processes. At the same time, certain environmental groups have suggested that additional laws may be needed to more closely and uniformly limit or otherwise regulate the hydraulic fracturing process, and legislation has been proposed by some members of Congress to provide for such regulation.

The adoption of new laws or regulations at the federal or state levels imposing reporting obligations on, or otherwise limiting or delaying, the hydraulic fracturing process could make it more difficult to complete natural gas wells, increase our customers’ costs of compliance and doing business and otherwise adversely affect the hydraulic fracturing services they perform, which could negatively impact demand for our proppant. In addition, heightened political, regulatory and public scrutiny of hydraulic fracturing practices could expose us or our customers to increased legal and regulatory proceedings, which could be time-consuming, costly or result in substantial legal liability or significant reputational harm. We could be directly affected by adverse litigation involving us, or indirectly affected if the cost of compliance limits the ability of our customers to operate. Such costs and scrutiny could directly or indirectly, through reduced demand for our proppant, have an adverse effect on our business, financial condition and results of operations.

Non-Hazardous and Hazardous Wastes

The Resource Conservation and Recovery Act (“RCRA”) and comparable state laws control the management and disposal of hazardous and non-hazardous waste. These laws and regulations govern the generation, storage, treatment, transfer and disposal of wastes that we generate. In the course of our operations, we generate waste that are regulated as non-hazardous wastes and hazardous wastes, obligating us to comply with applicable standards relating to the management and disposal of such wastes. In addition, drilling fluids, produced waters and most of the other wastes associated with the exploration, development and production of oil or natural gas, if properly handled, are currently exempt from regulation as hazardous waste under RCRA and, instead, are regulated under RCRA’s less stringent non-hazardous waste provisions, state laws or other federal laws. However, it is possible that certain oil and natural gas drilling and production wastes now classified as non-hazardous could be classified as hazardous wastes in the future. A loss of the RCRA exclusion for drilling fluids, produced waters and related wastes could result in an increase in our customers’ costs to manage and dispose of generated wastes and a corresponding decrease in their drilling operations, which developments could have an adverse effect on our business.


162


Table of Contents

Site Remediation

CERCLA and comparable state laws impose strict, joint and several liability on certain classes of persons that contributed to the release of a hazardous substance into the environment without regard to fault or the legality of the original conduct. These persons include the owner and operator of a disposal site where a hazardous substance release occurred and any company that transported, disposed of or arranged for the transport or disposal of hazardous substances released at the site. Under CERCLA, such persons may be liable for the costs of remediating the hazardous substances that have been released into the environment, for damages to natural resources and for the costs of certain health studies. In addition, where contamination may be present, it is not uncommon for the neighboring landowners and other third parties to file claims for personal injury, property damage and recovery of response costs. We have not received notification that we may be potentially responsible for cleanup costs under CERCLA at any site.

Endangered Species

The ESA restricts activities that may affect endangered or threatened species or their habitats. Similar protections are offered to migratory birds under the MBTA. New or proposed listings of threatened or endangered species has the potential to adversely impact our future operations. For example, the DSL, which is found only in the active and semi-stable shinnery oak dunes of southeastern New Mexico and adjacent portions of Texas (including areas where our proppant production facilities are located), was a candidate species for listing under the ESA by the USFWS for many years. In 2010, the USFWS proposed listing the DSL as an endangered species under the ESA. In response, the Texas Comptroller’s office created the Texas Conservation Plan in 2012 to minimize disturbances to the DSL’s habitat. In June 2012, the USFWS declined to list the species as endangered under the ESA in part due to oil and natural gas operators and private landowners in the Permian Basin entering into CCAs, whereby parties voluntarily agree to implement mitigation measures, such as habitat avoidance or time and manner operating restrictions so as not to adversely impact the DSL habitat. Recently, however, as a result of increased proppant mining by parties who are not currently parties to CCAs, the Texas Comptroller’s Office, USFWS, and environmental groups have voiced concerns about the potential destruction of DSL habitat and harm to the species. This ultimately led to renewed calls to USFWS to list the DSL under the ESA and a twelve-month review is currently pending to determine whether the DSL should be listed. On November 17, 2021, one environmental organization delivered a Sixty-day Notice of Intent to Sue to the DOI and the USFWS for failing to timely list the DSL as endangered. Then, in August 2022, the USFWS agreed, via a stipulated settlement agreement in a federal district court, to make an endangerment or threatened listing determination for the DSL by June 29, 2023. If the DSL is ultimately listed as an endangered or threatened species, our operations and the operations of our customers could be further limited, delayed or, in some circumstances, prohibited altogether, as a result of the imposition of additional restrictions designed to protect the DSL imposed at the time of any listing, and we and our customers could be required to comply with expensive mitigation measures intended to protect the DSL and its habitat. However, in January 2021, USFWS approved a CCAA for the DSL. We were a contributor to and supporter of the CCAA since its inception and have since been accepted into the program. Our participation in the CCAA and our other voluntary conservation measures for the benefit of the DSL reduces the risk of disruptions to our business and operations in the event the DSL is listed. Another species whose recent listing could impact the operations of our customers is the Lesser Prairie-Chicken. In November 2022, the USFWS formally listed two DPSs of the lesser prairie-chicken under the ESA. The Southern DPS, the habitat of which includes portions of southeast New Mexico and western Texas, was listed as endangered, while the Northern DPS, the habitat of which spans from northern Texas, through eastern Oklahoma, and intro southeastern Colorado and southwester Nebraska, was listed as threatened. The listed territory of the Southern DPS could overlap with the operating areas of some our customers, who in turn may be adversely affected by any restrictions


163


Table of Contents

which arose as a result of the endangerment determination. To the extent species are listed under the ESA or similar state laws, or are protected under the MBTA, or previously unprotected species are designated as threatened or endangered in areas where we or our customers operate, this could cause us or our customers to incur increased costs arising from species protection measures and could result in delays or limitations in our or our customers’ performance of operations, which could adversely affect or reduce demand for our proppant solutions.

Mining and Workplace Safety

Our proppant production operations will be subject to mining safety regulation. MSHA is the primary regulatory organization governing proppant mining and processing. Accordingly, MSHA regulates quarries, surface mines, underground mines and the industrial mineral processing facilities associated with and located at quarries and mines. The mission of MSHA is to administer the provisions of the Federal Mine Safety and Health Act of 1977 and to enforce compliance with mandatory miner safety and health standards. As part of MSHA’s oversight, representatives perform at least two unannounced inspections annually for each above-ground facility. Failure to comply with MSHA’s regulations could result in the imposition of civil or criminal penalties and fines.

In addition, our operations are subject to a number of federal and state laws and regulations, including the OSHA and comparable state statutes, whose purpose is to protect the health and safety of workers. Also, OSHA hazard communication standard, the EPA community right-to-know regulations under Title III of the federal Superfund Amendment and Reauthorization Act and comparable state statutes require that information be maintained concerning hazardous materials used or produced in operations and that this information be provided to employees, state and local government authorities and citizens. Violations of OSHA can result in OSHA civil and criminal enforcement. Moreover, the inhalation of respirable crystalline silica is associated with the lung disease silicosis. There is recent evidence of an association between crystalline silica exposure or silicosis and lung cancer and a possible association with other diseases, including immune system disorders such as scleroderma. These health risks have been, and may continue to be, a significant issue confronting the silica industry. In response to these potential concerns, OSHA promulgated a new rule seeking to lower work exposure to crystalline silica. The rule became effective for general industry in 2018. In June 2022, MSHA launched a new enforcement initiative to better protect U.S. miners from health hazards resulting from repeated overexposure to respirable crystalline silica. For more information, please see our Risk Factor titled “Silica-related health issues and legislation, including compliance with existing or future regulations relating to respirable crystalline silica, or litigation could have an adverse effect on our business, reputation or results of operations.”

In addition, concerns over silicosis and other potential adverse health effects, as well as concerns regarding potential liability from the use of silica, may have the effect of discouraging our customers’ use of our silica products and discouraging our insurers from risk. The actual or perceived health risks of mining, processing and handling silica could adversely affect silica producers, including us, through reduced use of silica products, the threat of product liability or employee lawsuits, increased scrutiny by federal, state and local regulatory authorities of us and our customers or reduced financing sources available to the silica industry.

Environmental Reviews

If permits or other authorizations from the federal government are required, our future operations may be subject to broad environmental review under the National Environmental Policy Act, as amended (“NEPA”). NEPA requires federal agencies to evaluate the environmental impact of all “major federal actions” significantly affecting the quality of the human environment. The granting of a federal permit for a major development project, such as a proppant production operations, may be considered


164


Table of Contents

a “major federal action” that requires review under NEPA. As part of this evaluation, the federal agency considers a broad array of environmental impacts, including, among other things, impacts on air quality, water quality, wildlife (including threatened and endangered species), historic and archeological resources, geology, socioeconomics and aesthetics. NEPA also requires the consideration of alternatives to the project. The NEPA review process, especially the preparation of a full environmental impact statement, can be time consuming and expensive. The purpose of the NEPA review process is to inform federal agencies’ decision-making on whether federal approval should be granted for a project and to provide the public with an opportunity to comment on the environmental impacts of a proposed project. Though NEPA requires only that an environmental evaluation be conducted and does not mandate a particular result, a federal agency could decide to deny a permit or impose certain conditions on its approval, based on its environmental review under NEPA, or a third party could challenge the adequacy of a NEPA review and thereby delay the issuance of a federal permit or approval, which could have an adverse effect on our business. For more information, please see Risk Factors—“Risks Related to Environmental, Mining and Other Regulations—Any restrictions on oil and natural gas development on federal lands has the potential to adversely impact our operations and the operations of our customers.”

Motor Carrier Operations

Among the services we provide, we operate as a motor carrier and therefore are subject to regulation by DOT and various state agencies. These regulatory authorities exercise broad powers, governing activities such as the authorization to engage in motor carrier operations; regulatory safety; hazardous materials labeling, placarding and marking; financial reporting; and certain mergers, consolidations and acquisitions. There are additional regulations specifically relating to the trucking industry, including testing and specification of equipment and product handling requirements. The trucking industry is subject to possible regulatory and legislative changes that may affect the economics of the industry by requiring changes in operating practices or by changing the demand for common or contract carrier services or the cost of providing truckload services. Some of these possible changes include increasingly stringent environmental regulations, changes in the hours of service regulations which govern the amount of time a driver may drive in any specific period and requiring onboard black box recorder devices or limits on vehicle weight and size.

Interstate motor carrier operations are subject to safety requirements prescribed by DOT. Intrastate motor carrier operations are subject to safety regulations that often mirror federal regulations. Such matters as weight and dimension of equipment are also subject to federal and state regulations. DOT regulations also mandate drug testing of drivers. From time to time, various legislative proposals are introduced, including proposals to increase federal, state or local taxes, including taxes on motor fuels, which may increase our costs or adversely impact the recruitment of drivers. We cannot predict whether, or in what form, any increase in such taxes applicable to us will be enacted.

State and Local Regulation

We are subject to a variety of state and local environmental review and permitting requirements. In some cases, the state environmental review may be more stringent than the federal review. Our operations may require state-law based permits in addition to federal permits, requiring state agencies to consider a range of issues, many the same as federal agencies, including, among other things, a project’s impact on wildlife and their habitats, historic and archaeological sites, aesthetics, agricultural operations and scenic areas. The development of new sites and our existing operations also are subject to a variety of local environmental and regulatory requirements, including land use, zoning, building and transportation requirements.


165


Table of Contents

Demand for proppant in the oil and natural gas industry drove a significant increase in the production of proppant. As a result, some local communities expressed concern regarding silica sand mining operations. These concerns have generally included exposure to ambient silica sand dust, truck traffic, water usage and blasting. In response, certain state and local communities have developed or are in the process of developing regulations or zoning restrictions intended to minimize dust from becoming airborne, control the flow of truck traffic, significantly curtail the amount of practicable area for proppant production activities, provide compensation to local residents for potential impacts of proppant production activities and, in some cases, ban issuance of new permits for proppant production activities. To date, we have not experienced any material impact to the development of our proppant production facilities and do not anticipate an impact on future operations as a result of these types of concerns. We would expect this trend to continue as oil and natural gas production increases.

Occupational Safety and Health and other Legal Requirements

We are subject to the requirements of the OSHA and comparable state statutes whose purpose is to protect the health and safety of workers. In addition, the OSHA’s hazard communication standard, the EPA’s Emergency Planning and Community Right-to-Know Act and comparable state regulations and any implementing regulations require that we organize and/or disclose information about hazardous materials used or produced in our operations and that this information be provided to employees, state and local governmental authorities and citizens. We have an internal program of inspection designed to monitor and enforce compliance with worker safety requirements.

Human Capital and Employees

Our employees are a critical asset which are key to our innovative culture and overall success. We are focused on our high-performance culture through attracting, engaging, developing, retaining and rewarding top talent. We strive to enhance the economic and social well-being of our employees and the communities in which we operate. We are committed to providing a welcoming, inclusive environment for our workforce, with best-in-class training and career development opportunities to enable employees to thrive and achieve their career goals.

As of December 31, 2022, we had a total of 371 employees, of which 108 service our corporate function headquarters and 263 work in field locations. We foster a culture of diversity and inclusivity, and greater than approximately 64% of our workforce is minority and/or female as of December 31, 2022. None of our employees are represented by labor unions or subject to collective bargaining agreements. We consider our employee relations to be good.

Health and Safety

The health, safety, and well-being of our employees is of the utmost importance. We are an industry leader with a proven track record in safety.

We provide employees the option to participate in health and welfare plans, including medical, dental, life, accidental death and dismemberment and short-term and long-term disability insurance plans. We also offer a number of health and wellness programs, including telemedicine, health screens and fitness reimbursement as well as access to the Employee Assistance Program which provides employees and their family members access to professional providers to help navigate challenging life events 24 hours a day/365 days a year.

In response to COVID-19, we adopted enhanced safety measures and practices to protect employee health and safety and continue to follow guidelines from the Centers for Disease Control to protect our employees and minimize the risk of business disruption.


166


Table of Contents

Legal Proceedings

From time to time we may be involved in litigation relating to claims arising out of our operations in the normal course of business. We are not currently a party to any legal proceedings that we believe would have an adverse effect on our financial position, results of operations or cash flows and are not aware of any material legal proceedings contemplated by governmental authorities.


167


Table of Contents

MANAGEMENT

Set forth below are the names, positions and descriptions of the business experience of our executive officers, directors and director nominees:


Name

   Age   

Position with Atlas Energy Solutions Inc.

Ben M. “Bud” Brigham

   63    Executive Chairman, Chief Executive Officer and Director

John Turner

   51    President and Chief Financial Officer

Chris Scholla

   39    Chief Supply Chain Officer

Dathan C. Voelter

   51    General Counsel and Secretary

Jeffrey Allison

   59    Executive Vice President, Sales & Marketing

Gayle Burleson

   57    Director Nominee

Stephen C. Cole

   62    Director Nominee

Stacy Hock

   45    Director Nominee

A. Lance Langford

   60    Director Nominee

Mark P. Mills

   70    Director Nominee

Douglas Rogers

   63    Director Nominee

Robb L. Voyles

   65    Director Nominee

Directors and Executive Officers

Ben M. “Bud” Brigham—Executive Chairman, Chief Executive Officer and Director. Ben M. “Bud” Brigham is our founder and has served as the Executive Chairman of our board of directors since our inception and as our Chief Executive Officer since August 2022. Mr. Brigham has founded several upstream energy enterprises, including Brigham Exploration in 1990, which completed its IPO in 1997. Mr. Brigham served as its President, Chief Executive Officer and Chairman of the board of directors until its sale to Statoil in December 2011.

In 2012 Mr. Brigham founded Anthem Ventures, LLC, a family office. In that same year he and others founded Brigham Resources, which was subsequently sold to Diamondback (NASDAQ: FANG) in 2017. In 2012 he also co-founded Brigham Minerals to pursue mineral acquisitions in top-tier domestic shale resource plays. Brigham Minerals completed its IPO in 2019, and Mr. Brigham served as its Executive Chairman until its merger with Sitio Royalties (NYSE: STR) in 2022.

In 2017 Mr. Brigham founded Brigham Exploration Company, LLC (the second entity founded by Mr. Brigham with such name) (“Brigham Exploration LLC”), a non-operating company focused on the Permian Basin. BEXP I, LP (“BEXP I”) was initially funded with Mr. Brigham’s capital, with subsequent investments by friends and family and a large institution. In the fourth quarter of 2021, new acreage and working interest acquisitions ceased in BEXP I, and BEXP II, LP commenced acreage and working interest acquisitions, with a larger capitalization including most of the BEXP 1 participants as well as additional institutions.

In 2022 he was a co-founder of Langford Energy Partners LLC, which pursues the acquisition, development and optimization of operated oil and gas properties in top-tier shale resource plays.

Prior to founding Brigham Exploration in 1990, Mr. Brigham served for six years as an exploration geophysicist with Rosewood Resources, Inc., an independent oil and natural gas exploration and production company, and as a seismic data processing geophysicist for Western Geophysical, a provider of 3-D seismic services. Mr. Brigham earned a Bachelor of Science in Geophysics from the University of Texas at Austin. Mr. Brigham is a member of the National Petroleum Council, The Bureau of Economic Geology Visiting Committee and the University of Texas Chancellor’s Council Executive Committee. Mr. Brigham was inducted into the All American Wildcatters in April 2012.


168


Table of Contents

Mr. Brigham was selected to serve on the board of directors due to his knowledge in the industry and leadership of our Company since its inception.

John Turner—President and Chief Financial Officer.    John Turner has served as our Chief Financial Officer since April 2017 and our President since November 2022. Mr. Turner has over 20 years of oil and natural gas industry experience. Prior to assuming his current role, Mr. Turner worked in various capacities for both public and private entities, with a focus on corporate finance, business development and strategic planning, including as Chief Financial Officer of Brigham Exploration LLC, Chief Financial Officer of Mediterranean Resources, LLC and Vice President of Brigham Exploration Company. Collectively, Mr. Turner has participated and advised on over $2.0 billion of capital market transactions, including mergers, restructurings and special situations. Mr. Turner received a Bachelor of Business Administration and a Masters of Business Administration from the McCombs School of Business at the University of Texas at Austin.

Chris SchollaChief Supply Chain Officer.    Chris Scholla currently serves as our Chief Supply Chain Officer and served previously as our Vice President of Supply Chain and Logistics from November 2017 until his promotion to his current role in November of 2022. Mr. Scholla is responsible for our end-to-end supply chain operations, as well as customer service and support. Mr. Scholla led our entry into the oilfield logistics market in 2019 and oversees our strategic logistics growth initiatives. Prior to joining us in 2017, Mr. Scholla worked at Hexion Inc. and DuPont de Nemours, Inc. (NYSE: DD) in a number of business strategy, supply chain, procurement and operations roles. Mr. Scholla has over a decade of proppant experience and almost 20 years of global supply chain experience. He holds a bachelor’s degree in Supply Chain & Information Systems from The Pennsylvania State University and a Master of Business Administration with concentrations in operations and finance from the College of William & Mary. He also currently serves on the Board of Directors of the Permian Road Safety Coalition.

Dathan C. VoelterGeneral Counsel and Secretary.    Dathan C. Voelter currently serves as our General Counsel and Secretary and served previously as our Deputy General Counsel and Secretary from April 2019 until his promotion to his current role in December 2021. Prior to joining us, Mr. Voelter served as Managing Counsel and Assistant Secretary of Andeavor and its midstream subsidiary Andeavor Logistics LP from September 2017 until February 2019, shortly after they were acquired by Marathon Petroleum Corp. (NYSE: MPC). Mr. Voelter also served as Associate General Counsel and Chief Compliance Officer of Itron, Inc. (NASD: ITRI) from 2016 to 2017 and held various executive leadership roles at Freescale Semiconductor Ltd. (NYSE: FSL) including Vice President and Chief Securities, Ethics and Compliance Counsel from 2005 until 2016, shortly after Freescale was acquired by NXP Semiconductors N.V. (NASDAQ: NXPI). Previously, Mr. Voelter was an attorney with Vinson & Elkins L.L.P. and he started his professional career as a public accountant with Coopers & Lybrand, L.L.P. Mr. Voelter received a Bachelor of Business Administration in International Business from the University of Texas at Austin and a Doctor of Jurisprudence summa cum laude from Baylor University School of Law.

Jeffrey Allison—Executive Vice President, Sales & Marketing.    Jeffrey Allison has served as our Executive Vice President, Sales & Marketing since May 2022. Prior to joining us, Mr. Allison served as President of Allison Energy Consulting, LLC from July 2020 until May 2022. Mr. Allison also served in various roles with Halliburton Company (NYSE: HAL) over a 20-year period, including Mid-Continent Area Vice President from May 2018 until March 2020, where he led Halliburton Company’ business delivery in the area with accountability over business development (sales), operations, financial performance, HSE, capital execution and personnel development, and Executive Account Vice President from June 2010 until April 2018, where he provided oversight of strategic clients and accountability of all geographies, products & services, technology and commercial growth. Previously, Mr. Allison held various leadership and strategic roles with Baker Hughes INTEQ GmbH, Afognak


169


Table of Contents

Native Corporation and ConocoPhillips (NYSE: COP) both domestically and internationally and served on several industry advisory boards throughout his career. Mr. Allison currently sits on the Industry Advisory Board of Directors for the University of Oklahoma, and has sat on several industry advisory boards, including the Petroleum Alliance of Oklahoma and the Petroleum Equipment & Services Association of Oklahoma. Mr. Allison received a Bachelor of Science in Petroleum Engineering from the Colorado School of Mines.

Gayle Burleson—Director Nominee.    Gayle Burleson will be appointed to serve as a director of our board of directors in connection with this offering. Ms. Burleson served as a director of Brigham Minerals from January 2022 until its merger with Sitio Royalties (NYSE: STR) in December 2022, where she currently serves on the board of directors. Ms. Burleson has served as a director for Select Energy Services, Inc. since 2021, and previously served as a director for privately held Chisholm Energy Holdings, LLC from May 2021 until its acquisition by Earthstone Energy, Inc. (NYSE: ESTE) in February 2022. Ms. Burleson was most recently with Concho Resources Inc. (NYSE: CXO) (“Concho”) as the Senior Vice President of Business Development and Land and held that position from May 2017 until Concho’s acquisition by ConocoPhillips in January 2021. She was employed for 15 years at Concho in various roles and capacities with ever-increasing leadership responsibilities. Prior to joining Concho , Ms. Burleson served in a number of engineering and operations positions with BTA Oil Producers, LLC, Mobil Oil Corporation, Parker & Parsley Petroleum Company and Exxon Corporation. Ms. Burleson received her B.S. in Chemical Engineering from Texas Tech University. Ms. Burleson was selected to serve on our board of directors in light of her knowledge of the energy industry.

Stephen C. ColeDirector Nominee.    Stephen C. Cole will be appointed to serve as a director of our board of directors in connection with this offering. Mr. Cole is an entrepreneur who has led and managed his own businesses in the oil and gas industry since 1982. These businesses include CXC Operating, LLC and Champion Exploration, LP, private energy-exploration companies specializing in the Barnett Shale and 3D seismic throughout Texas and Louisiana, where he has served as President since 2001, Champion Lone Star, LLC, a private exploration & production company operating in Central Basin Platform and Delaware Basin, where he has served as President since 2004, and S. Cole Holdings, LP, where he has served as President since 2014. Mr. Cole pursued his bachelor’s degree in Business Administration from Texas Tech University. Mr. Cole was selected to serve on our board of directors in light of his knowledge of the energy industry and familiarity with our predecessor, Atlas LLC.

Stacy HockDirector Nominee.    Stacy Hock will be appointed to serve as a director of our board of directors in connection with this offering. Since 2008, Ms. Hock has been a private investor and philanthropist. Ms. Hock served on the board of directors for Brigham Minerals from January 2022 until its merger with Sitio Royalties (NYSE: STR) in December 2022. Since 2015, Ms. Hock has served on the boards of Aminex Therapeutics, a privately held clinical stage drug development company, and the Texas Public Policy Foundation. She has also served for the last ten years on the board of the African Dream Initiative. Since 2016, she has served on multiple boards associated with the University of Texas, including the Blanton Museum of Art National Leadership Board and The University of Texas at Austin McCombs MBA Advisory Board. In 2021, Ms. Hock joined the University of Austin Board of Advisors. Ms. Hock previously held senior management positions in the software industry, including IBM’s WebSphere Software Services business. Ms. Hock received her B.S. in Computer Science and Electrical Engineering from the Massachusetts Institute of Technology, and her M.B.A from the University of Texas in Austin. Ms. Hock was selected to serve on the Board due to her finance and investment experience as a private investor.

A. Lance LangfordDirector Nominee.    A. Lance Langford will be appointed to serve as a director of our board of directors in connection with this offering. Mr. Langford has served as a director of our predecessor, Atlas LLC, since 2018, and previously served as a director of Brigham Minerals


170


Table of Contents

from August 2020 until its merger with Sitio Royalties (NYSE: STR) in December 2022. Mr. Langford has over 30 years of oil and gas industry experience. He has served as the Chief Executive Officer of Langford Energy Partners I, LLC since 2020. Previously, he was the Chief Executive Officer, Co-Founder, and director of Luxe Energy LLC and Luxe Minerals LLC from 2015 to 2020. Prior to that, Mr. Langford served as Senior Vice President for Equinor ASA (formerly named Statoil ASA) from 2011 to 2015. From 1995 to 2011, Mr. Langford built and led Brigham Exploration’s engineering, operations, marketing and midstream departments, ultimately serving as Executive Vice President—Operations at the time the company was purchased by Statoil. He started his engineering career with Burlington Resources Inc. from 1987 to 1995. Mr. Langford earned a Bachelor of Science in Petroleum Engineering from Texas Tech University. Mr. Langford was selected to serve on our board of directors in light of his knowledge of the energy industry and familiarity and experience with our predecessor, Atlas LLC.

Mark P. Mills—Director Nominee.    Mark P. Mills will be appointed to serve as a director of our board of directors in connection with this offering. Mr. Mills has been a senior fellow at the Manhattan Institute, an economics and policy research institute, since 2013, and a faculty fellow at Northwestern University’s McCormick School of Engineering and Applied Science since 2014. He has also served as a strategic non-operating partner with Montrose Lane (an energy-tech venture fund) since 2017, and Chief Executive Officer of Digital Power Capital LLC, a boutique venture fund he co-founded in 2001 (ceased operation in 2009). Previously, Mr. Mills was chairman and Chief Technology Officer of ICx Technologies, Inc., from 2005 to 2008, aiding in its public offering in 2007. Mr. Mills served in the White House Science Office under President Reagan and subsequently provided science and technology policy counsel to a variety of private-sector firms, the Department of Energy and U.S. research laboratories. Mr. Mills was a technology advisor for Bank of America Securities, Inc. and coauthor of the Huber-Mills Digital Power Report, a tech investment newsletter. Early in his career, Mr. Mills was an experimental physicist and development engineer at Bell Northern Research (Canada’s Bell Labs) and at the RCA David Sarnoff Research Center on microprocessors, fiber optics, missile guidance, earning several patents for his work. In 2016, Mr. Mills was named Energy Writer of the Year” by the American Energy Society. Mr. Mills holds a degree in physics from Queen’s University, Ontario, Canada. Mr. Mills was selected to serve on our board of directors in light of his management skills and knowledge of the energy and the technology industries.

Douglas G. RogersDirector Nominee.    Douglas G. Rogers will be appointed to serve as a director of our board of directors in connection with this offering. Since 2015, Mr. Rogers has served as the Executive Director and Secretary/Treasurer of The Sealy & Smith Foundation, a charitable organization that has provided John Sealy Hospital and the University of Texas Medical Branch with over $1 billion in funding in furtherance of its mission to provide healthcare on Galveston Island, Texas. Mr. Rogers is also a member of the board of directors of The Sealy & Smith Foundation. Mr. Rogers holds a Bachelor of Business Administration degree from Texas A&M University. Mr. Rogers was selected to serve on our board of directors as a representative of The Sealy & Smith Foundation and because of his background in banking, real estate and investments.

Robb L. Voyles—Director Nominee.    Robb L. Voyles will be appointed to serve as a director of our board of directors in connection with this offering. Mr. Voyles has served as a Mediator, Arbitrator and Referee/Special Master with JAMS, the largest private provider of alternative dispute resolution services worldwide since 2021. Mr. Voyles previously served as Executive Vice President, Secretary and Chief Legal Officer at Halliburton Company (NYSE: HAL) (“Halliburton”) from 2014 through 2021, where he led the company’s litigation, commercial law, mergers and acquisitions, intellectual property, labor and employment and ethics and compliance departments. He was also responsible for Halliburton’s corporate governance, directed its enterprise risk management program and guided the company’s sustainability and ESG design, practices and reporting. Mr. Voyles also served as Halliburton’s interim Chief Financial Officer in 2017. Prior to his tenure at Halliburton, Mr. Voyles spent


171


Table of Contents

26 years with Baker Botts L.L.P., where he was a senior partner and the global chair of the litigation department. Mr. Voyles earned a Juris Doctor degree from the University of Michigan Law School and a Bachelor of Business Administration in accounting from the University of Dayton. Mr. Voyles was selected to serve on our board of directors in light of his experiences in the oil field services industry, and with corporate governance and legal matters.

Status as a Controlled Company

Upon completion of this offering, the Principal Stockholders will initially indirectly own              shares of Class A common stock and              shares of Class B common stock, representing approximately         % of the voting power of our Common Stock (or              shares of Class A common stock and              shares of Class B common stock if the underwriters’ option to purchase additional shares is exercised in full, representing approximately         % of the voting power of our Common Stock). Pursuant to the terms of the stockholders’ agreement, the Principal Stockholders have agreed to vote their respective shares of Class A and Class B common stock in favor of the election of each of the director nominees designated by Mr. Brigham or his affiliates. See “Certain Relationships and Related Party Transactions—Stockholders’ Agreement.” As a result, we expect to be a controlled company within the meaning of the NYSE’s corporate governance standards. Under the rules of the NYSE, a controlled company is not required to have a majority of independent directors or to maintain an independent compensation or nominating and governance committee. We expect to have seven (7) independent directors upon the closing of this offering, which constitutes a majority of the directors on our board.

If at any time we cease to be a controlled company, we will take all action necessary to comply the rules of the NYSE.

Composition of Our Board of Directors

Our board of directors currently consists of one member. Upon the closing of this offering, it is anticipated that we will have eight directors, and we plan to appoint one additional director within one year of the listing of our common stock on the NYSE.

In connection with this offering, we will enter into a stockholders’ agreement with the Principal Stockholders. The stockholders’ agreement provides Mr. Brigham or his affiliates with the right to designate certain numbers of nominees to our board of directors so long as such Principal Stockholders and their affiliates collectively beneficially own specified percentages of the outstanding shares of our Class A and Class B common stock. Additionally, the stockholders’ agreement provides that the Principal Stockholders agree to cause their respective shares of Class A and Class B common stock to be voted in favor of the election of each of the director nominees designated by Mr. Brigham or his affiliates. See “Certain Relationships and Related Party Transactions—Stockholders’ Agreement.” Each of the eight initial director nominees expected to serve on our board of directors have been nominated pursuant to the Stockholders’ Agreement.

In evaluating director candidates, we will assess whether a candidate possesses the integrity, judgment, knowledge, experience, skills and expertise that are likely to enhance the board’s ability to manage and direct our affairs and business, including, when applicable, to enhance the ability of committees of the board to fulfill their duties. We are in the process of identifying individuals who meet these standards and the relevant independence requirements.

Our directors will be divided into three classes serving staggered three-year terms. Class I, Class II and Class III directors will serve until our annual meetings of stockholders in 2024, 2025 and


172


Table of Contents

2026, respectively. Messrs. Brigham and Cole will be assigned to Class I, Messrs. Rogers, Mills and Langford will be assigned to Class II and Mses. Burleson and Hock and Mr. Voyles will be assigned to Class III. At each annual meeting of stockholders held after the initial classification, directors will be elected to succeed the class of directors whose terms have expired. This classification of our board of directors could have the effect of increasing the length of time necessary to change the composition of a majority of the board of directors. In general, at least two annual meetings of stockholders will be necessary for stockholders to effect a change in a majority of the members of the board of directors.

Director Independence

The board of directors is in the process of reviewing the independence of our directors using the independence standards of the NYSE and the SEC. Currently, we anticipate that our board of directors will determine that Messrs. Cole, Langford, Mills and Voyles and Mses. Burleson and Hock are independent within the meaning of NYSE listing standards currently in effect and within the meaning of Section 10A-3 of the Exchange Act.

Committees of the Board of Directors

Following the completion of this offering, the committees of the board of directors will include an audit committee, a compensation committee and a nominating and corporate governance committee.

Audit Committee

We will establish an audit committee prior to the completion of this offering. Rules implemented by the NYSE and the SEC require us to have an audit committee comprised of at least three directors who meet the independence and experience standards established by the NYSE and the Exchange Act, subject to transitional relief during the one-year period following the completion of this offering. Our audit committee will initially consist of Messrs. Voyles and Mills and Ms. Burleson, who are independent under the rules of the SEC. Mr. Voyles will serve as chairman of the Audit Committee. As required by the rules of the SEC and listing standards of the NYSE, the audit committee will consist solely of independent directors. SEC rules also require that a public company disclose whether or not its audit committee has an “audit committee financial expert” as a member. An “audit committee financial expert” is defined as a person who, based on his or her expertise, possesses the attributes outlined in such rules. We anticipate that Mr. Voyles will satisfy the definition of “audit committee financial expert.”

This committee will oversee, review, act on and report on various auditing and accounting matters to our board of directors, including the selection of our independent accountants, the scope of our annual audits, fees to be paid to the independent accountants, the performance of our independent accountants and our accounting practices. In addition, the audit committee will oversee our compliance programs relating to legal and regulatory requirements. We expect to adopt an audit committee charter defining the committee’s primary duties in a manner consistent with the rules of the SEC and the NYSE or market standards.

Compensation Committee

We will establish a compensation committee of our board of directors prior to the completion of this offering. The members of our compensation committee will be Messrs. Langford and Mills and Mses. Burleson and Hock. Ms. Burleson will serve as chairman of the compensation committee.


173


Table of Contents

Our board of directors has determined that each of Messrs. Langford and Mills and Mses. Burleson and Hock are independent. We will adopt a compensation committee charter, which will detail the principal functions of the compensation committee, including:


reviewing and approving on an annual basis the corporate goals and objectives relevant to our Chief Executive Officer’s compensation, evaluating our Chief Executive Officer’s performance in light of such goals and objectives and determining and approving the remuneration (if any) of our Chief Executive Officer based on such evaluation;


reviewing and approving the compensation of all of our other Section 16 executive officers; reviewing our executive compensation policies and plans;


implementing and administering our incentive compensation equity-based remuneration plans;


assisting management in complying with our proxy statement and annual report disclosure requirements;


approving all special perquisites, special cash payments and other special compensation and benefit arrangements for our executive officers and employees; and


producing a report on executive compensation to be included in our annual proxy statement; and reviewing, evaluating and recommending changes, if appropriate, to the remuneration for directors.

The charter will also provide that the compensation committee may, in its sole discretion, retain or obtain the advice of a compensation consultant, legal counsel or other adviser and will be directly responsible for the appointment, compensation and oversight of the work of any such adviser. However, before engaging or receiving advice from a compensation consultant, external legal counsel or any other adviser, the compensation committee will consider the independence of each such adviser, including the factors required by NYSE and the SEC.

Nominating and Corporate Governance Committee

We will establish a nominating and corporate governance committee of our board of directors prior to the completion of this offering. The members of our nominating and corporate governance committee will be Messrs. Cole and Langford and Ms. Hock. Mr. Langford will serve as chairman of the nominating and corporate governance committee. Our board of directors has determined that each of Messrs. Cole and Langford and Ms. Hock are independent.

The nominating and corporate governance committee is responsible for overseeing the selection of persons to be nominated to serve on our board of directors. The nominating and corporate governance committee considers persons identified by its members, management, stockholders, investment bankers and others.

Guidelines for Selecting Director Nominees

The guidelines for selecting nominees, which will be specified in a charter to be adopted by us, generally provide that persons to be nominated:


should have demonstrated notable or significant achievements in business, education or public service;


should possess the requisite intelligence, education and experience to make a significant contribution to the board of directors and bring a range of skills, diverse perspectives and backgrounds to its deliberations; and


174


Table of Contents
   

should have the highest ethical standards, a strong sense of professionalism and intense dedication to serving the interests of the stockholders.

The nominating and corporate governance committee will consider a number of qualifications relating to management and leadership experience, background and integrity and professionalism in evaluating a person’s candidacy for membership on the board of directors. The nominating and corporate governance committee may require certain skills or attributes, such as financial or accounting experience, to meet specific board needs that arise from time to time and will also consider the overall experience and makeup of its members to obtain a broad and diverse mix of board members. The nominating and corporate governance committee does not distinguish among nominees recommended by stockholders and other persons.

Compensation Committee Interlocks and Insider Participation

None of our executive officers serve on the board of directors or compensation committee of a company that has an executive officer that serves on our board or compensation committee. No member of our board is an executive officer of a company in which one of our executive officers serves as a member of the board of directors or compensation committee of that company.

Corporate Code of Business Conduct and Ethics

Prior to the completion of this offering, our board of directors will adopt a code of conduct applicable to our employees, directors and officers, in accordance with applicable U.S. federal securities laws and the corporate governance rules of the NYSE. Any waiver of this code may be made only by our board of directors and will be promptly disclosed as required by applicable U.S. federal securities laws and the corporate governance rules of the NYSE.

Corporate Governance Guidelines

Prior to the completion of this offering, our board of directors will adopt corporate governance guidelines in accordance with the corporate governance rules of the NYSE.


175


Table of Contents

EXECUTIVE COMPENSATION

We are currently considered an “emerging growth company,” within the meaning of the Securities Act, for purposes of the SEC’s executive compensation disclosure rules. In accordance with such rules, we are required to provide a Summary Compensation Table and an Outstanding Equity Awards at Fiscal Year End Table, as well as limited narrative disclosures regarding executive compensation for our last completed fiscal year. Further, our reporting obligations extend only to our Named Executive Officers.

2022 Summary Compensation Table

The following table summarizes the compensation awarded to, earned by or paid to our Named Executive Officers for the fiscal year ended December 31, 2022.


Name and Principal Position

   Year      Salary($)      Bonus
($)(1)
     All Other
Compensation
($)(2)
     Total ($)  

Ben M. “Bud” Brigham
Executive Chairman and Chief Executive Officer

     2022      $ 0      $ 0      $ 0      $ 0  

John Turner
President and Chief Financial Officer

     2022      $ 393,847      $ 490,000      $ 0      $ 883,847  

Jeffrey Allison (2)
Executive Vice President, Sales & Marketing

     2022      $ 203,885      $ 103,617      $ 229,411      $ 536,912  

Hunter Wallace (3)
Former Chief Operating Officer

     2022      $ 380,000      $ 60,000      $ 429,150      $ 869,150  


(1)

The bonuses disclosed in this column reflect discretionary amounts that were earned by the applicable Named Executive Officers during the 2022 calendar year and paid in the 2022 calendar year.

(2)

Amounts reflected in the Salary column for Mr. Allison include his regular base salary as well as holiday pay in the amount of $11,923. The amounts within the All Other Compensation column are comprised of (i) $221,251 in relocation bonuses and expenses; (ii) an automobile allowance of $7,846; and (iii) a phone allowance of $313.

(3)

Mr. Wallace transitioned into a consultant role during the 2022 year, as described further below. Amounts reflected within the Salary column for Mr. Wallace include his regular base salary as well as holiday and paid time off in the amount of $65,385 . The amounts within the All Other Compensation column are comprised of a $20,000 in payments made in connection with his consultant transition during 2022, the Company’s matching contribution of $9,150 to his 401(k) plan account and both of the $200,000 installments of separation pay, which is described in more detail below.

Outstanding Equity Awards at 2022 Fiscal Year-End

The following table reflects information regarding outstanding equity-based awards held by our Named Executive Officers as of December 31, 2022. Atlas LLC has historically maintained the Atlas Sand Company, LLC Long-Term Incentive Plan (the “ASC Incentive Plan”) and Atlas Sand Management Company, LLC has historically maintained the Atlas Sand Management Company, LLC Long Term Incentive Plan (the “ASMC Incentive Plan” and together with the ASC Incentive Plan, the “Incentive Plans”). Our Named Executive Officers were eligible to receive grants of Class P Units under each of the Incentive Plans and the respective LLC Agreements for Atlas LLC and Atlas Sand Management Company, LLC, respectively, which were granted in 2018. The Class P Units were initially granted to the Named Executive Officers for their services to Atlas LLC, Atlas Sand Management Company, LLC and their affiliates at that time, but all service-based requirements that the executives were required to meet in order to receive those potential incentive interests have been satisfied in previous years. The Class P Units operate as profits interests awards, rather than capital interests, and have no voting rights. Mr. Allison was not an employee at the time of the original 2018 grants and, as of December 31, 2022, did not hold any outstanding equity-based compensation awards.


176


Table of Contents
        Option Awards (1)        

Name

   Governing Plan    Number of
Securities
Underlying
Unexercised
Options (#)
Exercisable (2)
     Number of
Securities
Underlying
Unexercised
Options (#)
Unexercisable
     Option
Exercise
Price ($)
     Option
Expiration
Date
 

Ben M. “Bud” Brigham

   ASC Incentive Plan      25,000        —          N/A        N/A  
   ASMC Incentive Plan      25,000        —          N/A        N/A  

John Turner

   ASC Incentive Plan      10,000        —          N/A        N/A  
   ASMC Incentive Plan      10,000        —          N/A        N/A  

Hunter Wallace

   ASC Incentive Plan      15,000        —          N/A        N/A  
   ASMC Incentive Plan      15,000        —          N/A        N/A  


(1)

We believe that, despite the fact that the Class P Units do not require the payment of an exercise price, they are most similar economically to stock options, and as such, they are properly classified as “options” under the definition provided in Item 402(a)(6)(i) of Regulation S-K as an instrument with an “option-like feature.” Each Class P Unit is granted with a specific hurdle amount, or distribution threshold, and will only provide value to the holder based upon our growth above that hurdle amount.

(2)

The Class P Unit awards are reflected as “exercisable” because they were vested as of December 31, 2022, although not yet settled. None of the Named Executive Officers held unvested Class P Units as of the end of the 2022 year.

Additional Narrative Disclosure

Base Salary, Bonus, Welfare and Separation Benefits

We did not maintain employment agreements, severance or change in control agreements with our Named Executive Officers during the 2022 year. The contractual severance benefits that could have been provided to our Named Executive Officers were provided within the Class P Unit arrangements described below. Base salaries were determined by our Executive Chairman based upon the responsibilities of each officer’s role, duties and experience. Annual bonuses are determined at the discretion of our Executive Chairman based upon the success of our operations and the impact of each officer’s service on our success during any given year.

We do not provide our executive officers with material perquisites or benefits that are not provided to our employee population generally, with the exception of an executive level relocation program in the event that we request a new hire to relocate on our behalf. The amounts in the Summary Compensation Table above for Mr. Allison reflect our payments to him under this program in the 2022 year in connection with his entry into our employment. We maintain a 401(k) retirement plan for all eligible employees, including our Named Executive Officers, but do not maintain deferred compensation or pension plan arrangements.

On November 8, 2022, Mr. Wallace began providing services to us in the capacity as a consultant rather than as a full-time employee. In connection with that transition we entered into a separation and release agreement with him. This agreement confirms Mr. Wallace’s entitlement to the cash salary continuation payment previously provided pursuant to the Incentive Plans award agreements described above, which is equal to $400,000, payable in equal installments commensurate with the our normal payroll practices, and to a separation payment of $400,000, payable in two installments on December 1, 2022 and December 31, 2023, which were both paid in December 2022. Further, the Company shall provide Mr. Wallace with monthly payments required to maintain COBRA benefits through December 31, 2024 (unless terminated earlier due to his employment with a new employer). The foregoing are conditioned on Mr. Wallace’s execution of a general release of claims in favor of the Company. In addition, in exchange for his agreement to act as an independent contractor and strategic advisor, the Company has agreed to pay Mr. Wallace a retainer of $5,000 per month until the earlier of December 31, 2024 or the end of the month in which Mr. Wallace is employed by a third-party.


177


Table of Contents

Equity-Based Compensation Awards

The Class P Units reflected in the Outstanding Equity Awards table above were initially granted with a three year vesting schedule, which was fully satisfied for each named executive officer over the first three years following the 2018 grant date, therefore none of the executives above held an unvested or unearned award as of the end of the 2022 calendar year. The Class P Units reflected above were each granted with a hurdle amount, or distribution threshold, which was set at a value that would make the awards a profits interest award under applicable US tax laws. The hurdle amount is calculated at the time of grant as the aggregate amount that could be distributed to the Class P units pursuant to the governing LLC agreement distribution provisions if the applicable granting entity sold all of its assets for fair market value and immediately liquidated, with all debts and liabilities being satisfied in connection with such a liquidation. In other words, if the applicable entity had liquidated on the date of grant of the Class P Units listed above, each holder would have received $0. Each of the Class P Units held by the Named Executive Officers that was granted under the ASC Incentive Plan in 2018 was designed to participate in the return to all classes of units that are required to share profits with the Class P Units, and each Class P Units held by the Named Executive Officers that was granted under the ASMC Incentive Plan in 2018 was designed to participate in the return to all class of units that are required to share profits with the Class P Units. Because the vesting requirements were met in 2020 and the value of the all units at the IPO will exceed the amount of the initial investment made by all unitholders, the Class P Units will receive Exchanged Rights as described below. Therefore the Named Executive Officers now solely hold a right to receive the value of their vested interests when the applicable entities determine to make a distribution.

Under the terms of the award agreements, upon a termination of an officer’s employment due to cause, the officer would forfeit all Class P Units held at the time of that termination, whether vested or unvested, for no consideration. If the officer’s employment terminated for any other reason, including death or disability, any unvested Class P Units would be forfeited without consideration, while any vested Class P Units would be subject to our right of repurchase. If we exercised a repurchase right, the vested Class P Units would be repurchased from the holder at a purchase price equal to the fair market value of the units on the date of the officer’s termination of employment. The fair market value would be determined by us and the officer, although in the event that an agreement of value could not be reached between the parties, an independent appraiser would be engaged to determine the appropriate value. In addition, if the holder of a Class P Unit incurred a termination of employment for any reason other than cause or a voluntary resignation, the officer would receive one year’s base salary and benefits that are commensurate with the regular payroll practices of our Company as of the date of the termination of employment.

If a Class P Unit holder engages in certain restricted activities or violates any non-solicitation or noncompetition arrangements at any time during their employment, or within a two year period following the termination of their employment, all Class P Units, whether vested or unvested, may be cancelled without consideration, at the discretion of the administrator of the Incentive Plans.

In connection with this offering, the Class P Units will continue to be held by our Named Executive Officers. As a result of our corporate reorganization more fully described under the heading of “Corporate Reorganization” below, our applicable Named Executive Officers will receive, in exchange for their Class P Units, substantially equivalent securities in one or more of our affiliates (the “Exchanged Rights”). Those affiliate entities will then become responsible for settling and financially satisfying the Exchanged Rights with the applicable Named Executive Officers. The relevant affiliate entities may choose to settle the Exchanged Rights by issuing the Named Executive Officers shares of our common stock, which those entities will hold as a result of our corporate reorganization, but at no time following this offering will we be financially responsible for the settlement of the Exchanged Rights.


178


Table of Contents

Director Compensation

We did not maintain a director compensation program with respect to the 2022 calendar year. As noted above, we expect that the director compensation program for non-employee directors will include a significant element of equity-based compensation awards from the LTIP described below, in order to align the interests of our directors and our stockholders. However, we are currently in discussions regarding the design of the director compensation program that will become effective upon completion of this offering, and have not made any final decisions regarding the details of such a program.

Long Term Incentive Plan

In order to incentivize management members following the completion of this offering, we anticipate that our board of directors will adopt the LTIP for employees, consultants and directors prior to the completion of this offering. Our Named Executive Officers will be eligible to participate in this plan, which will become effective upon the consummation of this offering. We anticipate that the LTIP will provide for the grant of options, stock appreciation rights, restricted stock, restricted stock units, stock awards, dividend equivalents, other stock-based awards, cash awards, substitute awards and performance awards intended to align the interests of service providers (including the Named Executive Officers) with those of our shareholders. The description of the LTIP set forth below is a summary of the material anticipated features of the LTIP. Our board of directors is still in the process of developing, approving and implementing the LTIP and, accordingly, this summary is subject to change. Further, this summary does not purport to be a complete description of all of the anticipated provisions of the LTIP and is qualified in its entirety by reference to the LTIP, the form of which will be filed as an exhibit to this registration statement.

LTIP Share Limits. Subject to adjustment in the event of certain transactions or changes of capitalization in accordance with the LTIP, a total of             shares of our common stock will initially be reserved for issuance pursuant to awards under the LTIP. The total number of shares reserved for issuance under the LTIP may be issued pursuant to incentive stock options (which generally are stock options that meet the requirements of Section 422 of the Code). Common stock subject to an award that expires or is canceled, forfeited, exchanged, settled in cash or otherwise terminated without delivery of shares an award will be available for delivery pursuant to other awards under the LTIP.

Individual Share Limits. In a single calendar year, non-employee directors may not be granted awards under the LTIP having a value determined on the date of grant in excess of $750,000; provided that with respect to the first year in which the non-employee director serves on the board, serves on any special committee or acts as a lead director or chairman, awards in excess of that value may be granted to the director.

Administration. The LTIP will be administered by our board of directors, except to the extent our board of directors elects a committee of directors to administer the LTIP, such as our compensation committee (as applicable, the “administrator”). The administrator will have broad discretion to administer the LTIP, including the power to determine the eligible individuals to whom awards will be granted, the number and type of awards to be granted and the terms and conditions of awards. The administrator may also accelerate the vesting or exercise of any award and make all other determinations and to take all other actions necessary or advisable for the administration of the LTIP.

Eligibility. Any individual who is our officer or employee or an officer or employee of any of our affiliates, and any other person who provides services to us or our affiliates, including members of our board of directors, are eligible to receive awards under the LTIP at the discretion of the administrator.

Stock Options. The administrator may grant incentive stock options and options that do not qualify as incentive stock options, except that incentive stock options may only be granted to persons


179


Table of Contents

who are our employees or employees of one of our subsidiaries, in accordance with Section 422 of the Code. The exercise price of a stock option generally cannot be less than 100% of the fair market value of a share of our common stock on the date on which the option is granted and the option must not be exercisable for longer than ten years following the date of grant. In the case of an incentive stock option granted to an individual who owns (or is deemed to own) at least 10% of the total combined voting power of all classes of our capital stock, the exercise price of the stock option must be at least 110% of the fair market value of a share of our common stock on the date of grant and the option must not be exercisable more than five years from the date of grant.

Stock Appreciation Rights (“SARs”). A SAR is the right to receive an amount equal to the excess of the fair market value of one share of our common stock on the date of exercise over the grant price of the SAR. The grant price of a SAR generally cannot be less than 100% of the fair market value of a share of our common stock on the date on which the SAR is granted. The term of a SAR may not exceed ten years. SARs may be granted in connection with, or independent of, a stock option. SARs may be paid in cash, common stock or a combination of cash and common stock, as determined by the administrator.

Restricted Stock. Restricted stock is a grant of shares of common stock subject to the restrictions on transferability and risk of forfeiture imposed by the administrator. Dividends accrued prior to vesting will be subject to the same restrictions and risk of forfeiture as the restricted stock with respect to which the dividend was made.

Restricted Stock Units. A restricted stock unit is a right to receive cash, common stock or a combination of cash and common stock at the end of a specified period equal to the fair market value of one share of our common stock on the date of vesting. Restricted stock units may be subject to the restrictions, including a risk of forfeiture, imposed by the administrator.

Stock Awards. A stock award is a transfer of unrestricted shares of our common stock on terms and conditions determined by the administrator.

Dividend Equivalents. Dividend equivalents entitle an individual to receive cash, shares of common stock, other awards, or other property equal in value to dividends or other distributions paid with respect to a specified number of shares of our common stock. Dividend equivalents may be awarded on a free-standing basis or in connection with another award (other than an award of stock options, SARs, restricted stock or a stock award). The administrator may provide that dividend equivalents will be paid or distributed when accrued or at a later specified date, including at the same time and subject to the same restrictions and risk of forfeiture as the award with respect to which the dividends accrue if they are granted in tandem with another award.

Other Stock-Based Awards. Subject to limitations under applicable law and the terms of the LTIP, the administrator may grant other awards related to our common stock. Such awards may include, without limitation, awards that are convertible or exchangeable debt securities, other rights convertible or exchangeable into our common stock, purchase rights for common stock, awards with value and payment contingent upon our performance or any other factors designated by the administrator, and awards valued by reference to the book value of our common stock or the value of securities of, or the performance of, our affiliates.

Cash Awards. The LTIP will permit the grant of awards denominated in and settled in cash as an element of or supplement to, or independent of, any award under the LTIP.

Substitute Awards. Awards may be granted in substitution or exchange for any other award granted under the LTIP or any other right of an eligible person to receive payment from us. Awards may also be granted under the LTIP in substitution for similar awards held by individuals who become eligible persons as a result of a merger, consolidation or acquisition of another entity or the assets of another entity by or with us or one of our affiliates.


180


Table of Contents

Performance Awards. Performance awards represent awards with respect to which a participant’s right to receive cash, shares of our common stock, or a combination of both, is contingent upon the attainment of one or more specified performance measures during a specified period. The administrator will determine the applicable performance period, the performance goals and such other conditions that apply to each performance award. The administrator may use any business criteria and other measures of performance it deems appropriate in establishing the performance goals applicable to a performance award.

Recapitalization. In the event of any change in our capital structure or business or other corporate transaction or event that would be considered an equity restructuring, the administrator shall or may (as required by applicable accounting rules) equitably adjust the (i) aggregate number or kind of shares that may be delivered under the LTIP, (ii) the number or kind of shares or amount of cash subject to an award, (iii) the terms and conditions of awards, including the purchase price or exercise price of awards and performance goals, and (iv) the applicable share-based limitations with respect to awards provided in the LTIP, in each case to equitably reflect such event.

Change in Control. Except to the extent otherwise provided in any applicable award agreement, awards will vest upon the occurrence of a change in control. In addition, the event of a change in control or other changes to us or our common stock, the administrator may, in its discretion, (i) accelerate the time of exercisability of an award, (ii) require awards to be surrendered in exchange for a cash payment (including canceling a stock option or SAR for no consideration if it has an exercise price or the grant price less than the value paid in the transaction), or (iii) make any other adjustments to awards that the administrator deems appropriate to reflect the applicable transaction or event.

No Repricing. Except in connection with (i) the issuance of substitute awards granted to new service providers in connection with a transaction or (ii) in connection with adjustments to awards granted under the LTIP as a result of a transaction or recapitalization involving us, without the approval of the stockholders of the Company, the terms of outstanding option or SAR may not be amended to reduce the exercise price or grant price or to take any similar action that would have the same economic result.

Clawback. All awards granted under the LTIP are subject to reduction, cancelation or recoupment under any written clawback policy that we may adopt and that we determine should apply to awards under the LTIP.

Amendment and Termination. The LTIP will automatically expire on the tenth anniversary of its effective date. The administrator may amend or terminate the LTIP at any time, subject to stockholder approval if required by applicable law, rule or regulation, including the rules of the stock exchange on which our shares of common stock are listed. The administrator may amend the terms of any outstanding award granted under the LTIP at any time so long as the amendment would not materially and adversely affect the rights of a participant under a previously granted award without the participant’s consent.

Anti-Hedging Policies

We expect to adopt a policy that will prohibit our employees, including all executive officers, and members of our board of directors from engaging in transactions that are considered to hedge or offset the financial impact of holding our common stock.


181


Table of Contents

CORPORATE REORGANIZATION

Atlas LLC was formed on April 20, 2017 for the purpose of being an in-basin, pure-play producer and provider of proppant primarily in the Permian Basin.

Atlas Inc. was incorporated as a Delaware corporation in February 2022. Following this offering and the corporate reorganization described below, (i) Atlas Inc. will be a holding company whose sole material asset will consist of membership interests in Atlas Operating, (ii) Atlas Operating will be a holding company whose sole material asset will be 100% of the membership interests in Atlas LLC and (iii) Atlas LLC will own, directly or indirectly, all of our operating assets. After the consummation of this offering and the corporate reorganization described below, Atlas Inc. will be the managing member of Atlas Operating, will be responsible for all operational, management and administrative decisions relating to Atlas LLC’s business and will consolidate the financial results of Atlas LLC and its subsidiaries.

In connection with the completion of this offering, we will engage in the following transactions, which we refer to as the “corporate reorganization”:


a merger will be effected in which Atlas LLC will survive as a wholly owned subsidiary of Atlas Operating;


HoldCos will hold the Legacy Owners’ membership interests in Atlas Operating, which membership interests will be represented by Atlas Units;


the Legacy Owners will indirectly, through the new holding companies, transfer all or a portion of their Atlas Units and voting rights, as applicable, in Atlas Operating to Atlas Inc. in exchange for shares of Class A common stock and, in the case of Legacy Owners continuing to hold Atlas Units, through the HoldCos shares of Class B common stock (so that such Legacy Owners continuing to hold Atlas Units will, through the HoldCos, hold one share of Class B common stock for each Atlas Unit held by them immediately following this offering); and


Atlas Inc. will contribute all of the net proceeds received by it in this offering to Atlas Operating in exchange for a number of Atlas Units (such that the total number of Atlas Units held by Atlas Inc. equals the number of shares of Class A common stock outstanding after this offering), and Atlas Operating will further contribute the net proceeds received to Atlas LLC.

In the event we increase or decrease the number of shares of Class A common stock sold in this offering, the number of Atlas Units held by us immediately following this offering will correspondingly increase or decrease, respectively.

Immediately following this offering, each Legacy Owner’s ownership interest in any shares of Class A common stock, Class B common stock and/or Atlas Units, as the case may be, will be indirect ownership of such securities by virtue of such Legacy Owner’s direct ownership interest in the one or more of the HoldCos, which will be the direct record owners of all such securities.

After giving effect to these transactions and this offering and assuming the underwriters’ option to purchase additional shares is not exercised:


the Legacy Owners will collectively own all of the outstanding shares of Class B common stock and                shares of Class A common stock, collectively representing     % of the voting power and    % of the economic interest of Atlas Inc.;


Atlas Inc. will own an approximate     % interest in Atlas Operating; and


the Legacy Owners that continue to hold Atlas Units immediately following the corporate reorganization and this offering will collectively own an approximate     % interest in Atlas Operating.


182


Table of Contents

If the underwriters’ option to purchase additional shares is exercised in full:


the Legacy Owners will collectively own all of the outstanding shares of Class B common stock and                shares of Class A common stock, collectively representing     % of the voting power and    % of the economic interest of Atlas Inc.;


Atlas Inc. will own an approximate     % interest in Atlas Operating; and


the Legacy Owners that continue to hold Atlas Units immediately following the corporate reorganization and this offering will collectively own an approximate     % interest in Atlas Operating.

Each share of Class B common stock has no economic rights but entitles its holder to one vote on all matters to be voted on by stockholders generally. Holders of Class A common stock and Class B common stock will vote together as a single class on all matters presented to our stockholders for their vote or approval, except as otherwise required by applicable law or by our amended and restated certificate of incorporation. We do not intend to list our Class B common stock on any exchange.

Our organizational structure following the offering and corporate reorganization is commonly referred to as an “Up-C” structure. Pursuant to this structure, following this offering we will hold a number of Atlas Units equal to the number of shares of Class A common stock issued and outstanding, and the Atlas Unitholders (other than us) will hold a number of Atlas Units equal to the number of shares of Class B common stock issued and outstanding. The Up-C structure was selected in order to (i) allow certain Legacy Owners the option to continue to hold their economic ownership in Atlas LLC in “pass-through” form for U.S. federal income tax purposes through their direct and indirect ownership of Atlas Units, and (ii) potentially allow us to benefit from certain net cash tax savings that we might realize as a result of certain increases in tax basis that may occur as a result of Atlas Inc.’s acquisition (or deemed acquisition for U.S. federal income tax purposes) of Atlas Units pursuant to the exercise of the Redemption Right or the Call Right. In contrast to many offerings by issuers choosing an Up-C structure, we have made the decision not to enter into a tax receivable agreement with the Legacy Owners with respect to any such cash tax savings we might realize, which we believe provides for increased alignment between us and our stockholders over the long term.

Following this offering, under the Atlas Operating LLC Agreement, the Atlas Unitholders, other than Atlas Inc., will, subject to certain limitations, have the Redemption Right to cause Atlas Operating to acquire all or a portion of their Atlas Units for, at Atlas Operating’s election, (i) shares of our Class A common stock at a redemption ratio of one share of Class A common stock for each Atlas Unit redeemed, subject to conversion rate adjustments for stock splits, stock dividends, reclassification and other similar transactions, or (ii) an equivalent amount of cash. We will determine whether to issue shares of Class A common stock or cash based on facts in existence at the time of the decision, which we expect would include the relative value of the Class A common stock (including the trading prices for the Class A common stock at the time), the cash purchase price, the availability of other sources of liquidity (such as an issuance of preferred stock) to acquire the Atlas Units and alternative uses for such cash. Alternatively, upon the exercise of the Redemption Right, Atlas Inc. (instead of Atlas Operating) will have the Call Right to, for administrative convenience, acquire each tendered Atlas Unit directly from the redeeming Atlas Unitholder for, at its election, (x) one share of Class A common stock, subject to conversion rate adjustments for stock splits, stock dividends, reclassification and other similar transactions, or (y) an equivalent amount of cash. In connection with any redemption of Atlas Units pursuant to the Redemption Right or the Call Right, a corresponding number of shares of Class B common stock will be cancelled. Please see “Certain Relationships and Related Party Transactions—Atlas Operating LLC Agreement.”


183


Table of Contents

The following diagram indicates our simplified ownership structure immediately following this offering and the transactions related thereto (assuming the underwriters’ option to purchase additional shares is not exercised):


LOGO


184


Table of Contents

SECURITY OWNERSHIP OF CERTAIN BENEFICIAL OWNERS AND MANAGEMENT

The following table sets forth information with respect to the beneficial ownership of our Class A common stock and Class B common stock that, upon the consummation of this offering and transactions related thereto, will be owned by:


each person known to us to beneficially own more than 5% of any class of our outstanding voting securities;


each member of our board of directors and each of our director nominees;


each of our Named Executive Officers; and


all of our directors, director nominees and executive officers as a group.

All information with respect to beneficial ownership has been furnished by the respective more than 5% stockholders, directors and Named Executive Officers, as the case may be. Unless otherwise noted, the mailing address of each listed beneficial owner is c/o Atlas Energy Solutions Inc., 5918 W. Courtyard Dr., Suite 500, Austin, Texas 78730. The following table does not reflect any shares of Class A common stock that the more than 5% stockholder, directors and Named Executive Officers may purchase in this offering through the Directed Share Program described in “Underwriting—Directed Share Program.”

To the extent that the underwriters sell more than                  shares of Class A common stock, the underwriters have the option to purchase up to an additional                  shares from us. These amounts are shown assuming both no exercise and full exercise of the underwriters’ option to purchase additional shares.


    Shares
Beneficially
Owned
Prior to the
Offering(1)


    Shares Beneficially Owned After the
Offering (Assuming No Exercise of the
Underwriters’ Over-Allotment Option)
    Shares Beneficially Owned After the
Offering (Assuming Full Exercise of the
Underwriters’ Over-Allotment Option)
 
    Class A
Common Stock
    Class B
Common Stock(1)
    Combined
Voting
Power(2)
    Class A
Common Stock
    Class B
Common Stock(1)
    Combined
Voting
Power(2)
 
    Number     %     Number     %     Number     %     Number     %     Number     %     Number     %     Number     %  

Over 5% Stockholders


Atlas Sand Holdings, LLC(3)


Atlas Sand Holdings II, LLC(4)


Directors, Director Nominees and Named Executive Officers:


Ben M. Brigham(5)


John Turner


Jeffrey Allison


Gayle Burleson


Stephen C. Cole


185


Table of Contents
    Shares
Beneficially
Owned
Prior to the
Offering(1)


    Shares Beneficially Owned After the
Offering (Assuming No Exercise of the
Underwriters’ Over-Allotment Option)
    Shares Beneficially Owned After the
Offering (Assuming Full Exercise of the
Underwriters’ Over-Allotment Option)
 
    Class A
Common Stock
    Class B
Common Stock(1)
    Combined
Voting
Power(2)
    Class A
Common Stock
    Class B
Common Stock(1)
    Combined
Voting
Power(2)
 
    Number     %     Number     %     Number     %     Number     %     Number     %     Number     %     Number     %  

Stacy Hock


A. Lance Langford


Mark P. Mills


Douglas G. Rogers


Robb L. Voyles


Directors, Director Nominees and Executive Officers as a group (12 persons)


*

Less than 1%.

(1)

Subject to the terms of the Atlas Operating LLC Agreement, Atlas Unitholders (other than Atlas Inc.) will have the right to redeem all or a portion of their Atlas Units for Class A common stock (or cash, at Atlas Operating’s election) at a redemption ratio of one share of Class A common stock for each Atlas Unit redeemed. In connection with any such redemption of Atlas Units, a corresponding number of shares of Class B common stock will be cancelled. Please see “Certain Relationships and Related Party Transactions—Atlas Operating LLC Agreement.” Beneficial ownership of Atlas Units is not reflected as beneficial ownership of shares of our Class A common stock for which such units may be redeemed.

(2)

Represents percentage of voting power of our Class A common stock and Class B common stock voting together as a single class. Holders of Atlas Units will hold one share of Class B common stock for each Atlas Unit.

(3)

Atlas Sand Holdings, LLC (“Holdings”) is the record holder of such shares. Atlas Sand Management Company, LLC (“ASMC”) is the managing member of Holdings. Ben M. Brigham is the sole managing member of ASMC. Therefore, ASMC and Mr. Brigham may be deemed to share the right to direct the voting or disposition of the shares held by Holdings. Each of ASMC and Mr. Brigham disclaim beneficial ownership of the shares held by Holdings except to the extent of their pecuniary interest therein, if any.

(4)

Atlas Sand Holdings II, LLC (“Holdings II”) is the record holder of such shares. Atlas Sand Management Company II, LLC (“ASMC II”) is the managing member of Holdings II. Ben M. Brigham is the sole managing member of ASMC II. Therefore, ASMC II and Mr. Brigham may be deemed to share the right to direct the voting or disposition of the shares held by Holdings II. Each of ASMC II and Mr. Brigham disclaim beneficial ownership of the shares held by Holdings II except to the extent of their pecuniary interest therein, if any.

(5)

Includes (i)                 shares held by Holdings and (ii)                 shares held by Holdings II, of which Mr. Brigham may deemed to have or share beneficial ownership of the shares held thereby as the sole manager of each of ASMC and ASMC II, respectively. Additionally, Mr. Brigham may be deemed to have shared voting power over all securities held by the Principal Stockholders party to the Stockholders’ Agreement, in light of his right to designate nominees for election to our board of directors and the obligation of the Principal Stockholders to vote their respective shares in favor of Mr. Brigham’s nominees. See the section titled “Certain Relationships and Related Party Transactions—Stockholders’ Agreement” herein. Because Mr. Brigham may be deemed to have shared voting power with respect to the shares held by the Principal Stockholders, he may be deemed to be the beneficial owner of such shares. Mr. Brigham disclaims beneficial ownership of the shares held by Holdings, Holdings II and the Principal Stockholders and each of their respective affiliated entities, except to the extent of his pecuniary interest therein, if any.


186


Table of Contents

CERTAIN RELATIONSHIPS AND RELATED PARTY TRANSACTIONS

Atlas Operating LLC Agreement

The Atlas Operating LLC Agreement is filed as an exhibit to the registration statement of which this prospectus forms a part, and the following description of the Atlas Operating LLC Agreement is qualified in its entirety by reference thereto.

Redemption Rights

Following this offering, under the Atlas Operating LLC Agreement, the Atlas Unitholders, other than Atlas Inc., will, subject to certain limitations, have the right, pursuant to the Redemption Right, to cause Atlas Operating to acquire all or a portion of their Atlas Units for, at Atlas Operating’s election, (i) shares of our Class A common stock at a redemption ratio of one share of Class A common stock for each Atlas Unit redeemed, subject to conversion rate adjustments for stock splits, stock dividends, reclassification and other similar transactions, or (ii) an equivalent amount of cash. We will determine whether to issue shares of Class A common stock or cash based on facts in existence at the time of the decision, which we expect would include the relative value of the Class A common stock (including the trading prices for the Class A common stock at the time), the cash purchase price, the availability of other sources of liquidity (such as an issuance of preferred stock) to acquire the Atlas Units and alternative uses for such cash. Alternatively, upon the exercise of the Redemption Right, Atlas Inc. (instead of Atlas Operating) will have the right, pursuant to the Call Right, to, for administrative convenience, acquire each tendered Atlas Unit directly from the redeeming Atlas Unitholder for, at its election, (x) one share of Class A common stock, subject to conversion rate adjustments for stock splits, stock dividends, reclassification and other similar transactions, or (y) an equivalent amount of cash. In connection with any redemption of Atlas Units pursuant to the Redemption Right or the Call Right, a corresponding number of shares of Class B common stock will be cancelled.

As any Legacy Owners that hold Atlas Units cause their Atlas Units to be redeemed, holding other assumptions constant, Atlas Inc.’s membership interest in Atlas Operating will be correspondingly increased, the number of shares of Class A common stock outstanding will be increased, and the number of shares of Class B common stock outstanding will be reduced.

Distributions and Allocations

Under the Atlas Operating LLC Agreement, subject to the obligations of Atlas Operating to make certain tax distributions and to reimburse Atlas Inc. for its corporate and other overhead expenses, we will have the right to determine when distributions will be made to the holders of Atlas Units and the amount of any such distributions. Following this offering, if we authorize a distribution, such distribution will be made to the holders of Atlas Units generally on a pro rata basis in accordance with their respective percentage ownership of Atlas Units. To the extent Atlas Operating has available cash and subject to the terms of any current or future debt instruments, the Atlas Operating LLC Agreement will (i) require Atlas Operating to make pro rata cash distributions to the Atlas Unitholders, including Atlas Inc., in an amount sufficient to allow Atlas Inc. to pay its taxes and (ii) permit Atlas Inc., as managing member of Atlas Operating, to cause Atlas Operating to make additional pro rata distributions to the Atlas Unitholders, including to the Legacy Owners that hold Atlas Units and Atlas Inc., in an amount generally intended to allow such holders (other than Atlas Inc.) to satisfy their respective income tax liabilities with respect to their allocable share of the income of Atlas Operating, based on certain assumptions and conventions, to the extent such liabilities exceed amounts otherwise distributed by Atlas Operating. In addition, the Atlas Operating LLC Agreement will require Atlas Operating to make non-pro rata payments to Atlas Inc. to reimburse it for its corporate and other overhead expenses, which payments will not be treated as distributions under the Atlas Operating LLC Agreement.


187


Table of Contents

Atlas Operating will allocate its net income or net loss for each year to the holders of Atlas Units pursuant to the terms of the Atlas Operating LLC Agreement, and the holders of Atlas Units, including Atlas Inc., will generally incur U.S. federal, state and local income taxes on their share of any net taxable income of Atlas Operating. Net income and losses of Atlas Operating generally will be allocated to the holders of Atlas Units on a pro rata basis in accordance with their respective percentage ownership of Atlas Units, subject to requirements under U.S. federal income tax law that certain items of income, gain, loss or deduction be allocated disproportionately in certain circumstances.

Issuance of Equity

The Atlas Operating LLC Agreement will generally provide that, at any time Atlas Inc. issues a share of its Class A common stock or any other equity security, the net proceeds received by Atlas Inc. with respect to such issuance, if any, shall be concurrently invested in Atlas Operating, and Atlas Operating shall issue to Atlas Inc. one Atlas Unit or other economically equivalent equity interest. Conversely, if at any time any shares of Atlas Inc.’s Class A common stock are redeemed, repurchased or otherwise acquired, Atlas Operating shall redeem, repurchase or otherwise acquire an equal number of Atlas Units held by Atlas Inc., upon the same terms and for the same price as the shares of our Class A common stock are redeemed, repurchased or otherwise acquired.

Competition

Under the Atlas Operating LLC Agreement, the members have agreed that the Principal Stockholders and any member of our board of directors who is not at the time an officer of the Company, and their respective affiliates, will be permitted to engage in business activities or invest in or acquire businesses that may compete with our business or do business with our customers.

Dissolution

Atlas Operating will be dissolved only upon the first to occur of (i) the sale of substantially all of its assets or (ii) an election by us to dissolve the company. Upon dissolution, Atlas Operating will be liquidated and the proceeds from any liquidation will be applied and distributed in the following manner: (a) first, to creditors (including to the extent permitted by law, creditors who are members) in satisfaction of the liabilities of Atlas Operating, (b) second, to establish cash reserves for contingent or unforeseen liabilities, and (c) third, to the Atlas Unitholders in proportion to the number of Atlas Units owned by each of them.

Registration Rights Agreement

In connection with the closing of this offering, we will enter into a registration rights agreement with certain Legacy Owners covering, in the aggregate, approximately         % of our Class A and Class B common stock on a combined basis. The agreement will include provisions by which we agree, after the expiration of the lock-up period described below, to register under the U.S. federal securities laws the offer and resale of shares of our Class A common stock (including shares issued in connection with any redemption of Atlas Units pursuant to the Redemption Right or the Call Right) by such Legacy Owners or certain of their respective affiliates or permitted transferees under the registration rights agreement. These registration rights will be subject to certain conditions and limitations. We will generally be obligated to pay all registration expenses in connection with these registration obligations, regardless of whether a registration statement is filed or becomes effective.


188


Table of Contents

Stockholders’ Agreement

In connection with the closing of this offering, we will enter into a stockholders’ agreement with the Principal Stockholders. Among other things, the stockholders’ agreement will provide the right to designate nominees for election to our board of directors as follows:


so long as the Principal Stockholders collectively beneficially own greater than 50% of our Class A and Class B common stock (taken together as a single class), Mr. Brigham or his affiliates will have the right to determine the size of our board of directors and designate all members of our board of directors, including the right to designate all individuals to be included in the slate of directors to be nominated by the board of directors for election by the stockholders of the Company;


so long as the Principal Stockholders collectively beneficially own at least 35% of our Class A and Class B common stock (taken together as a single class), Mr. Brigham or his affiliates will have the right to designate four (4) members of our board of directors, including the right to designate four (4) individuals to be included in the slate of directors to be nominated by the board of directors for election by the stockholders of the Company;


so long as the Principal Stockholders collectively beneficially own at least 25% but not greater than 35% of our Class A and Class B common stock (taken together as a single class), Mr. Brigham or his affiliates will have the right to designate three (3) members of our board of directors, including the right to designate three (3) individuals to be included in the slate of directors to be nominated by the board of directors for election by the stockholders of the Company;


so long as the Principal Stockholders collectively beneficially own at least 10% but not greater than 25% of our Class A and Class B common stock (taken together as a single class), Mr. Brigham or his affiliates will have the right to designate two (2) members of our board of directors, including the right to designate two (2) individuals to be included in the slate of directors to be nominated by the board of directors for election by the stockholders of the Company; and


so long as the Principal Stockholders collectively beneficially own at least 5% but not greater than 10% of our Class A and Class B common stock (taken together as a single class), Mr. Brigham or his affiliates will have the right to designate one (1) member of our board of directors, including the right to designate one (1) individual to be included in the slate of directors to be nominated by the board of directors for election by the stockholders of the Company.

If the authorized size of our board of directors is increased or decreased at any time to constitute other than nine (9) directors, the number of directors that Mr. Brigham or his affiliates is entitled to designate pursuant to the stockholders’ agreement will be proportionately increased or decreased, respectively, rounded to the nearest whole number.

Pursuant to the stockholders’ agreement, we will be required to take all necessary actions, to the fullest extent permitted by applicable law (including with respect to any fiduciary duties under Delaware law), to cause the election of the nominees designated by Mr. Brigham or his affiliates, and each of the Principal Stockholders will agree to cause its respective shares of Class A and Class B common stock to be voted in favor of the election of each of the nominees designated by Mr. Brigham or his affiliates. Mr. Brigham or his affiliates will be entitled to designate the replacement for any of his respective board designees whose board service terminates prior to the end of such director’s term.

In addition, the stockholders’ agreement will provide that for so long as Mr. Brigham or his affiliates is entitled to designate any members of our board of directors, we will be required to take all


189


Table of Contents

necessary actions to cause each of the audit committee, compensation committee and nominating and governance committee of our board of directors to include in its membership at least one director designated by Mr. Brigham or his affiliates, except to the extent that such membership would violate applicable securities laws or stock exchange rules.

Furthermore, so long as the Principal Stockholders collectively beneficially own at least a majority of the outstanding shares of our Class A and Class B common stock (taken together as a single class), we have agreed not to take, and will cause our subsidiaries not to take, the following actions (or enter into an agreement to take such actions) without the prior consent of Mr. Brigham or his affiliates, subject to certain exceptions:


adopting or proposing any amendment, modification or restatement of or supplement to our certificate of incorporation or bylaws;


increasing or decreasing the size of our board of directors; or


issuing any equity securities that will rank senior to our Class A and Class B common stock as to voting rights, dividend rights or distribution rights upon liquidation, winding up or dissolution of the Company.

Historical Transactions with Affiliates

Brigham Development—Wyatt’s Lodge

On December 10, 2021, Atlas LLC entered into a definitive agreement under which Atlas LLC acquired certain assets from Brigham Development, LLC and BDWTX, LLC in an all-cash transaction valued at $7.0 million. These assets include Wyatt’s Lodge, a lodging facility that is used by Permian Basin based personnel and located between our Kermit and Monahans facilities in Kermit, Texas. This transaction is considered an asset acquisition in 2021. By acquiring Wyatt’s Lodge, we eliminated approximately $1.5 million of annual rental expense. Brigham Development, LLC an BDWTX, LLC are each owned and controlled by our Executive Chairman and Chief Executive Officer, Bud Brigham.

On August 6, 2018, Atlas LLC entered into a Lease Agreement with BDWTX, LLC for the assets that included Wyatt’s Lodge as described above. The Lease Agreement was amended on February 1, 2019 to adjust the terms of the lease payment obligations thereunder. Under the Lease Agreement, as amended, Atlas LLC operated Wyatt’s Lodge and made aggregate lease payments equal to approximately $1.5 million and $1.5 million for the years ended December 31, 2021 and 2020, respectively. The Lease Agreement was terminated in December 2021 in connection with the acquisition by Atlas LLC described above, and therefore no payments were made for the year ended December 31, 2022.

Brigham Land Management LLC

Brigham Land Management LLC (“Brigham Land”) provides the Company with landman services for certain of our projects and initiatives. The services are provided on a per hour basis at market prices. Brigham Land is owned and controlled by Vince Brigham, an advisor to the Company and the brother of our Executive Chairman and Chief Executive Officer, Bud Brigham. For the years ended December 31, 2022, 2021 and 2020, the Company made aggregate payments to Brigham Land equal to approximately $1.0 million, $0.7 million and $0.5 million, respectively.

Brigham Oil & Gas, LLC

On January 26, 2021, Atlas LLC entered into a Joint Development Agreement with, among others, Brigham Oil & Gas, LLC (“BOG”), which is controlled by our Executive Chairman and Chief


190


Table of Contents

Executive Officer, Bud Brigham. Under the Joint Development Agreement, the Company has agreed to supply sand for certain wells to be drilled and completed by BOG. For the year ended December 31, 2022, we received revenue equal to approximately $0.9 million in the normal course of business and not related to the Joint Development Agreement. For the year ended December 31, 2021, we received revenue under the agreement equal to approximately $0.2 million. There were no sales transactions with BOG for the year ended December 31, 2020.

Brigham Earth, LLC

Brigham Earth, LLC provides the Company with professional and consulting fees as well as access to certain information and software systems. Brigham Earth, LLC is owned and controlled by our Executive Chairman and Chief Executive Officer, Bud Brigham. For the years ended December 31, 2022, 2021 and 2020, the Company made aggregate payments to Brigham Earth, LLC for these services equal to approximately $1.2 million, $1.1 million and $0.5 million, respectively.

BlackGold SPV I LP

On January 30, 2018, Atlas LLC, as borrower, entered into the 2018 Term Loan Credit Facility with BlackGold SPV I LP (“BlackGold SPV”). In connection with its entry into the 2018 Term Loan Credit Facility and the subsequent funding of certain term loans thereunder, Atlas LLC issued to BlackGold SPV certain warrants exercisable for Class D units of Atlas LLC, which BlackGold SPV exercised in full prior to the termination of the 2018 Term Loan Credit Facility in connection with our full repayment of borrowings thereunder on October 20, 2021. BlackGold SPV beneficially owns all of the outstanding Class D units of Atlas LLC, which represent over 5.0% beneficial ownership of Atlas LLC. Please see “Security Ownership of Certain Beneficial Owners and Management.”

During the years ended December 31, 2021 and 2020, respectively, the interest rate was 13.0% and 13.0%, the largest aggregate amount of principal outstanding was $189.6 million and $189.6 million, and Atlas LLC made aggregate interest payments of approximately $18.9 million (including $3.0 million paid in kind with the issuance of additional principal) and $23.6 million (including $11.8 million paid in kind). In the years ended December 31, 2021 and 2020, Atlas LLC repaid approximately $192.6 million and $7.3 million of the principal amount of term loans under the 2018 Term Loan Credit Facility, respectively, which, in the case of the year ended December 31, 2021, included approximately $165.3 million of principal that Atlas LLC repaid in connection with the October 2021 payoff and termination described above, as well as approximately $4.5 million in prepayment premiums. The 2018 Term Loan Credit Facility was not outstanding and therefore no principal or interest payments were made during the year ended December 31, 2022.

In a Good Mood, LLC

In a Good Mood, LLC (“In a Good Mood”) provides the Company with access, at cost, to reserved space in the Moody Center in Austin, Texas for concerts, sporting events and other opportunities as a benefit to our employees and for business entertainment. In a Good Mood is owned and controlled by our Executive Chairman and Chief Executive Officer, Bud Brigham. For the year ended December 31, 2022, the Company made aggregate payments to In a Good Mood for this access equal to approximately $0.2 million. There were no such payments made during the years ended December 31, 2021 and 2020.

Permian Dunes Holding Company, LLC

The rights and access to the mineral reserves associated with our Monahans operations are secured under the Monahans Lease with Permian Dunes. Permian Dunes is a greater than 5% beneficial owner of Atlas LLC. In December 2017, we also entered into the Kermit Royalty Agreement providing Permian Dunes with an overriding royalty interest in revenues we receive from the sale of proppant mined from the reserves associated with our Kermit facility.


191


Table of Contents

Under the Monahans Lease and the Kermit Royalty Agreement, we make monthly royalty payments to Permian Dunes based on a percentage of our of gross monthly sales of proppant. The lease also includes an annual minimum royalty payment in the amount of $1,000,000 (the “Minimum Annual Royalty Payment”) in any year of the term following the occurrence of a Capital Event. Because this offering will constitute a Capital Event under the Monahans Lease, if, during the twelve months following the date of the consummation of this offering, our royalty payments to Permian Dunes do not exceed the Minimum Annual Royalty Payment, we will be obligated to pay to Permian Dunes the difference between the total royalty payments for such year and the Minimum Annual Royalty Payment.

Under the terms of the Kermit Royalty Agreement, the agreement would terminate in connection with the consummation of this offering. In contrast, the Monahans Lease, including the royalty payment obligations thereunder, will survive the consummation of this offering or any other Capital Event.

Permian Dunes is wholly-owned and controlled by The Sealy & Smith Foundation, of which Douglas M. Rogers, a nominee to serve as a director of our board of directors, is the Executive Director, Secretary/Treasurer and a member of the board of directors.

Corporate Reorganization

In connection with our corporate reorganization, we will engage in certain transactions with the Legacy Owners. Please see the section titled “Corporate Reorganization.”

Policies and Procedures for Review of Related Party Transactions

A “Related Party Transaction” is a transaction, arrangement or relationship in which we or any of our subsidiaries was, is or will be a participant, the amount of which involved exceeds $120,000, and in which any Related Person had, has or will have a direct or indirect material interest. A “Related Person” means:


any person who is, or at any time during the applicable period was, one of our directors or one of our executive officers;


any person who is known by us to be the beneficial owner of more than 5.0% of our Class A common stock;


any immediate family member of any of the foregoing persons, which means any child, stepchild, parent, stepparent, spouse, sibling, mother-in-law, father-in-law, son-in-law, daughter-in-law, brother-in-law or sister-in-law of a director, executive officer or a beneficial owner of more than 5.0% of our Class A common stock and any person (other than a tenant or employee) sharing the household of such director, executive officer or beneficial owner of more than 5.0% of our Class A common stock; and


any firm, corporation or other entity in which any of the foregoing persons is a partner or principal or in a similar position or in which such person has a 10.0% or greater beneficial ownership interest.

Our board of directors will adopt a written related party transactions policy prior to the completion of this offering. Pursuant to this policy, our audit committee will review all material facts of all Related Party Transactions and either approve or disapprove entry into the Related Party Transaction, subject to certain limited exceptions. In determining whether to approve or disapprove entry into a Related Party Transaction, our audit committee shall take into account, among other factors, the following: (i) whether the Related Party Transaction is on terms no less favorable than terms generally available to an unaffiliated third party under the same or similar circumstances and (ii) the extent of the Related Person’s interest in the transaction. Furthermore, the policy requires that all Related Party Transactions required to be disclosed in our filings with the SEC be so disclosed in accordance with applicable laws, rules and regulations.


192


Table of Contents

DESCRIPTION OF CAPITAL STOCK

Upon completion of this offering and related transactions, the authorized capital stock of Atlas Inc. will consist of 1,000,000,000 shares of Class A common stock, $0.01 par value per share, of which                  shares will be issued and outstanding and 500,000,000 shares of Class B common stock, $0.01 par value per share, of which                  shares will be issued and outstanding and 500,000,000 shares of preferred stock, $0.01 par value per share, of which no shares will be issued and outstanding.

The following summary of the capital stock and amended and restated certificate of incorporation and bylaws of Atlas Inc. does not purport to be complete and is qualified in its entirety by reference to the provisions of applicable law and to our amended and restated certificate of incorporation and bylaws, which will be filed as exhibits to the registration statement of which this prospectus is a part.

Class A Common Stock

Voting Rights

Holders of shares of Class A common stock are entitled to one vote per share held of record on all matters to be voted upon by the stockholders. The holders of Class A common stock do not have cumulative voting rights in the election of directors. Holders of shares of our Class A common stock and Class B common stock vote together as a single class on all matters presented to our stockholders for their vote or approval, except with respect to the amendment of certain provisions of our amended and restated certificate of incorporation that would alter or change the powers, preferences or special rights of the preferred stock so as to affect them adversely, which amendments must be by a majority of the votes entitled to be cast by the holders of the shares affected by the amendment, voting as a separate class, or as otherwise required by applicable law.

Dividend Rights

Holders of shares of our Class A common stock are entitled to ratably receive dividends when and if declared by our board of directors out of funds legally available for that purpose, subject to any statutory or contractual restrictions on the payment of dividends and to any prior rights and preferences that may be applicable to any outstanding preferred stock.

Liquidation Rights

Upon our liquidation, dissolution, distribution of assets or other winding up, the holders of Class A common stock are entitled to receive ratably the assets available for distribution to the stockholders after payment of liabilities and the liquidation preference of any of our outstanding shares of preferred stock.

Other Matters

The shares of Class A common stock have no preemptive or conversion rights and are not subject to further calls or assessment by us. There are no redemption or sinking fund provisions applicable to the Class A common stock. All outstanding shares of our Class A common stock, including the Class A common stock offered in this offering, are fully paid and non-assessable.


193


Table of Contents

Class B Common Stock

General

In connection with the corporate reorganization and this offering, the Legacy Owners holding Atlas Units immediately following the corporate reorganization and this offering will receive one share of Class B common stock for each such Atlas Unit that they hold. Accordingly, in addition to the number votes with respect to the shares of Class A common stock held by them, such Legacy Owners will have a number of votes in Atlas Inc. equal to the aggregate number of Atlas Units that they hold.

Immediately following this offering, each Legacy Owner’s ownership interest in any shares of Class B common stock and/or Atlas Units, as the case may be, will be indirect ownership of such securities by virtue of such Legacy Owner’s direct ownership interest in the one or more of the HoldCos, which will be the direct record owners of all such securities.

Voting Rights

Holders of shares of our Class B common stock are entitled to one vote per share held of record on all matters to be voted upon by the stockholders. Holders of shares of our Class A common stock and Class B common stock vote together as a single class on all matters presented to our stockholders for their vote or approval, except with respect to the amendment of certain provisions of our amended and restated certificate of incorporation that would alter or change the powers, preferences or special rights of the preferred stock so as to affect them adversely, which amendments must be by a majority of the votes entitled to be cast by the holders of the shares affected by the amendment, voting as a separate class, or as otherwise required by applicable law.

Dividend Rights

Holders of our Class B common stock do not have any right to receive dividends, unless the dividend consists of shares of our Class B common stock or of rights, options, warrants or other securities convertible or exercisable into or exchangeable for shares of Class B common stock paid proportionally with respect to each outstanding share of our Class B common stock and a dividend consisting of shares of Class A common stock or of rights, options, warrants or other securities convertible or exercisable into or redeemable for shares of Class A common stock on the same terms is simultaneously paid to the holders of Class A common stock.

Liquidation Rights

Holders of our Class B common stock do not have any right to receive a distribution upon a liquidation or winding up of Atlas Inc.

Transfer Restrictions

Shares of Class B common stock may be issued or transferred only in connection with the simultaneous issuance or transfer of an identical number of Atlas Units. Any purported issuance or transfer of shares of Class B common stock not accompanied by an issuance or transfer of the identical number of Atlas Units shall be null and void and of no force or effect.

Lock-Up Provisions

Our amended and restated certificate of incorporation will provide that, subject to customary exceptions, all of the shares of Common Stock held by the Legacy Owners may not be sold, pledged, transferred or otherwise disposed of for 180 days following the consummation of this offering, without the prior written consent of the representatives. Following the expiration of such lock-up restrictions,


194


Table of Contents

the Legacy Owners, subject to compliance with the Securities Act or exceptions therefrom, will be able to freely trade their Class A Common Stock, including any shares issued upon exchange of Atlas Units.

Preferred Stock

Our amended and restated certificate of incorporation authorizes our board of directors, subject to any limitations prescribed by law, without further stockholder approval, to establish and to issue from time to time one or more classes or series of preferred stock, par value $0.01 per share, covering up to an aggregate of shares of preferred stock. Each class or series of preferred stock will cover the number of shares and will have the powers, preferences, rights, qualifications, limitations and restrictions determined by the board of directors, which may include, among others, dividend rights, liquidation preferences, voting rights, conversion rights, preemptive rights and redemption rights. Except as provided by law or in a preferred stock designation, the holders of preferred stock will not be entitled to vote at or receive notice of any meeting of stockholders.

Anti-Takeover Provisions under Section 203 of the Delaware General Corporation Law

We have elected not to be governed by or subject to the provisions of Section 203 of the Delaware General Corporation Law.

Amended and Restated Certificate of Incorporation and Bylaws

Provisions of our amended and restated certificate of incorporation and our amended and restated bylaws, which will become effective upon the closing of this offering, may delay or discourage transactions involving an actual or potential change in control or change in our management, including transactions in which stockholders might otherwise receive a premium for their shares or transactions that our stockholders might otherwise deem to be in their best interests. Therefore, these provisions could adversely affect the price of our Class A common stock.

Among other things, upon the completion of this offering, our amended and restated certificate of incorporation and amended and restated bylaws will:


establish advance notice procedures with regard to stockholder proposals relating to the nomination of candidates for election as directors or new business to be brought before meetings of our stockholders. These procedures provide that notice of stockholder proposals must be timely given in writing to our corporate secretary prior to the meeting at which the action is to be taken. Generally, to be timely, notice must be received at our principal executive offices not less than 90 days nor more than 120 days prior to the first anniversary date of the annual meeting for the preceding year. Our amended and restated bylaws specify the requirements as to form and content of all stockholders’ notices. These requirements may preclude stockholders from bringing matters before the stockholders at an annual or special meeting;


provide our board of directors the ability to authorize undesignated preferred stock. This ability makes it possible for our board of directors to issue, without stockholder approval, preferred stock with voting or other rights or preferences that could impede the success of any attempt to change control of us. These and other provisions may have the effect of deterring hostile takeovers or delaying changes in control or management of our Company;


provide that subject to the rights of the holders of any series of preferred stock to elect directors under specified circumstances and the terms of the stockholders’ agreement, the authorized number of directors may be changed only by resolution of the board of directors;


195


Table of Contents
   

provide that all vacancies, including newly created directorships, may, except as otherwise required by law or, if applicable, the rights of holders of a series of preferred stock, and subject to the terms of the Stockholders’ Agreement, be filled by the affirmative vote of a majority of directors then in office, even if such directors constitute less than a quorum;


provide that, subject to the terms of the Stockholders’ Agreement, our amended and restated bylaws can be amended or repealed at any regular or special meeting of stockholders or by the board of directors;


provide that, prior to the Trigger Date (such term as defined in our amended and restated certificate of incorporation), any action required or permitted to be taken by the stockholders at any annual or special meeting of stockholders may be taken without a meeting, without prior notice and without a vote of stockholders if a consent or consents setting forth the action to be taken is or are signed by the holders of outstanding stock having not less than the minimum number of votes that would be necessary to authorize or take such action at a meeting at which all shares entitled to vote thereon were present and voted and is or are delivered to the Corporation. On or after the Trigger Date, any action required or permitted to be taken by the stockholders must be effected at a duly called annual or special meeting of stockholders and may not be effected by any consent in writing in lieu of a meeting of such stockholders, subject to the rights of the holders of any series of preferred stock with respect to such series;


provide that our amended and restated certificate of incorporation and amended and restated bylaws may be amended by the affirmative vote of the holders of at least two-thirds of our then-outstanding common stock on or after the Trigger Date, and prior to such time, our amended and restated certificate of incorporation and amended and restated bylaws may be amended by the affirmative vote of the holders of a majority of our then-outstanding common stock;


provide that special meetings of our stockholders may only be called by the board of directors (pursuant to a resolution adopted by a majority of the board of directors), the chief executive officer or the chairman of the board of directors on or after the Trigger Date, and prior to such time, a special meeting may also be called at the request of the stockholders holding a majority of the outstanding shares entitled to vote;


provide for our board of directors to be divided into three classes of directors, with each class as nearly equal in number as possible, serving staggered three-year terms, other than directors that may be elected by holders of our preferred stock, if any. This system of electing and removing directors may tend to discourage a third party from making a tender offer or otherwise attempting to obtain control of us because it generally makes it more difficult for stockholders to replace a majority of the directors; and


provide that, subject to the terms of the stockholders’ agreement, the affirmative vote of the holders of at least 66 2/3% of the voting power of all then-outstanding common stock entitled to vote generally in the election of directors, voting together as a single class, shall be required to remove any or all of the directors from office and such removal may only be for cause.

Corporate Opportunity

Under our amended and restated certificate of incorporation, to the extent permitted by law:


the Principal Stockholders and their affiliates have the right to, and have no duty to abstain from, exercising such right to, conduct business with any business that is competitive or in the same line of business as us, do business with any of our clients or customers, or invest or own any interest publicly or privately in, or develop a business relationship with, any business that is competitive or in the same line of business as us;


196


Table of Contents
   

if the Principal Stockholders or their affiliates acquire knowledge of a potential transaction that could be a corporate opportunity, they have no duty to offer such corporate opportunity to us; and


we have renounced any interest or expectancy in, or in being offered an opportunity to participate in, such corporate opportunities.

Forum Selection

Our amended and restated certificate of incorporation will provide that unless we consent in writing to the selection of an alternative forum, the Court of Chancery of the State of Delaware (or, if the Court of Chancery of the State of Delaware does not have jurisdiction, the Superior Court of the State of Delaware, or, if the Superior Court of the State of Delaware does not have jurisdiction, the United States District Court for the District of Delaware, in each case, subject to that court having personal jurisdiction over the indispensable parties named defendants therein) will, to the fullest extent permitted by applicable law, be the sole and exclusive forum for any stockholder (including a beneficial owner) to bring:


any derivative action or proceeding brought on our behalf;


any action asserting a claim for a breach of a fiduciary duty owed by any of our current or former directors, officers, employees or stockholders to us or our stockholders;


any action asserting a claim arising pursuant to any provision of the DGCL, our amended and restated certificate of incorporation or our bylaws (as either may be amended or restated), or as to which the DGCL confers jurisdiction to the Court of Chancery of the State of Delaware, our amended and restated certificate of incorporation or our bylaws; or;


any other action asserting a claim against us that is governed by the internal affairs doctrine.

Our amended and restated certificate of incorporation will also provide that, unless we consent in writing to an alternate forum, to the fullest extent permitted by applicable law, the federal district courts of the United States will be the exclusive forum for resolving any complaint asserting a cause of action arising under the Securities Act. Notwithstanding the foregoing, the exclusive forum provision will not apply to suits brought to enforce any liability or duty created by the Exchange Act or any other claim for which the federal courts have exclusive jurisdiction. While the Delaware courts have determined that such choice of forum provisions are facially valid, a stockholder may nevertheless seek to bring a claim in a venue other than those designated in the exclusive-forum provisions, and there can be no assurance that such provisions will be enforced by a court in those other jurisdictions. If a court were to find the exclusive-forum provisions contained in our amended and restated certificate of incorporation to be inapplicable or unenforceable in an action, we may incur additional costs associated with resolving such action in other jurisdictions, which could harm our business.

To the fullest extent permitted by law, any person or entity purchasing or otherwise acquiring any interest in shares of our capital stock will be deemed to have notice of and to have consented to this forum selection provision. This choice of forum provision may limit a stockholder’s ability to bring a claim in a judicial forum that it finds favorable for disputes with us or our directors, officers, employees or agents, which may discourage such lawsuits against us and such persons. Alternatively, if a court were to find these provisions of our amended and restated certificate of incorporation inapplicable to, or unenforceable in respect of, one or more of the specified types of actions or proceedings, we may incur additional costs associated with resolving such matters in other jurisdictions, which could adversely affect our business, financial condition or results of operations.


197


Table of Contents

Limitation of Liability and Indemnification Matters

Our amended and restated certificate of incorporation will limit the liability of our directors for monetary damages for breach of their fiduciary duty as directors, except for liability that cannot be eliminated under the DGCL. Delaware law provides that directors of a company will not be personally liable for monetary damages for breach of their fiduciary duty as directors, except for liabilities:


for any breach of their duty of loyalty to us or our stockholders;


for acts or omissions not in good faith or which involve intentional misconduct or a knowing violation of law;


for unlawful payment of dividend or unlawful stock repurchase or redemption, as provided under Section 174 of the DGCL; or


for any transaction from which the director derived an improper personal benefit.

Any amendment, repeal or modification of these provisions will be prospective only and would not affect any limitation on liability of a director for acts or omissions that occurred prior to any such amendment, repeal or modification.

Our amended and restated bylaws will also provide that we will indemnify our directors and officers to the fullest extent permitted by Delaware law. Our amended and restated bylaws also will permit us to purchase insurance on behalf of any officer, director, employee or other agent for any liability arising out of that person’s actions as our officer, director, employee or agent, regardless of whether Delaware law would permit indemnification. We intend to enter into indemnification agreements with each of our current and future directors and officers. These agreements will require us to indemnify these individuals to the fullest extent permitted under Delaware law against liability that may arise by reason of their service to us, and to advance expenses incurred as a result of any proceeding against them as to which they could be indemnified. We believe that the limitation of liability provision that will be in our amended and restated certificate of incorporation and the indemnification agreements will facilitate our ability to continue to attract and retain qualified individuals to serve as directors and officers.

Transfer Agent and Registrar

The transfer agent and registrar for our Class A common stock will be American Stock Transfer & Trust Company, LLC.

Listing

We have applied to list our Class A common stock for quotation on the NYSE under the symbol “AESI.”


198


Table of Contents

SHARES ELIGIBLE FOR FUTURE SALE

Prior to this offering, there has been no public market for our Class A common stock. Future sales of our Class A common stock in the public market, or the availability of such shares for sale in the public market, could adversely affect the market price of our Class A common stock prevailing from time to time. As described below, only a limited number of shares will be available for sale shortly after this offering due to contractual and legal restrictions on resale. Nevertheless, sales of a substantial number of shares of our Class A common stock in the public market after such restrictions lapse, or the perception that those sales may occur, could adversely affect the prevailing market price of our Class A common stock at such time and our ability to raise equity-related capital at a time and price we deem appropriate.

Sales of Restricted Shares

Upon the closing of this offering and related transactions, we will have outstanding an aggregate of                  shares of Class A common stock. Of these                  shares, all of the shares of Class A common stock (or                  shares of Class A common stock if the underwriters’ option to purchase additional shares is exercised in full) to be sold in this offering will be freely tradable without restriction or further registration under the Securities Act, unless the shares are held by any of our “affiliates” as such term is defined in Rule 144 under the Securities Act. All remaining shares of Class A common stock held by the Legacy Owners through holding companies will be deemed “restricted securities” as such term is defined under Rule 144. The restricted securities were issued and sold by us in private transactions and are eligible for public sale only if registered under the Securities Act or if they qualify for an exemption from registration under Rule 144 or Rule 701 under the Securities Act, which rules are summarized below.

Following this offering, under the Atlas Operating LLC Agreement, the Atlas Unitholders, other than Atlas Inc., will, subject to certain limitations, have the right, pursuant to the Redemption Right, to cause Atlas Operating to acquire all or a portion of their Atlas Units for, at Atlas Operating’s election, (i) shares of our Class A common stock at a redemption ratio of one share of Class A common stock for each Atlas Unit redeemed, subject to conversion rate adjustments for stock splits, stock dividends, reclassification and other similar transactions, or (ii) an equivalent amount of cash. Alternatively, upon the exercise of the Redemption Right, Atlas Inc. (instead of Atlas Operating) will have the right, pursuant to the Call Right, to, for administrative convenience, acquire each tendered Atlas Unit directly from the redeeming Atlas Unitholder for, at its election, (x) one share of Class A common stock, subject to conversion rate adjustments for stock splits, stock dividends, reclassification and other similar transactions, or (y) an equivalent amount of cash. In connection with any redemption of Atlas Units pursuant to the Redemption Right or the Call Right, a corresponding number of shares of Class B common stock will be cancelled. Please see “Certain Relationships and Related Party Transactions—Atlas Operating LLC Agreement.” The shares of Class A common stock we issue upon such redemptions would be “restricted securities” as defined in Rule 144 described below. However, upon the closing of this offering, we intend to enter into a registration rights agreement with certain Legacy Owners that will, any time after 180 days from the date of this prospectus, and upon demand by such Legacy Owners, require us to register under the Securities Act certain of these shares of Class A common stock. Please see the section titled “Certain Relationships and Related Party Transactions—Registration Rights Agreement.”

As a result of the lock-up agreements described below and the provisions of Rule 144 and Rule 701 under the Securities Act, the shares of our Class A common stock (excluding the shares to be sold in this offering) that will be available for sale in the public market are as follows:


no shares will be eligible for sale on the date of this prospectus or prior to 180 days after the date of this prospectus; and


199


Table of Contents
   

                 shares will be eligible for sale upon the expiration of the lock-up agreements, beginning 180 days after the date of this prospectus, and when permitted under Rule 144 or Rule 701.

Lock-up Restrictions

We, certain of our security holders, our officers and directors have entered into lock-up agreements pursuant to which, subject to certain exceptions, we and they have agreed with the underwriters, for a period of 180 days after the date of this prospectus, not to directly or indirectly offer, sell, contract to sell or otherwise dispose of or transfer any shares of Class A common stock or any securities, convertible into or exchangeable for shares of Class A common stock, without the prior written consent of the representatives. These agreements also preclude any hedging collar or other transaction designed or reasonably expected to result in a disposition of shares of Class A common stock or securities convertible into or exercisable or exchangeable for shares of Class A common stock. The representatives may, in their sole discretion and at any time without notice, release all or any portion of the securities subject to these agreements. The representatives do not have any present intent or any understanding to release all or any portion of the securities subject to these agreements. Additionally, our amended and restated certificate of incorporation will provide that, subject to customary exceptions, all of the shares of Common Stock held by the Legacy Owners may not be sold, pledged, transferred or otherwise disposed of for 180 days following the consummation of this offering, without the prior written consent of the representatives. Please see the section titled “Underwriting” for a description of these lock-up provisions.

Rule 144

In general, under Rule 144 under the Securities Act as currently in effect, a person (or persons whose shares are aggregated) who is not deemed to have been an affiliate of ours at any time during the three months preceding a sale, and who has beneficially owned restricted securities within the meaning of Rule 144 for at least six months (including any period of consecutive ownership of preceding non-affiliated holders) would be entitled to sell those shares, subject only to the availability of current public information about us. A non-affiliated person (who has been unaffiliated for at least the past three months) who has beneficially owned restricted securities within the meaning of Rule 144 for at least one year would be entitled to sell those shares without regard to the provisions of Rule 144.

A person (or persons whose shares are aggregated) who is deemed to be an affiliate of ours and who has beneficially owned restricted securities within the meaning of Rule 144 for at least six months would be entitled to sell within any three-month period a number of shares that does not exceed the greater of one percent of the then outstanding shares of our Class A common stock or the average weekly trading volume of our Class A common stock reported through the NYSE during the four calendar weeks preceding the filing of notice of the sale. Such sales are also subject to certain manner of sale provisions, notice requirements and the availability of current public information about us.

Rule 701

In general, under Rule 701 under the Securities Act, any of our employees, directors, officers, consultants or advisors who purchase shares from us in connection with a compensatory stock or option plan or other written agreement before the effective date of this offering is entitled to sell such shares 90 days after we become subject to the reporting requirements of the Exchange Act in reliance on Rule 144, without having to comply with the holding period requirement of Rule 144 and, in the case of non-affiliates, without having to comply with the public information provision of Rule 144. The SEC


200


Table of Contents

has indicated that Rule 701 will apply to typical stock options granted by an issuer before it becomes subject to the reporting requirements of the Exchange Act, along with the shares acquired upon exercise of such options, including exercises after the date of this prospectus.

Stock Issued Under Employee Plans

We intend to file a registration statement on Form S-8 under the Securities Act to register stock issuable under our LTIP. The registration statement on Form S-8 is expected to be filed following the effective date of the registration statement of which this prospectus is a part and will be effective upon filing. Accordingly, shares registered under such registration statement will be available for sale in the open market following the effective date of such registration statement, unless such shares are subject to vesting restrictions with us or the lock-up restrictions described elsewhere in this prospectus.


201


Table of Contents

MATERIAL U.S. FEDERAL INCOME TAX CONSIDERATIONS FOR NON-U.S. HOLDERS

The following is a summary of the material U.S. federal income tax considerations related to the purchase, ownership and disposition of our Class A common stock by a non-U.S. holder (as defined below) that holds our Class A common stock as a “capital asset” within the meaning of Section 1221 of the U.S. Internal Revenue Code of 1986, as amended from time to time (the “Code”) (generally, property held for investment). This summary is based on the provisions of the Code, U.S. Treasury regulations promulgated thereunder, administrative rulings and judicial decisions, all as in effect on the date hereof, and all of which are subject to change or differing interpretations, possibly with retroactive effect. We cannot assure you that a change in law will not significantly alter the tax considerations that we describe in this summary. We have not sought any ruling from the U.S. Internal Revenue Service (the “IRS”) with respect to the statements made and the positions and conclusions described in the following summary. Such statements, positions and conclusions are not free from doubt, and there can be no assurance that the IRS, your tax advisor, or a court will agree with such statements, positions and conclusions.

This summary does not address all aspects of U.S. federal income taxation that may be relevant to non-U.S. holders in light of their personal circumstances. In addition, this summary does not address the impact of the Medicare surtax on certain net investment income, U.S. federal estate or gift tax laws, any U.S. state or local or non-U.S. tax laws, any tax treaties or any other tax law other than the U.S. federal income tax law. This summary also does not address all U.S. federal income tax considerations that may be relevant to particular non-U.S. holders in light of their personal circumstances or that may be relevant to certain categories of investors that may be subject to special rules, such as:


banks, insurance companies or other financial institutions;


tax-exempt or governmental organizations;


tax-qualified retirement plans;


“qualified foreign pension funds” as defined in Section 897(l)(2) of the Code (or any entities all of the interests of which are held by a qualified foreign pension fund);


dealers in securities or foreign currencies;


persons whose functional currency is not the U.S. dollar;


traders in securities that use the mark-to-market method of accounting for U.S. federal income tax purposes;


“controlled foreign corporations,” “passive foreign investment companies,” and corporations that accumulate earnings to avoid U.S. federal income tax;


persons subject to the alternative minimum tax;


entities or arrangements treated as partnerships or pass-through entities for U.S. federal income tax purposes or holders of interests therein;


persons deemed to sell our Class A common stock under the constructive sale provisions of the Code;


persons that acquired our Class A common stock through the exercise of employee stock options or otherwise as compensation or through a tax-qualified retirement plan;


certain former citizens or long-term residents of the United States; and


persons that hold our Class A common stock as part of a straddle, appreciated financial position, synthetic security, hedge, conversion transaction or other integrated investment or risk reduction transaction.


202


Table of Contents

PROSPECTIVE INVESTORS SHOULD CONSULT WITH, AND RELY SOLELY UPON, THEIR OWN TAX ADVISORS WITH RESPECT TO THE APPLICATION OF THE U.S. FEDERAL INCOME TAX LAWS (INCLUDING ANY POTENTIAL FUTURE CHANGES THERETO) TO THEIR PARTICULAR SITUATION, AS WELL AS ANY TAX CONSEQUENCES OF THE PURCHASE, OWNERSHIP AND DISPOSITION OF OUR CLASS A COMMON STOCK ARISING UNDER ANY OTHER TAX LAWS, INCLUDING THE U.S. FEDERAL ESTATE OR GIFT TAX LAWS OR UNDER THE LAWS OF ANY U.S. STATE OR LOCAL OR NON-U.S. TAXING JURISDICTION, OR UNDER ANY APPLICABLE INCOME TAX TREATY.

Non-U.S. Holder Defined

For purposes of this discussion, a “non-U.S. holder” is a beneficial owner of our Class A common stock that is not for U.S. federal income tax purposes a partnership or any of the following:


an individual who is a citizen or resident of the United States;


a corporation (or other entity treated as a corporation for U.S. federal income tax purposes) created or organized in or under the laws of the United States, any state thereof or the District of Columbia;


an estate the income of which is subject to U.S. federal income tax regardless of its source; or


a trust (i) the administration of which is subject to the primary supervision of a U.S. court and which has one or more “United States persons” (within the meaning of Section 7701(a)(30) of the Code) who have the authority to control all substantial decisions of the trust or (ii) which has made a valid election under applicable U.S. Treasury regulations to be treated as a United States person.

If a partnership (including an entity or arrangement treated as a partnership for U.S. federal income tax purposes) holds our Class A common stock, the tax treatment of a partner in the partnership generally will depend upon the status of the partner or the partnership, the activities of the partnership and certain determinations made at the partner level. Accordingly, we urge partners in partnerships (including entities or arrangements treated as partnerships for U.S. federal income tax purposes) considering the purchase of our Class A common stock to consult with, and rely solely upon, their own tax advisors regarding the U.S. federal income tax considerations of the purchase, ownership and disposition of our Class A common stock by such partnership.

Distributions

Distributions of cash or other property on our Class A common stock, if any, will constitute dividends for U.S. federal income tax purposes to the extent paid from our current or accumulated earnings and profits, as determined under U.S. federal income tax principles. To the extent those distributions exceed our current and accumulated earnings and profits, the distributions will be treated as a non-taxable return of capital to the extent of the non-U.S. holder’s tax basis in our Class A common stock (and will reduce tax basis, but not below zero) and thereafter as capital gain from the sale or exchange of such Class A common stock. Please see “—Gain on Sale or Other Taxable Disposition of Class A Common Stock.” Subject to the withholding requirements under FATCA (as defined below) and other than with respect to effectively connected dividends, each of which is discussed below, any distribution treated as a dividend paid to a non-U.S. holder on our Class A common stock generally will be subject to U.S. withholding tax at a rate of 30% of the gross amount of the distribution unless an applicable income tax treaty provides for a lower rate. To receive the benefit of a reduced treaty rate, a non-U.S. holder must provide the applicable withholding agent with a properly executed IRS Form W-8BEN or IRS Form W-8BEN-E (or other applicable or successor form) certifying qualification for the reduced rate.


203


Table of Contents

Any portion of a distribution that is treated as a dividend paid to a non-U.S. holder that is effectively connected with a trade or business conducted by the non-U.S. holder in the United States (and, if required by an applicable income tax treaty, that is treated as attributable to a permanent establishment maintained by the non-U.S. holder in the United States) generally will be taxed on a net income basis at the rates and in the manner generally applicable to United States persons. Such effectively connected dividends will not be subject to U.S. withholding tax if the non-U.S. holder satisfies certain certification requirements by providing the applicable withholding agent with a properly executed IRS Form W-8ECI certifying eligibility for exemption. If the non-U.S. holder is a corporation for U.S. federal income tax purposes, it may also be subject to a branch profits tax (at a 30% rate or such lower rate as specified by an applicable income tax treaty) on its effectively connected earnings and profits (as adjusted for certain items), which will include effectively connected dividends.

Gain on Sale or Other Taxable Disposition of Class A Common Stock

Subject to the discussions below under “—Backup Withholding and Information Reporting” and “—Additional Withholding Requirements under FATCA,” a non-U.S. holder generally will not be subject to U.S. federal income or withholding tax on any gain realized upon the sale or other taxable disposition of our Class A common stock unless:


the non-U.S. holder is an individual who is present in the United States for a period or periods aggregating 183 days or more during the calendar year in which the sale or disposition occurs and certain other conditions are met;


the gain is effectively connected with a trade or business conducted by the non-U.S. holder in the United States (and, if required by an applicable income tax treaty, is attributable to a permanent establishment maintained by the non-U.S. holder in the United States); or


our Class A common stock constitutes a United States real property interest by reason of our status as a United States real property holding corporation (“USRPHC”) for U.S. federal income tax purposes and as a result such gain is treated as effectively connected with a trade or business conducted by the non-U.S. holder in the United States.

A non-U.S. holder described in the first bullet point above will be subject to U.S. federal income tax at a rate of 30% (or such lower rate as specified by an applicable income tax treaty) on the amount of such gain, which generally may be offset by U.S. source capital losses provided the non-U.S. holder has timely filed U.S. federal income tax returns with respect to such losses.

A non-U.S. holder whose gain is described in the second bullet point above or, subject to the exceptions described in the next paragraph, the third bullet point above, generally will be taxed on a net income basis at the rates and in the manner generally applicable to United States persons unless an applicable income tax treaty provides otherwise. If the non-U.S. holder is a corporation for U.S. federal income tax purposes whose gain is described in the second bullet point above, then such gain would also be included in its effectively connected earnings and profits (as adjusted for certain items), which may be subject to a branch profits tax (at a 30% rate or such lower rate as specified by an applicable income tax treaty).

Generally, a corporation is a USRPHC if the fair market value of its United States real property interests equals or exceeds 50% of the sum of the fair market value of its worldwide real property interests and its other assets used or held for use in a trade or business. We believe that we currently are, and expect to remain for the foreseeable future, a USRPHC for U.S. federal income tax purposes. However, as long as our Class A common stock is and continues to be “regularly traded on an established securities market” (within the meaning of the United States Treasury regulations), only a non-U.S. holder that actually or constructively owns, or owned at any time during the shorter of the


204


Table of Contents

five-year period ending on the date of the disposition or the non-U.S. holder’s holding period for the Class A common stock, more than 5% of our Class A common stock will be treated as disposing of a United States real property interest and will be taxable on gain realized on the disposition of our Class A common stock as a result of our status as a USRPHC. If our Class A common stock were not considered to be regularly traded on an established securities market, each non-U.S. holder (regardless of the percentage of stock owned) would be treated as disposing of a U.S. real property interest and would be subject to U.S. federal income tax on a taxable disposition of our Class A common stock (as described in the preceding paragraph), and a 15% withholding tax would apply to the gross proceeds from such disposition.

Non-U.S. holders should consult with, and rely solely upon, their own tax advisors with respect to the application of the foregoing rules to their ownership and disposition of our Class A common stock, including regarding potentially applicable income tax treaties that may provide for different rules.

Backup Withholding and Information Reporting

Any dividends paid to a non-U.S. holder must be reported annually to the IRS and to the non-U.S. holder. Copies of these information returns may be made available to the tax authorities in the country in which the non-U.S. holder resides or is established. Payments of dividends to a non-U.S. holder generally will not be subject to backup withholding if the non-U.S. holder establishes an exemption by properly certifying its non-U.S. status on an IRS Form W-8BEN or IRS Form W-8BEN-E (or other applicable or successor form).

Payments of the proceeds from a sale or other disposition by a non-U.S. holder of our Class A common stock effected by or through a U.S. office of a broker generally will be subject to information reporting and backup withholding (at the applicable rate) unless the non-U.S. holder establishes an exemption by properly certifying its non-U.S. status on an IRS Form W-8BEN or IRS Form W-8BEN-E (or other applicable or successor form) and certain other conditions are met. Information reporting and backup withholding generally will not apply to any payment of the proceeds from a sale or other disposition of our Class A common stock effected outside the United States by a non-U.S. office of a broker. However, unless such broker has documentary evidence in its records that the non-U.S. holder is not a United States person and certain other conditions are met, or the non-U.S. holder otherwise establishes an exemption, information reporting will apply to a payment of the proceeds of the disposition of our Class A common stock effected outside the United States by such a broker if it has certain relationships within the United States.

Backup withholding is not an additional tax. Rather, the U.S. federal income tax liability (if any) of persons subject to backup withholding will be reduced by the amount of tax withheld. If backup withholding results in an overpayment of taxes, a refund may be obtained, provided that the required information is timely furnished to the IRS.

Additional Withholding Requirements under FATCA

The Foreign Account Tax Compliance Act (Sections 1471 through 1474 of the Code), and the U.S. Treasury regulations and administrative guidance issued thereunder (“FATCA”), impose a 30% withholding tax on any dividends paid on our Class A common stock and, subject to the proposed U.S. Treasury regulations discussed below, on proceeds from sales or other dispositions of shares of our Class A common stock, if paid to a “foreign financial institution” or a “non-financial foreign entity” (each as defined in the Code) (including, in some cases, when such foreign financial institution or non-financial foreign entity is acting as an intermediary), unless (i) in the case of a foreign financial institution, such institution enters into an agreement with the U.S. government to withhold on certain


205


Table of Contents

payments, and to collect and provide to the U.S. tax authorities substantial information regarding U.S. account holders of such institution (which includes certain equity and debt holders of such institution, as well as certain account holders that are non-U.S. entities with U.S. owners); (ii) in the case of a non-financial foreign entity, such entity certifies that it does not have any “substantial United States owners” (as defined in the Code) or provides the applicable withholding agent with a certification identifying the direct and indirect substantial United States owners of the entity (in either case, generally on an IRS Form W-8BEN-E); or (iii) the foreign financial institution or non-financial foreign entity otherwise qualifies for an exemption from these rules and provides appropriate documentation (such as an IRS Form W-8BEN-E). Foreign financial institutions located in jurisdictions that have an intergovernmental agreement with the United States governing these rules may be subject to different rules. Under certain circumstances, a holder might be eligible for refunds or credits of such taxes. While gross proceeds from a sale or other disposition of our Class A common stock paid after January 1, 2019 would have originally been subject to withholding under FATCA, proposed U.S. Treasury regulations provide that such payments of gross proceeds do not constitute withholdable payments. Taxpayers may generally rely on these proposed U.S. Treasury regulations until they are revoked or final U.S. Treasury regulations are issued. Non-U.S. holders are encouraged to consult with, and rely solely upon, their own tax advisors regarding the effects of FATCA on an investment in our Class A common stock.

INVESTORS CONSIDERING THE PURCHASE OF OUR CLASS A COMMON STOCK SHOULD CONSULT WITH, AND RELY SOLELY UPON, THEIR OWN TAX ADVISORS REGARDING THE APPLICATION OF THE U.S. FEDERAL INCOME TAX LAWS (INCLUDING ANY POTENTIAL FUTURE CHANGES THERETO) TO THEIR PARTICULAR SITUATIONS AND THE APPLICABILITY AND EFFECT OF ANY OTHER TAX LAWS, INCLUDING U.S. FEDERAL ESTATE AND GIFT TAX LAWS AND ANY U.S. STATE OR LOCAL OR NON-U.S. TAX LAWS, AND TAX TREATIES.


206


Table of Contents

CERTAIN ERISA CONSIDERATIONS

The following is a summary of certain considerations associated with the acquisition and holding of our Class A common stock by employee benefit plans that are subject to Title I of the Employee Retirement Income Security Act of 1974, as amended (“ERISA”), plans, individual retirement accounts and other arrangements that are subject to Section 4975 of the Code or employee benefit plans that are governmental plans (as defined in Section 3(32) of ERISA), certain church plans (as defined in Section 3(33) of ERISA), non-U.S. plans (as described in Section 4(b)(4) of ERISA) or other plans that are not subject to the foregoing but may be subject to provisions under any other federal, state, local, non-U.S. or other laws or regulations that are similar to such provisions of ERISA or the Code (collectively, “Similar Laws”), and entities whose underlying assets are considered to include “plan assets” of any such plan, account or arrangement (each, a “Plan”).

This summary is based on the provisions of ERISA and the Code (and related regulations and administrative and judicial interpretations) as of the date of this registration statement. This summary does not purport to be complete, and no assurance can be given that future legislation, court decisions, regulations, rulings or pronouncements will not significantly modify the requirements summarized below. Any of these changes may be retroactive and may thereby apply to transactions entered into prior to the date of their enactment or release. This discussion is general in nature and is not intended to be all inclusive, nor should it be construed as investment or legal advice.

General Fiduciary Matters

ERISA and the Code impose certain duties on persons who are fiduciaries of a Plan subject to Title I of ERISA or Section 4975 of the Code (an “ERISA Plan”) and prohibit certain transactions involving the assets of an ERISA Plan and its fiduciaries or other interested parties. Under ERISA and the Code, any person who exercises any discretionary authority or control over the administration of an ERISA Plan or the management or disposition of the assets of an ERISA Plan, or who renders investment advice for a fee or other compensation to an ERISA Plan, is generally considered to be a fiduciary of the ERISA Plan.

In considering an investment in our Class A common stock with a portion of the assets of any Plan, a fiduciary should consider the Plan’s particular circumstances and all of the facts and circumstances of the investment and determine whether the acquisition and holding of our Class A common stock is in accordance with the documents and instruments governing the Plan and the applicable provisions of ERISA, the Code or any Similar Law relating to the fiduciary’s duties to the Plan, including, without limitation:


whether the investment is prudent under Section 404(a)(1)(B) of ERISA and any other applicable Similar Laws;


whether, in making the investment, the ERISA Plan will satisfy the diversification requirements of Section 404(a)(1)(C) of ERISA and any other applicable Similar Laws;


whether the investment is permitted under the terms of the applicable documents governing the Plan;


whether the acquisition or holding of our Class A common stock will constitute a “prohibited transaction” under Section 406 of ERISA or Section 4975 of the Code (please see the discussion under “—Prohibited Transaction Issues” below); and


whether the Plan will be considered to hold, as plan assets, (i) only our Class A common stock or (ii) an undivided interest in our underlying assets (please see the discussion under “—Plan Asset Issues” below).


207


Table of Contents

Prohibited Transaction Issues

Section 406 of ERISA and Section 4975 of the Code prohibit ERISA Plans from engaging in specified transactions involving plan assets with persons or entities who are “parties in interest,” within the meaning of ERISA, or “disqualified persons,” within the meaning of Section 4975 of the Code, unless an exemption is available. A party in interest or disqualified person who engages in a non-exempt prohibited transaction may be subject to excise taxes and other penalties and liabilities under ERISA and the Code. In addition, the fiduciary of the ERISA Plan that engages in such a non-exempt prohibited transaction may be subject to penalties and liabilities under ERISA and the Code. The acquisition and/or holding of our Class A common stock by an ERISA Plan with respect to which the issuer, the initial purchaser, or a guarantor is considered a party in interest or a disqualified person may constitute or result in a direct or indirect prohibited transaction under Section 406 of ERISA and/or Section 4975 of the Code, unless the investment is acquired and is held in accordance with an applicable statutory, class or individual prohibited transaction exemption.

Because of the foregoing, our Class A common stock should not be acquired or held by any person investing “plan assets” of any Plan, unless such acquisition and holding will not constitute a non-exempt prohibited transaction under ERISA and the Code or a similar violation of any applicable Similar Laws.

Plan Asset Issues

Additionally, a fiduciary of a Plan should consider whether the Plan will, by investing in us, be deemed to own an undivided interest in our assets, with the result that we would become a fiduciary of the Plan and our operations would be subject to the regulatory restrictions of ERISA, including its prohibited transaction rules, as well as the prohibited transaction rules of the Code and any other applicable Similar Laws.

The DOL regulations provide guidance with respect to whether the assets of an entity in which ERISA Plans acquire equity interests would be deemed “plan assets” under some circumstances. Under these regulations, an entity’s assets generally would not be considered to be “plan assets” if, among other things:

(a) the equity interests acquired by ERISA Plans are “publicly offered securities” (as defined in the DOL regulations)—i.e., the equity interests are part of a class of securities that is widely held by 100 or more investors independent of the issuer and each other, are freely transferable, and are either registered under certain provisions of the federal securities laws or sold to the ERISA Plan as part of a public offering under certain conditions;

(b) the entity is an “operating company” (as defined in the DOL regulations)—i.e., it is primarily engaged in the production or sale of a product or service, other than the investment of capital, either directly or through a majority-owned subsidiary or subsidiaries; or

(c) there is no significant investment by “benefit plan investors” (as defined in the DOL regulations)—i.e., immediately after the most recent acquisition by an ERISA Plan of any equity interest in the entity, less than 25% of the total value of each class of equity interest (disregarding certain interests held by persons (other than benefit plan investors) with discretionary authority or control over the assets of the entity or who provide investment advice for a fee (direct or indirect) with respect to such assets, and any affiliates thereof) is held by ERISA Plans, IRAs and certain other Plans (but not including governmental plans, foreign plans and certain church plans), and entities whose underlying assets are deemed to include plan assets by reason of a Plan’s investment in the entity.


208


Table of Contents

Due to the complexity of these rules and the excise taxes, penalties and liabilities that may be imposed upon persons involved in non-exempt prohibited transactions, it is particularly important that fiduciaries, or other persons considering acquiring and/or holding shares of our common stock on behalf of, or with the assets of, any Plan, consult with their counsel regarding the potential applicability of ERISA, Section 4975 of the Code and any Similar Laws to such investment and whether an exemption would be applicable to the acquisition and holding of our Class A common stock. Purchasers of our Class A common stock have the exclusive responsibility for ensuring that their acquisition and holding of our Class A common stock complies with the fiduciary responsibility rules of ERISA and does not violate the prohibited transaction rules of ERISA, the Code or applicable Similar Laws. The sale of our Class A common stock to a Plan is in no respect a representation by us or any of our affiliates or representatives that such an investment meets all relevant legal requirements with respect to investments by any such Plan or that such investment is appropriate for any such Plan.


209


Table of Contents

UNDERWRITING

We and the underwriters named below have entered into an underwriting agreement with respect to shares of our Class A common stock being offered. Subject to certain conditions, each underwriter has severally agreed to purchase the number of shares of Class A common stock indicated in the following table.


Underwriters

   Number of Shares  

Goldman Sachs & Co. LLC


BofA Securities, Inc.


Piper Sandler & Co.


RBC Capital Markets, LLC


Barclays Capital Inc.


Citigroup Global Markets Inc.


Raymond James & Associates, Inc.


Johnson Rice & Company LLC


Stephens Inc.


Capital One Securities, Inc.


PEP Advisory LLC


Drexel Hamilton, LLC


Total


Analyst Hub Securities, LLC has participated as a member of the selling group in this transaction, through its registered representatives, John Daniel and Sean Mitchell.

The underwriters are committed to take and pay for all of the shares of Class A common stock being offered, if any are taken, other than the shares covered by the option described below unless and until this option is exercised.

The underwriters have an option to buy up to an additional                shares of Class A common stock from us to cover sales by the underwriters of a greater number of shares than the total number in the table above. They may exercise that option for 30 days. If any shares are purchased pursuant to this option, the underwriters will severally purchase shares in approximately the same proportion as set forth in the table above.

Shares sold by the underwriters to the public will initially be offered at the initial public offering price set forth on the cover of this prospectus. Any shares sold by the underwriters to securities dealers may be sold at a discount of up to $                per share from the initial public offering price. After the initial offering of the shares, the representatives may change the offering price and the other selling terms. The offering of the shares by the underwriters is subject to receipt and acceptance and subject to the underwriters’ right to reject any order in whole or in part.

We have agreed to indemnify the several underwriters against certain liabilities, including liabilities under the Securities Act.

The following table provides information regarding the amount of the underwriting discounts and commissions to be paid to the underwriters by us. These amounts are shown assuming both no exercise and full exercise of the underwriters’ option to purchase additional shares.


     Per Share      Total Without
Option
     With Option  

Underwriting discounts and commissions paid by us

   $                    $                $                

Proceeds, before expenses, to us

   $        $        $    


210


Table of Contents

We estimate that the total expenses of the offering, excluding underwriting discounts and commissions, will be approximately $                million. We have also agreed to reimburse the underwriters for certain of their expenses in an amount up to $                .

The representatives have informed us that the underwriters do not intend to make sales to discretionary accounts.

We, certain of our security holders, our officers and directors have agreed with the underwriters, subject to certain exceptions, not to dispose of or hedge any of their Class A common stock or securities convertible into or exchangeable for shares of Class A common stock during the period from the date of this prospectus continuing through the date 180 days after the date of this prospectus, except with the prior written consent of Goldman Sachs & Co. LLC, BofA Securities Inc. and Piper Sandler & Co. This agreement does not apply to any existing employee benefit plans. Please see the section titled “Shares Eligible for Future Sale” for a discussion of certain transfer restrictions.

Prior to the offering, there has been no public market for the Class A common stock. The initial public offering price will be negotiated among us and our representatives. Among the factors to be considered in determining the initial public offering price of the Class A common stock, in addition to prevailing market conditions, will be our historical performance, estimates of the business potential and our earnings prospects, an assessment of our management and the consideration of the above factors in relation to market valuation of companies in related businesses.

We have applied to list our Class A common stock on NYSE under the symbol “AESI.”

Lock-Up Restrictions

We, certain of our security holders, our officers and directors have entered into lock-up agreements pursuant to which, subject to certain exceptions, we and they have agreed, for a period of 180 days after the date of this prospectus, not to directly or indirectly offer, sell, contract to sell or otherwise dispose of or transfer any shares or any securities convertible into or exchangeable for shares of our capital stock, without the prior written consent of the representatives. Our amended and restated certificate of incorporation will provide that, subject to customary exceptions, all of the shares of Common Stock held by the Legacy Owners may not be sold, pledged, transferred or otherwise disposed of for 180 days following the consummation of this offering, without the prior written consent of the representatives. Following the expiration of such lock-up restrictions, the Legacy Owners, subject to compliance with the Securities Act or exceptions therefrom, will be able to freely trade their Class A Common Stock, including any shares issued upon exchange of Atlas Units. These restrictions also preclude any hedging collar or other transaction designed or reasonably expected to result in a disposition of shares of Class A common stock or securities convertible into or exercisable or exchangeable for shares of Class A common stock. The representatives may, in their sole discretion and at any time without notice, release all or any portion of the securities subject to these restrictions. The representatives do not have any present intent or any understanding to release all or any portion of the securities subject to these restrictions.

Stabilization

In connection with the offering, the underwriters may purchase and sell shares of Class A common stock in the open market. These transactions may include short sales, stabilizing transactions and purchases to cover positions created by short sales. Short sales involve the sale by the underwriters of a greater number of shares than they are required to purchase in the offering, and a short position represents the amount of such sales that have not been covered by subsequent purchases. A “covered short position” is a short position that is not greater than the amount of


211


Table of Contents

additional shares for which the underwriters’ option described above may be exercised. The underwriters may cover any covered short position by either exercising their option to purchase additional shares or purchasing shares in the open market. In determining the source of shares to cover the covered short position, the underwriters will consider, among other things, the price of shares available for purchase in the open market as compared to the price at which they may purchase additional shares pursuant to the option described above. “Naked” short sales are any short sales that create a short position greater than the amount of additional shares for which the option described above may be exercised. The underwriters must cover any such naked short position by purchasing shares in the open market. A naked short position is more likely to be created if the underwriters are concerned that there may be downward pressure on the price of the Class A common stock in the open market after pricing that could adversely affect investors who purchase in the offering. Stabilizing transactions consist of various bids for or purchases of Class A common stock made by the underwriters in the open market prior to the completion of the offering.

The underwriters may also impose a penalty bid. This occurs when a particular underwriter repays to the underwriters a portion of the underwriting discount received by it because the representatives have repurchased shares sold by or for the account of such underwriter in stabilizing or short covering transactions.

Purchases to cover a short position and stabilizing transactions, as well as other purchases by the underwriters for their own accounts, may have the effect of preventing or retarding a decline in the market price of our stock, and together with the imposition of the penalty bid, may stabilize, maintain or otherwise affect the market price of the Class A common stock. As a result, the price of the Class A common stock may be higher than the price that otherwise might exist in the open market. The underwriters are not required to engage in these activities and may end any of these activities at any time. These transactions may be effected in any trading market.

Neither we nor the underwriters make any representation or prediction as to the effect that the transactions described above may have on the prices of our Class A common stock. These transactions may occur on any trading market. If any of these transactions are commenced, they may be discontinued without notice at any time.

Certain Relationships

Some of the underwriters and their affiliates have engaged in, and may in the future engage in, investment banking and other commercial dealings in the ordinary course of business with us or our affiliates. They have received, or may in the future receive, customary fees and commissions for these transactions.

For example, Goldman Sachs & Co. LLC acted as a joint bookrunner in the initial public offering of Brigham Minerals, Inc., a publicly traded company co-founded by our Executive Chairman and Chief Executive Officer, Bud Brigham.

The underwriters and their respective affiliates are full service financial institutions engaged in various activities, which may include sales and trading, commercial and investment banking, advisory, investment management, investment research, principal investment, hedging, market making, brokerage and other financial and non-financial activities and services. Certain of the underwriters and their respective affiliates have provided, and may in the future provide, a variety of these services to the issuer and to persons and entities with relationships with the issuer, for which they received or will receive customary fees and expenses.


212


Table of Contents

In the ordinary course of their various business activities, the underwriters and their respective affiliates, officers, directors and employees may purchase, sell or hold a broad array of investments and actively traded securities, derivatives, loans, commodities, currencies, credit default swaps and other financial instruments for their own account and for the accounts of their customers, and such investment and trading activities may involve or relate to assets, securities and/or instruments of the issuer (directly, as collateral securing other obligations or otherwise) and/or persons and entities with relationships with the issuer. The underwriters and their respective affiliates may also communicate independent investment recommendations, market color or trading ideas and/or publish or express independent research views in respect of such assets, securities or instruments and may at any time hold, or recommend to clients that they should acquire, long and/or short positions in such assets, securities and instruments.

Electronic Prospectus

This prospectus may be made available in electronic format on Internet sites or through other online services maintained by the underwriters or their affiliates. In those cases, prospective investors may view offering terms online and may be allowed to place orders online. Other than this prospectus in electronic format, any information on the underwriters’ or their affiliates’ websites and any information contained in any other website maintained by the underwriters or any affiliate of the underwriters is not part of this prospectus or the registration statement of which this prospectus forms a part, has not been approved and/or endorsed by us or the underwriters and should not be relied upon by investors.

Directed Share Program

At our request, an affiliate of BofA Securities, Inc., a participating Underwriter, has reserved for sale, at the initial public offering price, up to 5% of the shares offered by this prospectus for sale to some of our directors, officers, employees, distributors, dealers, business associates and related persons. If these persons purchase reserved shares it will reduce the number of shares available for sale to the general public. Any reserved shares that are not so purchased will be offered by the underwriters to the general public on the same terms as the other shares offered by this prospectus.

Notice to Prospective Investors in Canada (Alberta, British Columbia, Manitoba, Ontario and Québec Only)

This document constitutes an “exempt offering document” as defined in and for the purposes of applicable Canadian securities laws. No prospectus has been filed with any securities commission or similar regulatory authority in Canada in connection with the offer and sale of shares of Class A common stock described herein (the “Securities”). No securities commission or similar regulatory authority in Canada has reviewed or in any way passed upon this document or on the merits of the Securities and any representation to the contrary is an offence.

Canadian investors are advised that this document has been prepared in reliance on section 3A.3 of National Instrument 33-105 Underwriting Conflicts (“NI 33-105”). Pursuant to section 3A.3 of NI 33-105, this document is exempt from the requirement that the issuer and the underwriters in the offering provide Canadian investors with certain conflicts of interest disclosure pertaining to “connected issuer” and/or “related issuer” relationships as may otherwise be required pursuant to subsection 2.1(1) of NI 33-105.


213


Table of Contents

Resale Restrictions

The offer and sale of the Securities in Canada are being made on a private placement basis only and are exempt from the requirement that the issuer prepare and file a prospectus under applicable Canadian securities laws. Any resale of Securities acquired by a Canadian investor in this offering must be made in accordance with applicable Canadian securities laws, which may vary depending on the relevant jurisdiction, and which may require resales to be made in accordance with Canadian prospectus requirements, a statutory exemption from the prospectus requirements, in a transaction exempt from the prospectus requirements or otherwise under a discretionary exemption from the prospectus requirements granted by the applicable local Canadian securities regulatory authority. These resale restrictions may under certain circumstances apply to resales of the Securities outside of Canada.

Representations of Purchasers

Each Canadian investor who purchases the Securities will be deemed to have represented to the issuer, the underwriters and each dealer from whom a purchase confirmation is received, as applicable, that the investor (i) is purchasing as principal, or is deemed to be purchasing as principal in accordance with applicable Canadian securities laws, for investment only and not with a view to resale or redistribution; (ii) is an “accredited investor” as such term is defined in section 1.1 of National Instrument 45-106 Prospectus Exemptions or, in Ontario, as such term is defined in section 73.3(1) of the Securities Act (Ontario); and (iii) is a “permitted client” as such term is defined in section 1.1 of National Instrument 31-103 Registration Requirements, Exemptions and Ongoing Registrant Obligations.

Taxation and Eligibility for Investment

This prospectus does not address any Canadian tax considerations. No representation or warranty is hereby made as to the tax consequences to a resident, or deemed resident, of Canada of an investment in the Securities or with respect to the eligibility of the Securities for investment by such investor under relevant Canadian federal and provincial legislation and regulations.

Rights of Action for Damages or Rescission

Securities legislation in certain provinces or territories of Canada may provide a purchaser with remedies for rescission or damages if this prospectus (including any amendment thereto) contains a misrepresentation, provided that the remedies for rescission or damages are exercised by the purchaser within the time limit prescribed by the securities legislation of the purchaser’s province or territory. The purchaser should refer to any applicable provisions of the securities legislation of the purchaser’s province or territory for particulars of these rights or consult with a legal advisor.

Personal Information

We and the representatives hereby notify prospective Canadian purchasers that: (a) we may be required to provide personal information pertaining to the purchaser as required to be disclosed in Schedule I of Form 45-106F1 under NI 45-106 (including its name, address, telephone number, email address, if provided, and the number and type of securities purchased, the total purchase price paid for such securities, the date of the purchase and specific details of the prospectus exemption relied upon under applicable securities laws to complete such purchase) (“personal information”), which Form 45-106F1 may be required to be filed by us under NI 45-106, (b) such personal information may be delivered to the securities regulatory authority or regulator in accordance with NI 45-106, (c) such personal information is being collected indirectly by the securities regulatory authority or regulator under the authority granted to it under the securities legislation of the applicable legislation, (d) such


214


Table of Contents

personal information is collected for the purposes of the administration and enforcement of the securities legislation of the applicable jurisdiction, and (e) the purchaser may contact the applicable securities regulatory authority or regulator by way of the contact information provided in Schedule 2 to Form 45-106F1. Prospective Canadian purchasers that purchase securities in this offering will be deemed to have authorized the indirect collection of the personal information by each applicable securities regulatory authority or regulator, and to have acknowledged and consented to such information being disclosed to the Canadian securities regulatory authority or regulator, and to have acknowledged that such information may become available to the public in accordance with requirements of applicable Canadian laws.

Notice to Prospective Investors in the European Economic Area

In relation to each Member State of the European Economic Area (each, a “Member State”), no Class A common stock has been offered or will be offered pursuant to the offering to the public in that Member State prior to the publication of a prospectus in relation to our Class A common stock which has been approved by the competent authority in that Member State or, where appropriate, approved in another Member State and notified to the competent authority in that Member State, all in accordance with Regulation (EU) 2017/1129 (the “Prospectus Regulation”), except that offers of shares may be made to the public in that Member State at any time under the following exemptions under the Prospectus Regulation:

(a) to any legal entity which is a qualified investor as defined in the Prospectus Regulation;

(b) by the underwriters to fewer than 150 natural or legal persons (other than qualified investors as defined in the Prospectus Regulation), subject to obtaining the prior written consent of the representatives for any such offer; or

(c) in any other circumstances falling within Article 1(4) of the Prospectus Regulation, provided that no such offer of Class A common stock shall result in a requirement for us or any underwriter to publish a prospectus pursuant to Article 3 of the Prospectus Regulation or supplement a prospectus pursuant to Article 23 of the Prospectus Regulation.

Each person in a Member State who initially acquires any Class A common stock or to whom any offer is made will be deemed to have represented, acknowledged, and agreed with us and the representatives that it is a qualified investor within the meaning of the Prospectus Regulation.

In the case of any Class A common stock being offered to a financial intermediary as that term is used in Article 5(1) of the Prospectus Regulation, each such financial intermediary will be deemed to have represented, acknowledged, and agreed that the Class A common stock acquired by it in the offer have not been acquired on a non-discretionary basis on behalf of, nor have they been acquired with a view to their offer or resale to, persons in circumstances which may give rise to an offer to the public other than their offer or resale in a Member State to qualified investors, in circumstances in which the prior written consent of the representatives has been obtained to each such proposed offer or resale.

We, the underwriters and their affiliates will rely upon the truth and accuracy of the foregoing representations, acknowledgments, and agreements.

For the purposes of this provision, the expression an “offer to the public” in relation to any Class A common stock in any Member State means the communication in any form and by any means of sufficient information on the terms of the offer and any Class A common stock to be offered so as to enable an investor to decide to purchase or subscribe for our Class A common stock, and the expression “Prospectus Regulation” means Regulation (EU) 2017/1129.


215


Table of Contents

Additional Notice to Prospective Investors in the United Kingdom

No shares have been offered or will be offered pursuant to the offering to the public in the United Kingdom prior to the publication of a prospectus in relation to the shares which has been approved by the Financial Conduct Authority, except that the shares may be offered to the public in the United Kingdom at any time:

(a) to any legal entity which is a qualified investor as defined under Article 2 of the UK Prospectus Regulation;

(b) to fewer than 150 natural or legal persons (other than qualified investors as defined under Article 2 of the UK Prospectus Regulation), subject to obtaining the prior consent of the representatives for any such offer; or

(c) in any other circumstances falling within Section 86 of the FSMA,

provided that no such offer of the shares to the public in the United Kingdom shall require us or any underwriter to publish a prospectus pursuant to Section 85 of the FSMA or supplement a prospectus pursuant to Article 23 of the UK Prospectus Regulation. For the purposes of this provision, the expression an “offer to the public” in relation to the shares in the United Kingdom means the communication in any form and by any means of sufficient information on the terms of the offer and any shares to be offered so as to enable an investor to decide to purchase or subscribe for any shares and the expression “UK Prospectus Regulation” means Regulation (EU) 2017/1129 as it forms part of domestic law by virtue of the European Union (Withdrawal) Act 2018. (a) it has only communicated or caused to be communicated and will only communicate or cause to be communicated an invitation or inducement to engage in investment activity (within the meaning of Section 21 of the Financial Services and Markets Act 2000 (FSMA)) received by it in connection with the issue or sale of our Class A common stock in circumstances in which Section 21(1) of the FSMA does not apply to us.

Notice to Prospective Investors in Germany

This prospectus has not been prepared in accordance with the requirements for a securities or sales prospectus under the German Securities Prospectus Act (Wertpapierprospektgesetz), the German Sales Prospectus Act (Verkaufsprospektgesetz), or the German Investment Act (Investmentgesetz). Neither the German Federal Financial Services Supervisory Authority (Bundesanstalt für finanzdienstleistungsaufsicht—BaFin) nor any other German authority has been notified of the intention to distribute our Class A common stock in Germany. Consequently, shares of the Class A common stock may not be distributed in Germany by way of public offering, public advertisement or in any similar manner and this prospectus and any other document relating to this offering, as well as information or statements contained therein, may not be supplied to the public in Germany or used in connection with any offer for subscription of shares of the Class A common stock to the public in Germany or any other means of public marketing. Shares of Class A common stock is being offered and sold in Germany only to qualified investors which are referred to in Section 3 paragraph 2 no. 1, in connection with Section 2 no. 6, of the German Securities Prospectus Act, Section 8f paragraph 2 no. 4 of the German Sales Prospectus Act, and in Section 2 paragraph 11 sentence 2 no. 1 of the German Investment Act. This prospectus is strictly for use of the person who has received it. It may not be forwarded to other persons or published in Germany.

Notice to Prospective Investors in Switzerland

This document is not intended to constitute an offer or solicitation to purchase or invest in the securities. The securities may not be publicly offered, directly or indirectly, in Switzerland within the meaning of the Swiss Financial Services Act (“FinSA”) and no application has or will be made to admit


216


Table of Contents

the securities to trading on any trading venue (exchange or multilateral trading facility) in Switzerland. Neither this document nor any other offering or marketing material relating to the securities constitutes a prospectus pursuant to the FinSA, and neither this document nor any other offering or marketing material relating to the securities may be publicly distributed or otherwise made publicly available in Switzerland.

Neither this document nor any other offering or marketing material relating to the offering, us or the securities have been or will be filed with or approved by any Swiss regulatory authority. In particular, this document will not be filed with, and the offer of securities will not be supervised by, the Swiss Financial Market Supervisory Authority FINMA (FINMA), and the offer of securities has not been and will not be authorized under the Swiss Federal Act on Collective Investment Schemes (“CISA”). The investor protection afforded to acquirers of interests in collective investment schemes under the CISA does not extend to acquirers of the securities.

Notice to Prospective Investors in Hong Kong

The shares may not be offered or sold in Hong Kong by means of any document other than (i) in circumstances which do not constitute an offer to the public within the meaning of the Companies (Winding Up and Miscellaneous Provisions) Ordinance (Cap. 32 of the Laws of Hong Kong) (“Companies (Winding Up and Miscellaneous Provisions) Ordinance”) or which do not constitute an invitation to the public within the meaning of the Securities and Futures Ordinance (Cap. 571 of the Laws of Hong Kong) (“Securities and Futures Ordinance”), or (ii) to “professional investors” as defined in the Securities and Futures Ordinance and any rules made thereunder, or (iii) in other circumstances which do not result in the document being a “prospectus” as defined in the Companies (Winding Up and Miscellaneous Provisions) Ordinance, and no advertisement, invitation or document relating to the shares may be issued or may be in the possession of any person for the purpose of issue (in each case whether in Hong Kong or elsewhere), which is directed at, or the contents of which are likely to be accessed or read by, the public in Hong Kong (except if permitted to do so under the securities laws of Hong Kong) other than with respect to shares which are or are intended to be disposed of only to persons outside Hong Kong or only to “professional investors” in Hong Kong as defined in the Securities and Futures Ordinance and any rules made thereunder.

Notice to Prospective Investors in Singapore

This prospectus has not been registered as a prospectus with the Monetary Authority of Singapore. Accordingly, this prospectus and any other document or material in connection with the offer or sale, or invitation for subscription or purchase, of the shares may not be circulated or distributed, nor may the shares be offered or sold, or be made the subject of an invitation for subscription or purchase, whether directly or indirectly, to persons in Singapore other than (i) to an institutional investor (as defined under Section 4A of the Securities and Futures Act, Chapter 289 of Singapore (the “SFA”)) under Section 274 of the SFA, (ii) to a relevant person (as defined in Section 275(2) of the SFA) pursuant to Section 275(1) of the SFA, or any person pursuant to Section 275(1A) of the SFA, and in accordance with the conditions specified in Section 275 of the SFA or (iii) otherwise pursuant to, and in accordance with the conditions of, any other applicable provision of the SFA, in each case subject to conditions set forth in the SFA.

Where the shares are subscribed or purchased under Section 275 of the SFA by a relevant person which is a corporation (which is not an accredited investor (as defined in Section 4A of the SFA)) the sole business of which is to hold investments and the entire share capital of which is owned by one or more individuals, each of whom is an accredited investor, the securities (as defined in Section 239(1) of the SFA) of that corporation shall not be transferable for 6 months after that corporation has acquired the shares under Section 275 of the SFA except: (1) to an institutional


217


Table of Contents

investor under Section 274 of the SFA or to a relevant person (as defined in Section 275(2) of the SFA), (2) where such transfer arises from an offer in that corporation’s securities pursuant to Section 275(1A) of the SFA, (3) where no consideration is or will be given for the transfer, (4) where the transfer is by operation of law, (5) as specified in Section 276(7) of the SFA, or (6) as specified in Regulation 32 of the Securities and Futures (Offers of Investments) (Shares and Debentures) Regulations 2005 of Singapore (“Regulation 32”).

Where the shares are subscribed or purchased under Section 275 of the SFA by a relevant person which is a trust (where the trustee is not an accredited investor (as defined in Section 4A of the SFA)) whose sole purpose is to hold investments and each beneficiary of the trust is an accredited investor, the beneficiaries’ rights and interest (howsoever described) in that trust shall not be transferable for 6 months after that trust has acquired the shares under Section 275 of the SFA except: (1) to an institutional investor under Section 274 of the SFA or to a relevant person (as defined in Section 275(2) of the SFA), (2) where such transfer arises from an offer that is made on terms that such rights or interest are acquired at a consideration of not less than $200,000 (or its equivalent in a foreign currency) for each transaction (whether such amount is to be paid for in cash or by exchange of securities or other assets), (3) where no consideration is or will be given for the transfer, (4) where the transfer is by operation of law, (5) as specified in Section 276(7) of the SFA, or (6) as specified in Regulation 32.

Notice to Prospective Investors in Japan

The securities have not been and will not be registered under the Financial Instruments and Exchange Act of Japan (Act No. 25 of 1948, as amended), or the FIEA. The securities may not be offered or sold, directly or indirectly, in Japan or to or for the benefit of any resident of Japan (including any person resident in Japan or any corporation or other entity organized under the laws of Japan) or to others for reoffering or resale, directly or indirectly, in Japan or to or for the benefit of any resident of Japan, except pursuant to an exemption from the registration requirements of the FIEA and otherwise in compliance with any relevant laws and regulations of Japan.


218


Table of Contents

LEGAL MATTERS

The validity of our Class A common stock offered by this prospectus will be passed upon for us by Vinson & Elkins L.L.P., Austin, Texas. The underwriters have been represented by Latham & Watkins LLP, Austin, Texas.

EXPERTS

The consolidated financial statements of our predecessor at December 31, 2022 and 2021 and for each of the three years in the period ended December 31, 2022, appearing in this Prospectus and Registration Statement have been audited by Ernst & Young LLP, independent registered public accounting firm, as set forth in their report thereon appearing elsewhere herein, and is included in reliance upon such report given on the authority of such firm as experts in accounting and auditing.

The balance sheets of Atlas Energy Solutions Inc. as of December 31, 2022 and February 3, 2022, appearing in this Prospectus and Registration Statement have been audited by Ernst & Young LLP, independent registered public accounting firm, as set forth in their report thereon appearing elsewhere herein, and is included in reliance upon such report given on the authority of such firm as experts in accounting and auditing.

The information appearing in this prospectus concerning estimates of our proven mineral reserves was derived from the report of John T. Boyd Company, independent mining engineers and geologists, as of December 31, 2021, and as updated for December 31, 2022, and has been included herein on the authority of John T. Boyd Company as experts with respect to the matters covered by such report and in giving such report.

WHERE YOU CAN FIND MORE INFORMATION

We have filed with the SEC a registration statement on Form S-1 (including the exhibits, schedules and amendments thereto) under the Securities Act, with respect to the shares of our Class A common stock offered hereby. This prospectus does not contain all of the information set forth in the registration statement and the exhibits and schedules thereto. For further information with respect to us and the Class A common stock offered hereby, we refer you to the registration statement and the exhibits and schedules filed therewith. Statements contained in this prospectus as to the contents of any contract, agreement or any other document are summaries of the material terms of such contract, agreement or other document. With respect to each of these contracts, agreements or other documents filed as an exhibit to the registration statement, reference is made to the exhibits for a more complete description of the matter involved. The SEC maintains a website that contains reports, proxy and information statements and other information regarding registrants that file electronically with the SEC. The address of the SEC’s website is www.sec.gov. A copy of the registration statement, of which this prospectus forms a part, and the exhibits and schedules thereto may be obtained from the SEC’s website.

As a result of this offering, we will become subject to full information reporting requirements of the Exchange Act. We will fulfill our obligations with respect to such requirements by filing periodic reports and other information with the SEC. We intend to furnish our stockholders with annual reports containing financial statements certified by an independent public accounting firm.


219


Table of Contents

INDEX TO FINANCIAL STATEMENTS


Contents

   Page  

Atlas Sand Company, LLC (Predecessor)


Audited Consolidated Financial Statements


Report of Independent Registered Public Accounting Firm

     F-2  

Consolidated Balance Sheets as of December 31, 2022 and 2021

     F-3  

Consolidated Statements of Operations for the Years Ended December  31, 2022, 2021 and 2020

     F-4  

Consolidated Statements of Cash Flows for the Years Ended December  31, 2022, 2021 and 2020

     F-5  

Consolidated Statements of Members’ Equity for the Years Ended December  31, 2022, 2021 and 2020

     F-6  

Notes to Consolidated Financial Statements

     F-7  

Atlas Energy Solutions Inc.


Audited Balance Sheet


Report of Independent Registered Public Accounting Firm

     F-36  

Balance Sheets as of December 31, 2022 and February 3, 2022

     F-37  

Notes to Balance Sheets

     F-38  


F-1


Table of Contents

REPORT OF INDEPENDENT REGISTERED PUBLIC ACCOUNTING FIRM

To the members and Board of Managers of Atlas Sand Company, LLC

Opinion on the Financial Statements

We have audited the accompanying consolidated balance sheets of Atlas Sand Company, LLC (the Company) as of December 31, 2022 and 2021, the related consolidated statements of operations, members’ equity and cash flows for each of the three years in the period ended December 31, 2022 and the related notes (collectively referred to as the “consolidated financial statements”). In our opinion, the consolidated financial statements present fairly, in all material respects, the financial position of the Company at December 31, 2022 and 2021, and the results of its operations and its cash flows for each of the three years in the period ended December 31, 2022 in conformity with U.S. generally accepted accounting principles.

Basis for Opinion

These financial statements are the responsibility of the Company’s management. Our responsibility is to express an opinion on the Company’s financial statements based on our audits. We are a public accounting firm registered with the Public Company Accounting Oversight Board (United States) (PCAOB) and are required to be independent with respect to the Company in accordance with the U.S. federal securities laws and the applicable rules and regulations of the Securities and Exchange Commission and the PCAOB.

We conducted our audits in accordance with the standards of the PCAOB. Those standards require that we plan and perform the audit to obtain reasonable assurance about whether the financial statements are free of material misstatement, whether due to error or fraud. The Company is not required to have, nor were we engaged to perform, an audit of its internal control over financial reporting. As part of our audits, we are required to obtain an understanding of internal control over financial reporting but not for the purpose of expressing an opinion on the effectiveness of the Company’s internal control over financial reporting. Accordingly, we express no such opinion.

Our audits included performing procedures to assess the risks of material misstatement of the financial statements, whether due to error or fraud, and performing procedures that respond to those risks. Such procedures included examining, on a test basis, evidence regarding the amounts and disclosures in the financial statements. Our audits also included evaluating the accounting principles used and significant estimates made by management, as well as evaluating the overall presentation of the financial statements. We believe that our audits provide a reasonable basis for our opinion.

We have served as the Company’s auditor since 2017.

/s/ Ernst & Young LLP

Austin, Texas

February 15, 2023


F-2


Table of Contents

ATLAS SAND COMPANY, LLC

Consolidated Balance Sheets

(In thousands, except share data)


     December 31,     December 31,  
     2022     2021  

Assets


Current assets:


Cash and cash equivalents

   $ 82,010     $ 40,401  

Accounts receivable

     73,341       29,135  

Accounts receivable—related parties

     1,051       283  

Inventories

     5,614       3,199  

Spare part inventories

     10,797       7,207  

Prepaid expenses and other current assets

     5,918       4,048  


Total current assets

     178,731       84,273  

Property, plant and equipment, net

     541,524       458,317  

Finance lease right-of-use assets

     19,173       —    

Operating lease right-of-use assets

     4,049       —    

Other long-term assets

     7,522       1,260  


Total assets

   $ 750,999     $ 543,850  


Liabilities & Members’ Equity


Current liabilities:


Accounts payable

   $ 31,645     $ 12,180  

Accounts payable—related parties

     154       617  

Accrued liabilities

     30,630       9,153  

Current portion of long-term debt

     20,586       15,563  

Deferred revenues

     —         2,000  

Other current liabilities

     5,659       1,125  


Total current liabilities

     88,674       40,638  

Long-term debt, net of discount and deferred financing costs

     126,588       159,712  

Deferred tax liabilities

     1,906       1,908  

Asset retirement obligation

     1,245       1,179  

Other long-term liabilities

     21,229       1,716  


Total liabilities

     239,642       205,153  

Members’ equity:


Class A units, 316,273,129 units outstanding as of December 31, 2022 and 2021

     276,273       276,273  

Class C units, 94,639,647 units outstanding as of December 31, 2022 and 2021

     94,640       94,640  

Class D units, 45,492,305 units outstanding as of December 31, 2022 and 2021

     36,225       36,225  

Class P units, 85,333 and 83,833 units outstanding as of December 31, 2022 and 2021, respectively

     —         —    

Unit-based compensation

     20,379       19,701  

Other capital

     (882     (882

Retained earnings (accumulated deficit)

     84,722       (87,260


Total members’ equity

     511,357       338,697  


Total liabilities and members’ equity

   $ 750,999     $ 543,850  


The accompanying notes are an integral part of these financial statements


F-3


Table of Contents

ATLAS SAND COMPANY, LLC

Consolidated Statements of Operations

(In thousands)


     For the Year Ended December 31,  
     2022     2021     2020  

Product sales

   $ 408,446     $ 142,519     $ 80,527  

Service sales

     74,278       29,885       31,245  


Total sales

     482,724       172,404       111,772  

Cost of sales (excluding depreciation, depletion and accretion expense)

     198,918       84,656       73,118  

Depreciation, depletion and accretion expense

     27,498       23,681       20,887  


Gross profit

     256,308       64,067       17,767  

Selling, general and administrative expense

     24,317       17,071       17,743  

Impairment of long-lived assets

     —         —         1,250  


Operating income (loss)

     231,991       46,996       (1,226

Interest expense, net

     (15,760     (42,198     (32,819

Other income (loss)

     2,631       291       (25


Income (loss) before income taxes

     218,862       5,089       (34,070

Income tax expense

     1,856       831       372  


Net income (loss)

   $ 217,006     $ 4,258     $ (34,442


The accompanying notes are an integral part of these financial statements


F-4


Table of Contents

ATLAS SAND COMPANY, LLC

Consolidated Statements of Cash Flows

(In thousands)


     For the Year Ended
December 31,
 
     2022     2021     2020  

Operating activities:


Net income (loss)

   $ 217,006     $ 4,258     $ (34,442

Adjustments to reconcile net income (loss) to net cash provided by operating activities:


Depreciation, depletion and accretion expense

     28,617       24,604       21,579  

Impairment of long-lived assets

     —         —         1,250  

Loss on extinguishment of debt

     —         11,922       —    

Amortization of debt discount

     457       7,320       8,110  

Amortization of deferred financing costs

     442       739       791  

Unit-based compensation expense

     678       129       2,545  

Deferred tax liabilities

     (2     360       372  

Interest paid-in-kind through issuance of additional term loans

     —         3,039       11,794  

Repayment of paid-in-kind interest borrowings

     —         (22,233     —    

Commodity derivatives gain

     (1,842     (55     —    

Settlements on commodity derivatives

     2,137       —         —    

Non-cash lease expense

     (220     —         —    

Other

     513       (105     118  

Changes in operating assets and liabilities:


Accounts receivable

     (44,207     (17,626     13,466  

Accounts receivable—related party

     (768     (188     49  

Inventories

     (2,415     (364     1,031  

Spare part inventories

     (4,239     (617     1,631  

Prepaid expenses and other current assets

     (2,030     (1,175     216  

Other long-term assets

     (6,549     (596     (66

Accounts payable

     7,881       5,744       (11,721

Accounts payable—related parties

     (464     480       127  

Deferred revenue

     (2,000     2,000        

Accrued liabilities and other liabilities

     13,017       3,720       (4,364


Net cash provided by operating activities

     206,012       21,356       12,486  


Investing activities:


Purchases of property, plant and equipment

     (89,592     (19,371     (9,532


Net cash used in investing activities

     (89,592     (19,371     (9,532


Financing Activities:


Proceeds from equity issuances

     —         12,613       —    

Proceeds from warrant exercises

     —         —         25  

Proceeds from term loan borrowings

     —         178,200       15,000  

Payments on term loan borrowings

     (28,544     (172,872     (7,291

Debt extinguishment cost

     —         (4,514     —    

Proceeds from SBA Loan

     —         —         4,413  

Issuance costs associated with debt financing

     (233     (660     —    

Payments under finance leases and capital leases

     (1,010     (423     (318

Member distributions

     (45,024     (10,000     (3


Net cash provided by (used in) financing activities

     (74,811     2,344       11,826  


Net increase in cash and cash equivalents

     41,609       4,329       14,780  

Cash and cash equivalents, beginning of period

     40,401       36,072       21,292  


Cash and cash equivalents, end of period

   $ 82,010     $ 40,401     $ 36,072  


Supplemental cash flow information


Cash paid during the period for:


Interest

   $ 14,904     $ 19,155     $ 12,106  


Taxes

   $ 468     $ 14     $ —    


Non-cash items:


Property, plant and equipment in accounts payable and accrued liabilities

   $ 23,298     $ 2,551     $ 440  


Issuance of warrants

   $ —       $ —       $ 2,154  


The accompanying notes are an integral part of these financial statements


F-5


Table of Contents

ATLAS SAND COMPANY, LLC

Consolidated Statements of Members’ Equity

(In thousands)


    Class A     Class C     Class D     Class P     Unit-Based
Compensation
    Other
Capital
    Retained
Earnings
(Accumulated
Deficit)
    Total
Members’
Equity
 
    Units     Value     Units     Value     Units     Value     Units     Value  

Balance at December 31, 2019

    313,701     $ 273,701       84,599     $ 84,599       42,977     $ 34,046       52     $ —       $ 17,027     $ —       $ (47,073   $ 362,300  

Issuance of class D units

    —         —         —         —         2,515       2,154       —         —         —         —         —         2,154  

Issuance of class P units

    —         —         —         —         —         —         30       —         —         —         —         —    

Member distributions

    —         —         —         —         —         —         —         —         —         —         (3     (3

Unit-based compensation expense

    —         —         —         —         —         —         —         —         2,545       —         —         2,545  

Proceeds from warrant exercises

    —         —         —         —         —         25       —         —         —         —         —         25  

Deferred tax liabilities

    —         —         —         —         —         —         —         —         —         (882     —         (882

Net loss

    —         —         —         —         —         —         —         —         —         —         (34,442     (34,442


Balance at December 31, 2020

    313,701     $ 273,701       84,599     $ 84,599       45,492     $ 36,225       82     $ —       $ 19,572     $ (882   $ (81,518   $ 331,697  

Issuance of class A units

    2,572       2,572       —         —         —         —         —         —         —         —         —         2,572  

Issuance of class C units

    —         —         10,041       10,041       —         —         —         —         —         —         —         10,041  

Issuance of class P units

    —         —         —         —         —         —         2       —         —         —         —         —    

Member distributions

    —         —         —         —         —         —         —         —         —         —         (10,000     (10,000

Unit-based compensation expense

    —         —         —         —         —         —         —         —         129       —         —         129  

Net income

    —         —         —         —         —         —         —         —         —         —         4,258       4,258  


Balance at December 31, 2021

    316,273     $ 276,273       94,640     $ 94,640       45,492     $ 36,225       84     $ —       $ 19,701     $ (882   $ (87,260   $ 338,697  

Issuance of class P units

    —         —         —         —         —         —         1       —         —         —         —         —    

Member distributions

    —         —         —         —         —         —         —         —         —         —         (45,024     (45,024

Unit-based compensation expense

    —         —         —         —         —         —         —         —         678       —         —         678  

Net income

    —         —         —         —         —         —         —         —         —         —         217,006       217,006  


Balance at December 31, 2022

    316,273     $ 276,273       94,640     $ 94,640       45,492     $ 36,225       85     $ —       $ 20,379     $ (882   $ 84,722     $ 511,357  


The accompanying notes are an integral part of these financial statements


F-6


Table of Contents

ATLAS SAND COMPANY, LLC

NOTES TO THE CONSOLIDATED FINANCIAL STATEMENTS

Note 1—Business and Organization

Atlas Sand Company, LLC, (the “Company”) is a Delaware limited liability company formed on April 20, 2017. The Company is a pure-play, low-cost producer of high-quality, locally sourced 100 mesh and 40/70 raw sand, used as a proppant during the well completion process, necessary to facilitate the recovery of hydrocarbons from oil and natural gas wells, exclusively in the Permian Basin. One hundred percent of the Company’s sand reserves are located in Winkler and Ward Counties, Texas, and operations consist of proppant production and processing facilities, including one facility near Kermit, Texas (“the Kermit facility”) and a second facility near Monahans, Texas (“the Monahans facility”).

The Company sells product and services primarily to oil and natural gas exploration and production companies and oilfield service companies either under supply agreements or through spot sales in the open market. The Company also offers complete mine to wellsite proppant logistics solutions.

The Company is controlled by Atlas Sand Management Company, LLC (“ASMC”). The Company also has several wholly owned subsidiaries, which include Atlas Sand Employee Company, LLC; Atlas OLC Employee Company, LLC; Atlas Construction Employee Company, LLC; Fountainhead Logistics Employee Company, LLC; Atlas Sand Employee Holding Company, LLC; Atlas Sand Construction, LLC; OLC Kermit, LLC; and OLC Monahans, LLC; Fountainhead Logistics, LLC; Atlas Energy Solutions, Inc.; Atlas Sand Holdings, LLC; Atlas Sand Management Company II, LLC; Atlas Sand Holdings II, LLC; Atlas Sand Operating, LLC; and Atlas Sand Merger Sub, LLC. All subsidiaries are included in the consolidated financial statements of the Company.

Note 2—Summary of Significant Accounting Policies

Basis of Presentation

These consolidated financial statements have been prepared in accordance with generally accepted accounting principles in the United States of America (“U.S. GAAP”) and Securities and Exchange Commission (“SEC”) requirements. The consolidated financial statements include the account of the Company and its wholly-owned subsidiaries. All intercompany accounts and transactions have been eliminated in consolidation.

The Company has evaluated events occurring after the balance sheet date as possible subsequent events through February 15, 2023. Any material subsequent events that occurred during this time have been properly recognized or disclosed in the financial statements.

Consolidation

The Financial Statements include the accounts of the Company and wholly owned subsidiaries. All intercompany transactions and accounts have been eliminated in consolidation.

Use of Estimates

The preparation of Consolidated Financial Statements in conformity with U.S. GAAP requires management to make estimates and assumptions that affect the reported amounts of assets and liabilities and the related disclosure of contingent assets and liabilities at the date of the Consolidated Financial Statements and the reported amounts of revenues and expenses during the reporting period. Significant estimates used in the preparation of these financial statements include, but are not limited to: the sand reserves and their impact on calculating the depletion expense under the units-of-production


F-7


Table of Contents

ATLAS SAND COMPANY, LLC

NOTES TO THE CONSOLIDATED FINANCIAL STATEMENTS


method; the depreciation and amortization associated with property, plant and equipment; stock-based compensation; spare parts inventory reserve; collectability of receivables; and certain liabilities. The Company bases its estimates on historical experience and on various assumptions that are believed to be reasonable under the circumstances. Actual results could differ from those estimates.

Cash and cash equivalents

Cash and cash equivalents consist of all highly liquid investments that are readily convertible into cash and have original maturities of three months or less when purchased. The Company places cash deposits with high-credit-quality financial institutions. At times, cash may be uninsured or in deposit accounts that exceed or are not covered under the Federal Deposit Insurance Corporation limit.

Concentrations of Credit Risk

Throughout 2022 and 2021, the Company has maintained cash balances on deposit and time deposits with financial institutions in excess of federally insured amounts; however, all these financial institutions hold an investment-grade rating by one or more major rating agencies.

For the year ended December 31, 2022, one customer comprised 12% of the Company’s sales. For the year ended December 31, 2021, one customer comprised 13% of the Company’s sales. For the year ended December 31, 2020, two customers comprised 29% and 10% of the Company’s sales, respectively.

Accounts Receivable

Accounts receivable are recorded at cost when earned and represent claims against third parties that will be settled in cash. The carrying value of the Company’s receivables, net of allowance for doubtful accounts, represents the estimated collectable amount. If events or changes in circumstances indicate specific receivable balances may be impaired, further consideration is given to the Company’s ability to collect those balances and the allowance is adjusted accordingly. Past-due receivable balances are written off when the Company’s internal collection efforts have been unsuccessful in collecting the amounts due. The Company performs credit evaluations of new customers and sometimes require deposits and prepayments, to mitigate credit risk. When it is probable that all or part of an outstanding balance will not be collected, the Company establishes an allowance for doubtful accounts. The Company recognized $0.1 million of bad debt expense during the year ended December 31, 2021. During the year ended December 31, 2021, the Company determined the bad debt was not collectable and the allowance for doubtful accounts was written off. The Company did not recognize bad debt expense during the years ended December 31, 2022 and 2020. As of December 31, 2022 and 2021, there was no allowance for doubtful accounts.

As of December 31, 2022, two customers represented 19% and 13% of the Company’s outstanding accounts receivable balance. As of December 31, 2021, three customers represented 13%, 11% and 10% of the Company’s outstanding accounts receivable balance.

Accounts Receivable—Related Parties

These amounts represent reimbursement of vendor payments from related parties and outstanding billings with a customer.


F-8


Table of Contents

ATLAS SAND COMPANY, LLC

NOTES TO THE CONSOLIDATED FINANCIAL STATEMENTS


Inventories

Inventories include raw sand stockpiles, in-process product, and finished product available for shipment. Inventories are valued at the lower of cost or net realizable value. Cost is determined using a weighted average cost method. Production costs include direct excavation costs, production personnel and benefits costs, processing costs, rental equipment costs, other costs directly attributable to plant operations, depreciation, and depletion.

Spare Part Inventories

Spare part inventories include critical spares, materials and supplies. Spare part inventories are valued at the lower of cost or net realizable value. Cost is determined using a weighted average cost method. As of December 31, 2022 and 2021, there was $0.7 million and $0.1 million in spare parts inventory reserve, respectively.

Prepaid Expenses and Other Current Assets

Prepaid expenses consist primarily of prepaid software fees, prepaid rent, delay rental payments on leased land, insurance, trade show fees and sales events. These expenses are recognized over the contract period as events occur or when the future benefit is realized. As of December 31, 2022 and 2021, prepaid expenses were $5.2 million and $2.7 million, respectively. Other current assets consist of certain short-term supplier deposits for leased equipment, which were $0.7 million and $1.2 million as of December 31, 2022 and 2021, respectively. During the year ended December 31, 2021, the Company entered into commodity derivative instruments to reduce the effect of price changes on a portion of the Company’s future natural gas usage at the facilities. The commodity derivative instruments are measured at fair value using Level 2 inputs and are included in prepaid expenses and other current assets on the consolidated balance sheets. As of December 31, 2022, the Company did not have any outstanding commodity derivative instruments. As of December 31, 2021, the current derivative asset was $0.2 million. The Company has not designated any of the derivative contracts as fair value or cash flow hedges. Therefore, the Company does not apply hedge accounting to the commodity derivative instruments. Net gains and losses on commodity derivatives instruments are recorded based on the changes in the fair values of the derivative instruments and are included in other income (loss) on the consolidated statements of operations. For the years ended December 31, 2022 and 2021, net gains on commodity derivatives instruments were $1.8 million and $0.1 million, respectively. There was no commodity derivative instrument activity for the year ended December 31, 2020. The Company’s cash flow is only impacted when the actual settlements under the commodity derivative contracts result in making or receiving a payment to or from the counterparty. These settlements under the commodity derivative contracts are reflected as operating activities in the Company’s consolidated statements of cash flows.

Any premiums paid on derivative contracts are capitalized as part of the derivative assets or derivative liabilities, as appropriate, at the time the premiums are paid. Premium payments are reflected in cash flows from operating activities in the Company’s consolidated statements of cash flows. Over time, as the derivative contracts settle, the differences between the cash received and the premiums paid or fair value of contracts acquired are recognized in net gains or losses on commodity derivative contracts, and the cash received is reflected in cash flows from operating activities in the Company’s consolidated statements of cash flows.

The Company’s valuation estimate takes into consideration the counterparties’ credit worthiness, the Company’s credit worthiness, and the time value of money. The consideration of these factors results


F-9


Table of Contents

ATLAS SAND COMPANY, LLC

NOTES TO THE CONSOLIDATED FINANCIAL STATEMENTS


in an estimated exit-price for each derivative asset or liability under a marketplace participant’s view. Management believes that this approach provides a reasonable, non-biased, verifiable, and consistent methodology for valuing commodity derivative instruments.

Property, Plant and Equipment, Including Depreciation and Depletion

Property, plant and equipment are recorded at cost and depreciated over their estimated useful lives using either the straight-line method or the units of production method. Construction in progress is comprised of assets which have not been placed into service and is not depreciated until the related assets or improvements are ready to be placed into service.

Interest incurred during the construction of plant facilities was capitalized. Capitalized interest was recorded within plant facilities associated with productive, depletable properties, until the plant facilities were placed into service, and is being amortized using the units of production method. The Company did not capitalize interest for the years ended December 31, 2022, 2021 and 2020.

Costs of improvements that extend economic life or improve service potential are capitalized and depreciated over the remaining useful life of the asset, with routine repairs and maintenance expensed as incurred.

Fixed assets are carried at historical cost. Fixed assets, other than plant facilities associated with productive, depletable properties, are depreciated using the straight-line method over the estimated useful lives of the assets as follows:


Plant Equipment

     1 - 40 years  

Furniture and office Equipment

     3 - 15 years  

Asset retirement obligation

     50 years  

Computer and network equipment

     3 - 7 years  

Buildings and leasehold improvements

     5 - 40 years  

Logistic Equipment

     4 - 7 years  

Mine development project costs are capitalized once the deposit is classified as a proven and probable reserve. Mine development costs include engineering, mineralogical studies, drilling and other related costs to develop the mine and remove the overburden to initially expose the mineral and allow for the construction of an access way. Exploration costs are expensed as incurred and classified as exploration expense.

Mining property and development costs are amortized using the units of production method on estimated recoverable tonnage, which equals estimated proven and probable reserves. The impact to reserve estimates is recognized on a prospective basis. Drilling and related costs are capitalized for deposits where proven and probable reserves exist. These activities are directed at obtaining additional information on the deposit or converting non-reserve minerals to proven and probable reserves, with the benefit being realized over a period greater than one year.

Impairment or Disposal of Property, Plant and Mine Development

The Company periodically evaluates whether current events or circumstances indicate that the carrying value of our property, plant and equipment assets may not be recoverable. If circumstances indicate that the carrying value may not be recoverable, the Company estimates future undiscounted net cash


F-10


Table of Contents

ATLAS SAND COMPANY, LLC

NOTES TO THE CONSOLIDATED FINANCIAL STATEMENTS


flows using estimates, including but not limited to estimates of proven and probable sand reserves, estimated future sales prices (considering historical and current prices, price trends and related factors), operating costs and anticipated capital expenditures. If the undiscounted cash flows are less than the carrying value of the assets, the Company recognizes an impairment loss equal to the amount by which the carrying value exceeds the fair value of the assets.

The recoverability of the carrying value of the Company’s mining property and development costs are dependent upon the successful development and commercial production of the Company’s mineral deposit and the related processing facilities. The Company’s evaluation of mineral properties for potential impairment primarily includes evaluating changes in the mineral reserves, or the underlying estimates and assumptions, including estimated production costs. Assessing the economic feasibility requires certain estimates including the prices of products to be produced and processing recovery rates, as well as operating and capital costs.

Deferred Offering Costs

Deferred offering costs consist primarily of accounting, legal, and other fees related to our proposed initial public offering (“IPO”). Upon consummation of the proposed IPO, the deferred offering costs will be offset against the proceeds from the offering. In the event the offering is aborted, deferred offering costs will be expensed. As of December 31, 2022 and 2021, the Company capitalized $6.3 million and $0.4 million of deferred offering costs within other long-term assets on the consolidated balance sheets, respectively.

Asset Retirement Obligations

In accordance with ASC 410-20, Asset Retirement Obligations, the Company records a liability for asset retirement obligations at the fair value of the estimated costs to retire a tangible long-lived asset at the time the liability is incurred, when there is a legal obligation to incur costs to retire the asset and when a reasonable estimate of the fair value of the obligation can be made. The Company has asset retirement obligations with respect to certain assets due to various contractual obligations to clean and/or dispose of those assets at the time they are retired.

A liability for the fair value of an asset retirement obligation, with a corresponding increase to the carrying value of related long-lived assets, is recognized at the time of an obligating event. The asset is depreciated using the straight-line method, and the discounted liability is increased through accretion over the expected timing of settlement.

The estimated liability is based on third-party estimates of costs to abandon the mine site, including estimated economic lives and external estimates as to the cost to bring the land to a state required by the lease agreements. The Company utilized a discounted rate reflecting management’s best estimate of the credit-adjusted risk-free rate. Revisions to the liability could occur due to changes in the estimated costs, changes in the mine’s economic life or if federal or state regulators enact new requirements regarding the abandonment of mine sites. Accretion expense, which was $0.1 million for all three years ended December 31, 2022, 2021 and 2020, respectively, is recorded on the consolidated statement of operations in depreciation, depletion and accretion expense.


F-11


Table of Contents

ATLAS SAND COMPANY, LLC

NOTES TO THE CONSOLIDATED FINANCIAL STATEMENTS


Changes in the asset retirement obligations are as follows (in thousands):


     For the Year Ended
December 31,
 
         2022              2021      

Beginning Balance

   $ 1,179      $ 1,116  

Additions to liabilities

     —          —    

Accretion expense

     66        63  


Ending Balance

   $ 1,245      $ 1,179  


Deferred Revenues

The Company occasionally receives prepayments from customers for future deliveries of product. These prepayments represent consideration that is unconditional for which the Company has yet to transfer title to the product. Amounts received from customers in advance of product deliveries are recorded as contract liabilities referred to as deferred revenues and are recognized as revenue upon delivery of the product. The Company did not recognize any deferred revenue on the Company’s consolidated balance sheets as of December 31, 2022. The Company recognized $2.0 million of deferred revenue on the Company’s consolidated balance sheets as of December 31, 2021.

Changes in the deferred revenues balance are as follows (in thousands):


     For the Year Ended
December 31,
 
     2022      2021  

Beginning Balance

   $ 2,000      $ —    

Customer prepayments

     22,302        2,280  

Revenue recognized

     (24,302      (280


Ending Balance

   $ —        $ 2,000  


Deferred Debt Discount and Financing Costs

In connection with entering into the 2018 Term Loan Credit Facility, the Company delivered to the lender warrants for up to 41,299,845 Class D units. The right to purchase Class D units became exercisable upon the funding of each draw under the 2018 Term Loan Credit Facility Agreement. The Company recognized a $32.2 million debt discount associated with the warrants based on the relative fair value of the debt and warrants issued. In connection with the First Amendment to the 2018 Term Loan Credit Facility (the “First Amendment”), the Company delivered to the lender additional warrants for up to 4,192,460 Class D units, which were exercisable upon funding of the draws in proportion to the additional drawings. The Company delivered 2,515,470 Class D units in connection with the First Amendment for the year ended December 31, 2020. Based on the relative fair value of the debt and warrants issued, the Company recognized $2.2 million of debt discount associated with the warrants delivered for the year ended December 31, 2020. The Company did not issue warrants for both the years ended December 31, 2022 and 2021. All warrants delivered have been exercised by the lender. There are no outstanding warrants as of December 31, 2022 and 2021. In connection with entering into the 2021 Term Loan Credit Facility, the Company recognized $1.8 million of debt discount related to fees paid to the lender for the year ended December 31, 2021. The debt discounts are reflected as a direct reduction from the carrying amount of the debt obligation on the Company’s consolidated


F-12


Table of Contents

ATLAS SAND COMPANY, LLC

NOTES TO THE CONSOLIDATED FINANCIAL STATEMENTS


balance sheets. Such costs are amortized to interest expense using the effective interest method. The Company recognized $0.5 million, $7.3 million, and $8.1 million of interest expense associated with the amortization of the debt discounts for the years ended December 31, 2022, 2021 and 2020, respectively.

The Company defers costs directly associated with acquiring third-party debt financing and these costs are amortized using the effective interest method over the life of the associated third-party debt financing. In connection with entering into the 2021 Term Loan Credit Facility and the 2018 Term Loan Credit Facility, the Company incurred $0.8 million and $2.3 million of deferred financing costs, respectively. These deferred financing costs are reflected as a direct deduction from the carrying amount of the related debt obligation on the Company’s consolidated balance sheets.

In 2018, the Company entered into the 2018 ABL Credit Facility and incurred $1.0 million of deferred financing costs. Deferred financing costs, net of amortization, related to the 2018 ABL Credit Facility are included in other long-term assets on the consolidated balance sheets. As of December 31, 2022 and 2021, deferred financing costs, net of amortization, related to the 2018 ABL Credit Facility was $0.2 million and $0.4 million, respectively. Deferred financing costs associated with the 2018 ABL Credit Facility are amortized on a straight-line basis over the life of the agreement and are recorded as interest expense in the consolidated statements of operations.

Interest expense associated with the amortization of deferred financing costs was $0.4 million, $0.7 million, and $0.8 million for the years ended December 31, 2022, 2021 and 2020, respectively.

On October 25, 2021, the Company repaid all borrowings outstanding under the 2018 Term Loan Credit Facility, in connection with entering into a new Term Loan Credit Facility. In connection with the repayment on October 25, 2021, unamortized debt discount of $11.1 million, deferred financing costs of $0.8 million and a make-whole premium of $4.5 million were recognized as a loss on debt extinguishment within interest expense, net, on the Company’s consolidated statements of operations for the year ended December 31, 2021.

Fair Value of Financial Instruments

Fair value is defined as the exchange price that would be received for an asset or paid to transfer a liability (an exit price) in the principal or most advantageous market for the asset or liability in an orderly transaction between market participants on the measurement date. Fair value is estimated by applying the following hierarchy, which prioritizes the inputs used to measure fair value into three levels and bases the categorization within the hierarchy upon the lowest level of input that is available and significant to the fair value measurement:

Level 1—Quoted prices in active markets for identical assets or liabilities.

Level 2—Observable inputs other than quoted prices in active markets for identical assets and liabilities, quoted prices for identical or similar assets or liabilities in inactive markets or other inputs that are observable or can be corroborated by observable market data for substantially the full term of the assets or liabilities.

Level 3—Inputs that are generally unobservable and typically reflect management’s estimate of assumptions that market participants would use in pricing the asset or liability.

The amounts reported in the balance sheets as current assets or liabilities, including cash and cash equivalents, accounts receivable, spare parts inventories, inventories, prepaid expenses and other


F-13


Table of Contents

ATLAS SAND COMPANY, LLC

NOTES TO THE CONSOLIDATED FINANCIAL STATEMENTS


current assets, accounts payable, accrued liabilities and deferred revenues approximate fair value due to the short-term maturities of these instruments. As of the dates indicated, the Company’s long-term debt consisted of the following (in thousands):


    At December 31, 2022     At December 31, 2021     Valuation Technique  
    Carrying Value     Fair Value     Carrying Value     Fair Value  

Financial liabilities:


Outstanding principal amount of the 2021 Term Loan Credit

  $ 147,174     $ 146,837     $ 175,275     $ 177,028       Level 2—Market Approach  

The Company’s 2021 Term Loan Credit Facility bears interest at a fixed rate of 8.47%, where its fair value will fluctuate based on changes in interest rates and credit quality. As of December 31, 2022, the fair value of long-term debt has been determined by discounting the future cash flows using current market interest rates for similar financial instruments. These inputs are not quoted prices in active markets, but they are either directly or indirectly observable; therefore, they are classified as Level 2 inputs. As of December 31, 2021, the Company determined the fair value of the principal amount outstanding under the 2021 Term Loan Credit Facility based on the relative discount received in the 2021 Term Loan Credit Facility agreement executed in October 2021. See Note 7, Debt, for discussion of the 2021 Term Loan Credit Facility agreement. The Company concluded, as the pricing of the 2021 Term Loan Credit Facility was indirectly observable through a recent market transaction, that is classified as Level 2.

The Company entered into commodity derivative instruments accounted for at fair value on a recurring basis. For further discussion on the fair value of commodity derivative instruments see Prepaid Expenses and Other Current Assets discussed within this note.

Leases

The Company leases office space, equipment, and vehicles under non-cancellable agreements. The Company’s leases may include options to extend or renew at the Company’s discretion. The measurement of the lease term includes options to extend or renew when it is reasonably certain the Company will exercise those options. Lease assets and liabilities are recognized at the commencement date based on the present value of minimum lease payments over the lease term. To determine the present value of future minimum lease payments, the Company uses the implicit rate when readily determinable; however, certain leases do not provide an implicit rate. Therefore, to determine the present value of minimum lease payments, the Company use the incremental borrowing rate based on the information available at the commencement date of the lease. The Company’s finance lease agreements typically include an interest rate that is used to determine the present value of future lease payments. Short-term operating leases with an initial term of twelve months or less are not recorded on our balance sheet. Minimum lease payments are expensed on a straight-line basis over the lease term, including reasonably certain renewal options.

The Company periodically evaluate whether current events or circumstances indicate that the carrying value of our right-of-use assets exceeds fair value. If such a review should indicate that the carrying amount of right-of-use asset is not recoverable, the Company will reduce the carrying amount of such assets to fair value.

Environmental Costs and Other Contingencies

The Company recognizes liabilities for environmental and other contingencies when there is an exposure that indicates it is both probable that a liability has been incurred and the amount of loss can be reasonably estimated. Where the most likely outcome of a contingency can be reasonably


F-14


Table of Contents

ATLAS SAND COMPANY, LLC

NOTES TO THE CONSOLIDATED FINANCIAL STATEMENTS


estimated, the Company accrues a liability for that amount. Where the most likely outcome cannot be estimated a range of potential losses is established and, if no one amount in that range is more likely than any other, the amount at the low end of that range is accrued.

The Company records liabilities for environmental contingencies at the undiscounted amounts on the consolidated balance sheets as accrued liabilities and other liabilities when environmental assessments indicate that remediation efforts are probable, and costs can be reasonably estimated. Estimates of the liabilities are based on currently available facts and presently enacted laws and regulations, taking into consideration the likely effects of other societal and economic factors. These estimates are subject to revision in future periods based on actual costs or new circumstances. The Company capitalizes costs that benefit future periods and recognizes a current period charge in operations and maintenance expenses when clean-up efforts do not benefit future periods.

The Company evaluates potential recoveries of amounts from third parties, including insurance coverage, separately from the liability. Recovery is evaluated based on the solvency of the third party, among other factors. When recovery is assured, the Company records and reports an asset separately from the associated liability on the consolidated balance sheets.

Management is not aware of any environmental or other contingencies that would have a material effect on the consolidated financial statements for the years ended December 31, 2022, 2021 and 2020.

Revenues

Under ASC Topic 606-Revenue from Contracts with Customers (“ASC 606”), revenue recognition is based on the transfer of control, or the customer’s ability to benefit from the services and products in an amount that reflects the consideration expected to be received in exchange for those services and products. In recognizing revenue for products and services, the transaction price is determined from sales orders or contracts with customers.

The Company generates revenues from the sale of product that customers purchase for use in the oil and gas industry. Revenues are derived from product sold to customers under supply agreements, whose terms can extend for over one year, and from spot sales through individual purchase orders executed at prevailing market rates. The Company’s revenues are primarily a function of the price per ton realized and the volumes sold. Pricing structures under the supply agreements are, in certain cases, subject to certain contractual adjustments and consist of a combination of negotiated pricing and fixed pricing. These arrangements may undergo periodic negotiations regarding pricing and volume requirements, which may occur in volatile market conditions.

The Company recognizes revenue for product at a point in time following the transfer of control and satisfaction of the performance obligation of such items to the customer, under ASC 606, which typically occurs upon customer pick-up at the facilities. The Company’s standard collection terms are generally 30 days, with certain customer payment terms extending up to 60 days.

Certain of the Company’s contracts contain shortfall provisions that calculate agreed upon fees that are billed when the customer does not meet the minimum purchases over a period of time defined in each contract and when collectability is reasonably certain. As the Company does not have the ability to predict customers’ orders over the period, there are constraints around the ability to recognize the variability in consideration related to this condition. The Company did not recognize shortfall revenue for the years ended December 31, 2022, 2021 and 2020.


F-15


Table of Contents

ATLAS SAND COMPANY, LLC

NOTES TO THE CONSOLIDATED FINANCIAL STATEMENTS


The Company generates service revenue by providing transportation, storage solutions and contract labor services to companies in the oil and gas industry. Transportation services typically consist of transporting product from the plant facilities to the wellsite. The amounts invoiced reflects the transportation services rendered. The amount invoiced for storage solutions and contract labor services reflect the amount of time these services were utilized in the billing period. Transportation, storage solutions and contract labor services are contracted through work orders executed under established pricing terms.

The Company’s contracts for product consist of a single performance obligation as the promise to transfer product is not separately identifiable from other promises within the contract and, therefore, are not distinct. For the portion of the Company’s contracts that contain multiple performance obligations, such as work orders containing a combination of product and services, the Company allocates the transaction price to each performance obligation identified in the contract based on relative stand-alone selling prices, or estimates of such prices, and recognize the related revenue as control of each individual product or service is transferred to the customer, in satisfaction of the corresponding performance obligations.

All of the Company’s revenue is generated from product and service sales in Texas and New Mexico. As such, no further disaggregation of revenue information is provided.

The Company has elected to use the ASC 606 practical expedients, pursuant to which it has excluded disclosures of transaction prices allocated to remaining performance obligations and when it expects to recognize such revenue. The remaining performance obligations are primarily comprised of unfulfilled contracts to deliver product, most of which hold a remaining duration of less than one year, and of which ultimate transaction prices will be allocated entirely to the unfulfilled contracts. The Company’s transaction prices under these contracts may be impacted by market conditions and potential contract negotiations, which have not yet been determined, and are therefore variable in nature.

Unit-Based Compensation

The Company awards incentive units to members of management, consultants and employees as incentive compensation. The Company accounts for these awards under the measurement and recognition provisions of Accounting Standards Codification (“ASC”) 718, Compensation—Stock Compensation. The Company accounts for unit-based compensation by amortizing the fair value of the units, which is determined at the grant date, over the applicable vesting period for each tranche of the award using a graded vesting methodology.

The Company accounts for forfeitures as they occur and reverses any previously recognized unit-based compensation expense for the unvested portion of the awards that were forfeited. The Company did not recognize any forfeitures during the years ended December 31, 2022 and 2021. The Company recognized $0.2 million of forfeitures during the year ended December 31, 2020. Unit-based compensation expense is recognized as selling, general and administrative expense on the Company’s consolidated statements of operations.

Cost of Sales, Excluding Depreciation, Depletion and Accretion Expense

Cost of sales, excluding depreciation, depletion and accretion expense, related to product sales primarily consists of the cost to produce product, including direct and indirect labor, employee housing costs, excavation costs, rental equipment, maintenance expense, utilities, natural gas and royalty expense.


F-16


Table of Contents

ATLAS SAND COMPANY, LLC

NOTES TO THE CONSOLIDATED FINANCIAL STATEMENTS


Cost of sales, excluding depreciation, depletion and accretion expense, related to service sales primarily consists of direct and indirect labor, transportation costs and rental equipment.

Cost of sales, excluding depreciation, depletion and accretion expense, related to product sales and service sales was $130.8 million and $68.1 million for the year ended December 31, 2022, respectively. Cost of sales, excluding depreciation, depletion and accretion expense, related to product sales and service sales was $57.8 million and $26.9 million for the year ended December 31, 2021, respectively. Cost of sales, excluding depreciation, depletion and accretion expense, related to product and service sales were $47.1 million and $26.0 million for the year ended December 31, 2020, respectively.

Selling, General and Administrative Expense

Selling, general and administrative expense primarily consists of non-production personnel wages and benefits, insurance expense, travel and entertainment, advertising expense, professional fees, rent expense for the Company’s corporate office and office supplies, among other expenses to support the business.

Defined Contribution Plans

The Company has defined contribution plans covering substantially all employees who meet certain service and eligibility requirements. The Company’s matching contribution to defined contribution plans was approximately $0.5 million, $0.4 million, and $0.3 million for the years ended December 31, 2022, 2021 and 2020, respectively.

Income Taxes

The Company is a limited liability company. As a limited liability company, the Company has elected to be treated as a partnership for income tax purposes and, therefore, is not subject to federal income tax. The Company’s taxable income or loss, which may differ significantly from taxable income reportable to members as result of differences between the tax basis and financial reporting basis of assets and liabilities and the taxable income allocation requirements under the Company’s current LLC Agreement, is included in the federal income tax returns of each member. Accordingly, there is no provision for federal income taxes in the accompanying consolidated financial statements. However, the Company’s operations located in Texas are subject to an entity-level tax, the Texas margin tax, at a statutory rate of up to 0.75% of income that is apportioned to Texas. Deferred tax assets and liabilities are recognized for future Texas margin tax consequences attributable to differences between the financial statement carrying amount of existing assets and liabilities and their respective Texas margin tax bases. As of December 31, 2022 and 2021, the Company’s net long-term deferred tax liabilities related solely to carrying value differences associated with the Company’s property, plant and equipment.

The Company evaluates the uncertainty in tax positions taken or expected to be taken in the course of preparing the consolidated financial statements to determine whether the tax positions are more likely than not of being sustained by the applicable tax authority. However, the conclusions regarding the evaluation are subject to review and may change based on factors including, but not limited to, ongoing analysis of tax laws, regulations, and interpretations thereof. As of December 31, 2022 and 2021, the Company did not have any liabilities for uncertain tax positions or gross unrecognized tax benefits. The Company’s income tax returns from 2019, 2020 and 2021 are subject to examinations by U.S. federal,


F-17


Table of Contents

ATLAS SAND COMPANY, LLC

NOTES TO THE CONSOLIDATED FINANCIAL STATEMENTS


state or local tax authorities. The IRS closed the examination of Company’s federal tax returns for the taxable year ended December 31, 2018 with no change. The Company cannot predict or provide assurance as to the ultimate outcome of any existing or future examinations.

The Company’s wholly owned corporate subsidiary, Atlas Energy Solutions, Inc. (“AESI”) is subject to income taxes. AESI was formed in February 2022 to facilitate a potential Up-C structure. AESI did not have any operations from formation through December 31, 2022. The corporate subsidiary has a de minimis tax provision as of December 31, 2022.

Segments

The Company operates as one operating segment. Operating segments are defined as components of an enterprise for which separate financial information is evaluated regularly by the chief operating decision maker (“CODM”). The Company’s CODM was collectively its Chairman of the Board, Chief Executive Officer, and President and Chief Financial Officer.

The CODM evaluates the Company’s financial information and performance on a consolidated basis for purposes of making operating decisions and allocating resources. The Company operates with centralized functions and delivers most of its products and services in a similar way to all customers.

Recently Issued Accounting Pronouncements

Rate Reform—In March 2020, the Financial Accounting Standards Board (“FASB”) issued Accounting Standards Update (“ASU”) 2020-04, Reference Rate Reform (Topic 848): Facilitation of the Effects of Reference Rate Reform on Financial Reporting, which provides optional guidance for a limited time to ease the potential burden in accounting for reference rate reform. The new guidance provides optional expedients and exceptions for applying GAAP to contracts, hedging relationships and other transactions affected by reference rate reform if certain criteria are met. The amendments apply only to contracts and hedging relationships that reference LIBOR or another reference rate expected to be discontinued due to reference rate reform. These amendments are effective immediately and may be applied prospectively to contract modifications made and hedging relationships entered into or evaluated on or before December 31, 2022. In December 2022, FASB issued ASU 2022-06, Reference Rate Reform (Topic 848): Deferral of the Sunset Date of Topic 848. ASU 2022-06 amended ASU 2020-04 and deferred the sunset date of Topic 848 from December 31, 2022, to December 31, 2024, after which entities will no longer be permitted to apply the relief in Topic 848. The Company is evaluating the impact of this standard on its consolidated financial statements and does not believe it will have a material impact on the consolidated financial statements.

Financial Instruments—In June 2016, the FASB issued ASU 2016-13, Financial Instruments—Credit Losses (Topic 326), which amends the guidance on the impairment of financial instruments. The standard adds an impairment model, referred to as current expected credit loss, which is based on expected losses rather than incurred losses. The standard applies to most debt instruments, trade receivables, lease receivables, reinsurance receivables, financial guarantees and loan commitments. Under the guidance, companies are required to disclose credit quality indicators disaggregated by year of origination for a five-year period. In May 2019, ASU 2016-13 was subsequently amended by ASU 2019-04, Codification Improvements to Topic 326, Financial InstrumentsCredit Losses, ASU 2019-05, Financial InstrumentsCredit Losses (Topic 326): Targeted Transition Relief. The new guidance is effective for fiscal years beginning after December 15, 2022. The Company is currently


F-18


Table of Contents

ATLAS SAND COMPANY, LLC

NOTES TO THE CONSOLIDATED FINANCIAL STATEMENTS


evaluating the impact of the ASU on the consolidated financial statements and does not believe it will have a material impact on the consolidated financial statements.

Leases—On January 1, 2022, the Company adopted ASU 2016-02, Leases (Topic 842), as amended by other ASUs issued since February 2016, using the modified retrospective transition method applied at the effective date of the standard. By electing this option transition method, information prior to January 1, 2022 has not been restated and continues to be reported under the accounting standards in effect for the period (ASC Topic 840).

The Company elected the package of practical expedients permitted under the transition guidance within the new standard, including the option to carry forward the historical lease classifications and assessment of initial direct costs, account for lease and non-lease components as a single lease, and to not include leases with an initial term of less than 12 months in the lease assets and liabilities.

The adoption of ASC Topic 842 resulted in the recognition of finance lease right-of-use assets, operating lease right-of-use assets, and lease liabilities for finance and operating leases. As of January 1, 2022, the adoption of the new standard resulted in the recognition of finance lease right-of-use assets of $0.7 million, including $0.7 million reclassified from property, plant and equipment, net, and finance lease liabilities of $0.6 million. Additionally, the Company recorded operating lease right-of-use assets of $5.4 million and operating lease liabilities of $7.1 million, including $2.3 million and $4.8 million recorded to other short-term liabilities and other long-term liabilities, respectively as of January 1, 2022. There was no significant impact to the consolidated statements of income, equity or cash flows. Refer to Note 6, Leases, for additional disclosures required under ASC Topic 842.

Note 3—Inventories

Inventories consisted of the following (in thousands):


     For the Year Ended
December 31,
 
     2022      2021  

Raw materials

   $ 290      $ 2  

Work-in-process

     4,825        2,747  

Finished goods

     499        450  


Inventories

   $ 5,614      $ 3,199  


For the years ended December 31, 2022 and 2021, no inventory reserve was deemed necessary.


F-19


Table of Contents

ATLAS SAND COMPANY, LLC

NOTES TO THE CONSOLIDATED FINANCIAL STATEMENTS


Note 4—Property, Plant and Equipment, Net

Property, plant and equipment, net, consisted of the following (in thousands):


     For the Year Ended
December 31,
 
     2022      2021  

Plant facilities associated with productive, depletable properties

   $ 243,613      $ 243,383  

Plant equipment

     251,122        237,845  

Land

     3,009        3,009  

Furniture and office equipment

     1,407        1,230  

Computer and network equipment

     1,648        1,541  

Buildings and leasehold improvements

     25,402        24,763  

Logistic Equipment

     1,591        —    

Construction in progress

     111,711        18,524  


Property, plant and equipment

     639,503        530,295  

Less: Accumulated depreciation and depletion

     (97,979      (71,978


Property, plant and equipment, net

   $ 541,524      $ 458,317  


Depreciation and depletion expense recognized in depreciation, depletion and accretion expense was $22.1 million and $5.4 million for the year ended December 31, 2022, respectively, as compared to $19.4 million and $4.2 million for the year ended December 31, 2021, respectively, and as compared to $17.5 million and $3.2 million for the year ended December 31, 2020, respectively. Depreciation expense recognized in selling, general and administrative expense was $1.1 million, $1.0 million, and $0.8 million for the years ended December 31, 2022, 2021 and 2020, respectively. The Company recognized $1.3 million of impairment of long-lived assets related to certain power generation assets where the vendor was unable to meet its obligations for the year ended December 31, 2020. The Company pursued legal remedy and determined the assets were not recoverable. The Company recognized $0.1 million of loss on disposal of fixed assets for the year ended December 31, 2020. The Company did not recognize impairment of long-lived assets or loss on disposal of assets for the years ended December 31, 2022 and 2021.

For the year ending December 31, 2021, the Company had capital leases that are reported as part of plant equipment. The amortization of capital leases is included in depreciation, depletion and accretion expense on the consolidated statements of operations. As of December 31, 2021, the Company had capital leases with a cost of $1.5 million and accumulated depreciation of $0.9 million. The Company recognized $0.4 million and $0.3 million of depreciation expense associated with capital leases for the year ended December 31, 2021 and 2020, respectively. On January 1, 2022, the Company adopted ASU Topic 842. Refer to Note 6, Leases, for additional disclosures required under ASC Topic 842.


F-20


Table of Contents

ATLAS SAND COMPANY, LLC

NOTES TO THE CONSOLIDATED FINANCIAL STATEMENTS


Note 5—Accrued Liabilities

Accrued liabilities consisted of the following (in thousands):


     For the Year Ended
December 31,
 
     2022      2021  

Accrued capital expenditures

   $ 10,536      $ 1,411  

Accrued personnel costs

     1,485        787  

Accrued production costs

     4,586        1,652  

Accrued royalties

     6,529        1,129  

Professional services

     1,263        592  

Sales and use tax payable

     2,144        1,099  

Other

     4,087        2,483  


Total accrued liabilities

   $ 30,630      $ 9,153  


Note 6—Leases

The Company has operating and finance leases primarily for office space, equipment, and vehicles. The terms and conditions for these leases vary by the type of underlying asset.

Certain leases include variable lease payments for items such as property taxes, insurance, maintenance, and other operating expenses associated with leased assets. Payments that vary based on an index or rate are included in the measurement of lease assets and liabilities at the rate as of the commencement date. All other variable lease payments are excluded from the measurement of lease assets and liabilities, and are recognized in the period in which the obligation for those payments is incurred.

The components of lease expense for the year ended December 31, 2022 are as follows (in thousands):


     Year Ended
December 31, 2022
 

Finance lease cost:


Amortization of right-of-use assets

   $ 2,027  

Interest on lease liabilities

     666  

Operating lease cost

     1,085  

Variable lease cost

     706  

Short-term lease cost

     12,576  


Total lease cost

   $ 17,060  


F-21


Table of Contents

ATLAS SAND COMPANY, LLC

NOTES TO THE CONSOLIDATED FINANCIAL STATEMENTS


Supplemental cash flow and other information related to leases for the year ended December 31, 2022 are as follows (in thousands):


     Year Ended
December 31, 2022
 

Cash paid for amounts included in the measurement of lease liabilities:


Operating cash outflows from operating leases

   $ 1,305  

Operating cash outflows from finance leases

   $ 666  

Financing cash outflows from finance leases

   $ 1,010  

Right-of-use assets obtained in exchange for new lease liabilities:


Operating leases

   $ 6,245  

Finance leases

   $ 21,201  

During the year ended December 31, 2022, the Company modified an agreement which related to certain operating right-of-use assets of $1.3 million and liabilities of $1.3 million, the change in terms increased the amount, extended the term, and resulted in finance lease classification. In connection with this modification, the Company recognized finance lease right-of-use assets of $3.2 million and liabilities of $3.2 million. There was no gain or loss recognized as a result of these amendments. Lease terms and discount rates as of December 31, 2022 are as follows (in thousands):


     Year Ended
December 31, 2022
 

Weighted-average remaining lease term:


Operating leases

     4.5 years  

Finance leases

     5.3 years  

Weighted-average discount rate:


Operating leases

     4.3

Finance leases

     9.4

Future minimum lease commitments as of December 31, 2022 are as follows (in thousands):


     Finance      Operating  

2023

   $ 4,976      $ 1,291  

2024

     5,051        1,312  

2025

     4,964        1,342  

2026

     4,964        1,281  

2027

     2,876        681  

Thereafter

     3,015        —    


Total lease payments

     25,846        5,907  

Less imputed interest

     (5,691      (538


Total

   $ 20,155      $ 5,369  


F-22


Table of Contents

ATLAS SAND COMPANY, LLC

NOTES TO THE CONSOLIDATED FINANCIAL STATEMENTS


Supplemental balance sheet information related to the Company’s leases as of December 31, 2022 was as follows (in thousands):


Classification

   December 31, 2022  

Operating Leases


Current operating lease liabilities

   Other current liabilities    $ 1,082  

Noncurrent operating lease liabilities

   Other long-term liabilities    $ 4,287  

Finance Leases


Current finance lease liabilities

   Other current liabilities    $ 3,213  

Noncurrent finance lease liabilities

   Other long-term liabilities    $ 16,942  

For the year ending December 31, 2021, the Company had the current portion of capital leases included in other current liabilities on the consolidated balance sheets and the long-term portion of capital leases included in other long-term liabilities on the consolidated balance sheets. As of December 31, 2021, the current portion of capital leases and long-term portion of capital leases was $0.3 million and $0.3 million, respectively.

On May 16, 2022, Atlas entered into a master lease agreement with Stonebriar Commercial Finance (“Stonebriar”) for the right, but not the obligation, to fund up to $70.0 million of purchases of transportation and logistics equipment. The interim financing for down payments on any purchased equipment is based on one-month SOFR, plus 8.0%. The final interest rate will be set upon acceptance of the equipment based on the terms of the agreement. As of December 31, 2022, Stonebriar has funded $16.8 million of lease commitments under this agreement.

On July 28, 2022, Atlas entered into a master lease agreement with Stonebriar for the right, but not the obligation, to fund up to $10.0 million of purchases of dredges and related equipment. The interim financing for down payments on any purchased equipment is based on one-month SOFR, plus 8.0%. The final interest rate will be set upon acceptance of the equipment based on the terms of the agreement. As of December 31, 2022, Stonebriar has funded $6.4 million of lease commitments under this agreement.

As of December 31, 2022, the Company had additional lease commitments that have not yet commenced totaling $6.0 million and therefore are not reflected on the consolidated balance sheet and tables above. These leases include agreements for transportation, logistics equipment and dredge equipment. These leases will commence between fiscal year 2022 and fiscal year 2023 with lease terms of 4 to 7 years. Certain transportation and logistics leases discussed here are a component of the purchase commitments discussed in Note 8, Commitments and Contingencies.


F-23


Table of Contents

ATLAS SAND COMPANY, LLC

NOTES TO THE CONSOLIDATED FINANCIAL STATEMENTS


Note 7—Debt

Debt consists of the following (in thousands):


     For the Year Ended
December 31,
 
     2022      2021  

Term Loan Credit Facility

   $ 148,995      $ 177,539  

Less: Debt discount, net of accumulated amortization of $546 and $89, respectively

     (1,254      (1,711

Less: Deferred financing fees, net of accumulated amortization of $248 and $29 respectively

     (567      (553

Less: Current portion (a)

     (20,586      (15,563


Long-term debt

   $ 126,588      $ 159,712  


(a)

The current portion of long-term debt reflects payments based on the terms of the 2021 Term Loan Credit Facility.

2021 Term Loan Credit Facility

On October 20, 2021, the Company entered into a $180 million, aggregate principal amount, term loan credit facility (“2021 Term Loan Credit Facility”) which bears an interest rate of 8.47% per annum on borrowings outstanding under the facility with Stonebriar Commercial Finance, LLC (the “Term Lender”) and has a maturity date of October 1, 2027. The 2021 Term Loan Credit Facility is guaranteed on a secured basis and interest, plus principal, is payable in seventy-two consecutive monthly installments.

At any time prior to the October 1, 2027, maturity date, the Company may redeem the 2021 Term Loan Credit Facility, in whole or in part, at a price equal to 100% of the principal amount plus a prepayment fee. The prepayment fee ranges from 3% on or before October 20, 2022, to 2% after October 20, 2022, and on or before October 20, 2023, and 1% thereafter. Upon maturity of the 2021 Term Loan Credit Facility, the entire unpaid principal amount, together with interest, fees and other amounts payable in connection with the facility, is immediately due and payable without further notice or demand.

The 2021 Term Loan Credit Facility includes certain non-financial covenants, including but not limited to restrictions on incurring additional debt and certain restricted payments. The 2021 Term Loan Credit Facility is not subject to financial covenants unless greater than $5.0 million or more in aggregate is outstanding under the Company’s ABL Credit Agreement and for which a minimum average liquidity balance of $20.0 million must be maintained. The 2021 Term Loan Credit Facility requires certain debt prepayment, not subject to a prepayment penalty fee, concurrent with a Company equity distribution. The Company is required to make a prepayment in an amount equal to one-third or one-fourth of the total equity distribution, based on a pro forma leverage ratio as defined in the 2021 Term Loan Credit Agreement. In May 2022, August 2022, and October 2022, the Company paid $15.0 million, $15.0 million, and $15.0 million of equity distributions, respectively, and concurrently paid $5.0 million, $3.8 million and $3.8 million of the 2021 Term Loan Credit Facility as required by the terms described above, respectively. In January 2023, the Company paid a $15.0 million equity distribution and concurrently paid $3.8 million of the 2021 Term Loan Credit Facility as required by the terms described above.


F-24


Table of Contents

ATLAS SAND COMPANY, LLC

NOTES TO THE CONSOLIDATED FINANCIAL STATEMENTS


Proceeds from the 2021 Term Loan Credit Facility were used exclusively for general corporate purposes, which included the repayment of outstanding indebtedness under the 2018 Term Loan Credit Facility, and to make permitted distributions. As of December 31, 2022 and 2021, the Company was in compliance with the covenants of the 2021 Term Loan Credit Facility.

2018 Asset-Based Loan Credit Facility

On December 14, 2018, the Company closed on the Asset-Based Loan Credit Facility (“2018 ABL Credit Facility”) that provides revolving credit financing with a borrowing capacity of up to $50.0 million. The 2018 ABL Credit Facility is unconditionally guaranteed, jointly and severally, by the Company and its subsidiaries. The 2018 ABL Credit Facility will mature on the stated maturity date, December 14, 2023. As of December 31, 2022 and 2021, the Company had no outstanding borrowings under the 2018 ABL Credit Facility.

The 2018 ABL Credit Facility includes a letter of credit sub-facility, which permits issuances of letters of credit up to an aggregate amount of $10.0 million. As of December 31, 2022 and 2021, the Company had $1.1 million and $0.6 million of outstanding letters of credit under the 2018 ABL Credit Facility, respectively.

The Company may also request swingline loans under the agreement in an aggregate principal amount not to exceed $7.5 million. During the years ended December 31, 2022 and 2021, the Company had no outstanding swingline loans under the 2018 ABL Credit Facility.

Obligations under the 2018 ABL Credit Facility were secured by a first-priority lien on substantially all assets of the Company, until September 9, 2019, when the lenders and the Company entered into the split collateral intercreditor agreement, at which time the 2018 ABL Credit Facility became secured by a first-priority lien on inventory and accounts receivable held by the Company and its subsidiaries, and a second-priority lien on the remaining assets of the Company.

Initially, the borrowing base was set at $35.0 million for the period beginning on December 14, 2018 and ending on April 1, 2019. Thereafter, the amount of available credit changes every month, depending on the amount of eligible accounts receivable and inventory the Company has available to serve as collateral. For the period beginning on April 1, 2019, and ending on June 30, 2019, the facility was limited to the lesser of (a) 85% to 90% of the eligible accounts receivable and (b) 75% of the market value of the eligible inventory. Thereafter, the facility is limited to the lesser of (i) the aggregate commitment and (ii) the sum of (a) 85% to 90% of the eligible accounts receivable and (b) lesser of 70% of the cost of the eligible inventory and 85% of the orderly liquidation value of the eligible inventory. The borrowing base components are subject to customary reserves and eligibility criteria. As of December 31, 2022, availability was $48.9 million.

Borrowings under the 2018 ABL Credit Facility bear interest, at the Company’s option, at either a base rate or London Interbank Offered Rate (“LIBOR”), as applicable, plus an applicable margin that ranges based on average excess availability. LIBOR loans bear interest at the LIBOR plus an applicable margin, which ranges from 1.50% to 2.00%. Base rate loans bear interest at the applicable base rate, plus an applicable margin, which ranges from 0.50% to 2.00%. In addition to paying interest on outstanding principal under the 2018 ABL Credit Facility, the Company is required to pay a commitment fee of 0.375% per annum with respect to the unutilized commitment under the 2018 ABL Credit Facility, based on the average utilization of the 2018 ABL Credit Facility. The Company is also required to pay customary letter of credit fees, to the extent that one or more letter of credit is


F-25


Table of Contents

ATLAS SAND COMPANY, LLC

NOTES TO THE CONSOLIDATED FINANCIAL STATEMENTS


outstanding. There were no outstanding borrowings under the 2018 ABL Credit Facility as of December 31, 2022. The Company recognized $0.2 million, $0.2 million, and $0.3 million of interest expense, unutilized commitment fees and other fees under the 2018 ABL Credit Facility, classified as interest expense, for the years ended December 31, 2022, 2021 and 2020, respectively.

The 2018 ABL Credit Facility requires that if the excess availability, as defined, is less than the greater of (i) 12.50% of the maximum credit and (ii) $5.0 million, the Company shall comply with a minimum fixed charge coverage ratio of at least 1.00 to 1.00, for covenant trigger periods beginning after March 14, 2019. In addition, the 2018 ABL Credit Facility contains negative covenants that restrict the Company from, among other things, incurring additional debt, granting liens, entering into guarantees, entering into certain mergers, making certain loans and investments, entering into swap agreements, disposing of assets, prepaying certain debt, declaring dividends, accounting changes, transactions with affiliates, modifying certain material agreements or organizational documents relating to, or changing the business it conducts.

The 2018 ABL Credit Facility contains certain customary representations and warranties, affirmative covenants, and events of default, including, among other things, payment defaults, breach of representations and warranties, covenant defaults, cross-defaults and cross-acceleration to certain indebtedness, certain events of bankruptcy, certain events of abandonment, certain events under the Employee Retirement Income Security Act of 1974 as amended from time to time, material judgments, actual or asserted failure of any guaranty or security document supporting the 2018 ABL Credit Facility to be in full force and effect and change of control. If such an event of default occurs, the lenders under the 2018 ABL Credit Facility would be entitled to take various actions, including the acceleration of amounts due under the 2018 ABL Credit Facility and all actions permitted to be taken by a secured creditor. As of December 31, 2022, the Company was in compliance with the covenants of the 2018 ABL Credit Facility.

Limited Waiver and First Amendment to the 2018 ABL Credit Facility

On June 4, 2019, the Company and the lenders agreed to amended certain terms of the 2018 ABL Credit Facility to extend the due date for taking certain actions with regard to two wholly owned subsidiaries of the Company, OLC Kermit, LLC and OLC Monahans, LLC, and to allow the making of limited investments into those subsidiaries. In addition, the lender agreed to waive any defaults or events of default that may have resulted from the Company’s acquisition of the two subsidiaries. The Limited Waiver and First Amendment was extended on August 31, 2019, on December 31, 2019, and on June 30, 2020.

Second Amendment to the 2018 ABL Credit Facility

On October 22, 2019, the Company and the lenders agreed to amend certain terms of the 2018 ABL Credit Facility to allow the Company to enter into insurance premium financing arrangements in the ordinary course of business.

Third Amendment to the 2018 ABL Credit Facility

On April 13, 2020, the Company and the lenders agreed to amend certain terms of the 2018 ABL Credit Facility that, in the event the Qualified SBA Loan is not forgiven, or fails to qualify for forgiveness, in accordance with the terms of the CARES ACT, allows the Company to establish reserves up to the amount of the Qualified Small Business Administration Loan that is not forgiven or fails to qualify for forgiveness.


F-26


Table of Contents

ATLAS SAND COMPANY, LLC

NOTES TO THE CONSOLIDATED FINANCIAL STATEMENTS


Fourth Amendment to the 2018 ABL Credit Facility

On March 23, 2021, the Company and the lenders agreed to amend certain terms of the 2018 ABL Credit Facility, including expanding the list of assets available for the calculation of available credit. Subsequent to the execution of the Fourth Amendment to the 2018 ABL Credit Facility (“Fourth Amendment”), the facility is limited to the lessor of (i) the aggregate commitment and (ii) the sum of (a) 90% of the book value of eligible accounts receivable, (b) lesser of 100% Pledged Cash, defined on any date, as the aggregate amount of unrestricted cash on deposit in the cash collateral account, and $25.0 million, and (c) the lesser of 70% of the cost of eligible inventory and 85% of the net orderly liquidation value of the eligible inventory. The Company is required to keep cash on deposit in the cash collateral account only to the extent any outstanding borrowings under the 2018 ABL Credit Facility exceed the portion of the borrowing base represented by accounts receivable and inventory. The borrowing base components are subject to customary reserves and eligibility criteria. Additionally, the Fourth Amendment contains provisions addressing the potential transition from LIBOR to a secured overnight financing rate (“SOFR”), in the event the administrator has ceased or will cease publication of LIBOR.

Fifth Amendment to the 2018 ABL Credit Facility

On October 20, 2021, the Company and the lender agreed to amend certain terms of the 2018 ABL Credit Facility, to, among other things, allow the Company to enter into the 2021 Term Loan Credit Facility with Stonebriar Commercial Finance (the “2021 Term Loan Credit Facility”), to repay all borrowings outstanding under the 2018 Term Loan Credit Facility and to conform certain covenants under the 2018 ABL Credit Facility to the 2021 Term Loan Credit Facility.

2018 Term Loan Credit Facility

On January 30, 2018, the Company closed on the 2018 Term Loan Credit Facility that provided debt financing in an aggregate principal amount of $150.0 million, which was funded in a series of tranches during 2018. The Company refers to these borrowings, collectively, as the “2018 Term Loan Credit Facility.” In connection with the 2018 Term Loan Credit Facility, the Company delivered to the lender warrants for up to 41,299,845 Class D units. See Note 9, Equity, for further discussion.

Obligations under the 2018 Term Loan Credit Facility were secured by a second-priority lien on substantially all assets of the Company, until September 9, 2019, when the lenders and the Company entered into the split collateral intercreditor agreement, at which time the 2018 Term Loan Credit Facility became secured by a second-priority lien on inventory and accounts receivable held by the Company and its subsidiaries, and a first-priority lien on the remaining assets of the Company. In addition, the Company’s subsidiaries had guaranteed the Company’s obligations under the 2018 Term Loan Credit Facility and had granted to the lender security interests in substantially all respective assets.

Borrowings under the 2018 Term Loan Credit Facility bore interest equal to the lesser of (1) the applicable interest rate, which was set at either 10% or 13% per annum, based upon the Company’s consolidated leverage ratio or (2) the highest lawful rate, as defined in the 2018 Term Loan Credit Facility agreement. The Company, at its option, could pay up to 50% of any interest payment in-kind. The interest rate for the 2018 Term Loan Credit Facility was 13% during the year ended December 31, 2021. The Company recognized interest expense associated with the 2018 Term Loan Credit Facility of $18.9 million and $23.6 million for the years ended December 31, 2021 and 2020.


F-27


Table of Contents

ATLAS SAND COMPANY, LLC

NOTES TO THE CONSOLIDATED FINANCIAL STATEMENTS


The 2018 Term Loan Credit Facility would have matured on January 30, 2023, and, for certain loans, would amortize in quarterly installments equal to 1.00% of the aggregate outstanding principal balance as of each quarterly payment date beginning with the initial payment, which was made for the year ended December 31, 2018. Beginning on March 31, 2021, the quarterly principal payments increased to 5.00% of the aggregate outstanding principal balance, with the balance payable on the final maturity date, subject to the amend and extend provisions applicable under the agreement.

The Company had the option to voluntarily prepay the outstanding 2018 Term Loan Credit Facility along with all interest then accrued and unpaid, in whole or in part, and the applicable premium payment based upon either (a) the present value using a discount rate based upon a U.S. Treasury rate plus 50 basis points of the amount of interest that would have been payable on the principal balance prepaid if prior to January 30, 2020, (b) 7% of the principal balance prepaid, thereafter and prior to January 30, 2021, (c) 3% of the principal balance prepaid, anytime thereafter, or (d) 1% of the principal balance if prepaid upon the occurrence of an Initial Public Offering (“IPO”) event.

The 2018 Term Loan Credit Facility contained customary representations and warranties and customary affirmative and negative covenants, including limits or restrictions on the Company’s ability to incur liens, incur indebtedness, make certain restricted payments, merge or consolidate and dispose of assets. In addition, it contained customary events of default that entitled the lenders to cause any or all of the Company’s indebtedness under the 2018 Term Loan Credit Facility to become immediately due and payable. The events of default (some of which were subject to applicable grace or cure periods) included, among other things, nonpayment defaults, covenant defaults, cross-defaults to other material indebtedness, bankruptcy and insolvency defaults and material judgment defaults.

First Amendment to the 2018 Term Loan Credit Facility

On April 3, 2019, the Company amended certain terms of the 2018 Term Loan Credit Facility, which allowed for borrowings of an additional $25.0 million, primarily to fund capital improvement projects. In addition, language related to payment terms for certain 2018 Term Loan Credit Facility was amended so that all aggregate outstanding principal related to the 2018 Term Loan Credit Facility, other than the paid-in-kind loans, is paid according to the terms noted above.

In connection with the First Amendment to the 2018 Term Loan Credit Facility above on April 3, 2019, additional warrants were delivered for up to 4,192,460 Class D units, which were exercisable upon funding of the draws in proportion to the additional $25.0 million in borrowings, see Note 9, Equity, for further discussion.

On June 20, 2019, the Company borrowed $5.0 million of the additional $25.0 million under the 2018 Term Loan Credit Facility. On June 28, 2019, the Company borrowed another $5.0 million of the additional $25.0 million under the 2018 Term Loan Credit Facility. On April 24, 2020 and July 7, 2020, the Company borrowed $12.2 and $2.3 million of the additional $25.0 million under the 2018 Term Loan Credit Facility, respectively.

Limited Waiver and Second Amendment to the 2018 Term Loan Credit Facility

On June 4, 2019, the Company and the lender agreed to amended certain terms of the 2018 Term Loan Credit Facility to extend the due date for taking certain actions with regard to two wholly owned subsidiaries of the Company, OLC Kermit, LLC and OLC Monahans, LLC, and to allow the making of limited investments into those subsidiaries. In addition, the lender agreed to waive any defaults or


F-28


Table of Contents

ATLAS SAND COMPANY, LLC

NOTES TO THE CONSOLIDATED FINANCIAL STATEMENTS


events of default that may have resulted from the Company’s acquisition of the two subsidiaries. The Limited Waiver and Second Amendment was extended on August 31, 2019, on December 31, 2019, on June 30, 2020, and on August 29, 2020.

Third Amendment to the 2018 Term Loan Credit Facility

On October 22, 2019, the Company and the lender agreed to amend certain terms of the 2018 Term Loan Credit Facility to allow the Company to enter into insurance premium financing arrangements in the ordinary course of business.

Fourth Amendment to the 2018 Term Loan Credit Facility

On April 13, 2020, the Company and the lender agreed to amend certain terms of the 2018 Term Loan Credit Facility to allow the Company to receive the Qualified Small Business Administration Loan in an amount not to exceed $10.0 million.

Extinguishment of the 2018 Term Loan Credit Facility

On October 25, 2021, the Company repaid all borrowings outstanding under the 2018 Term Loan Credit Facility, in connection with entering into a new 2021 Term Loan Credit Facility with Stonebriar Commercial Finance. The Company paid a total of $171.0 million, which included principal of $143.1 million, paid-in-kind borrowings of $22.2 million, make-whole premium of $4.5 million, and $1.2 million of accrued interest. In connection with the repayment on October 25, 2021, unamortized debt discount and deferred financing costs of $11.9 million and a make-whole premium of $4.5 million were recognized as a loss on debt extinguishment within interest expense, net, on the consolidated statements of operations for the year ended December 31, 2021.

Debt Obligations

The following table sets forth future principal payment obligations as of December 31, 2022, based on the terms of the Term Loan Credit Facility (in thousands).


2023

   $ 20,586  

2024

     35,457  

2025

     38,611  

2026

     42,012  

2027

     12,329  


Total

   $ 148,995  


Note 8—Commitments and Contingencies

Royalty Agreements

The Company has entered into a royalty agreement associated with its leased properties with a related party, under which it is committed to pay royalties on product sold from its production facilities for which the Company has received payment from the end customer. Royalty expense is recorded as the product is sold, is included in costs of sales, and totaled between 10% and 15% of cost of sales for the year ended December 31, 2022, and less than 10% of cost of sales for the years ended December 31, 2021 and 2020, respectively.


F-29


Table of Contents

ATLAS SAND COMPANY, LLC

NOTES TO THE CONSOLIDATED FINANCIAL STATEMENTS


Standby Letters of Credit

As of December 31, 2022 and 2021, the Company had outstanding standby letters of credit issued under the 2018 ABL Credit Facility of $1.1 million and $0.6 million, respectively.

Lease Obligations

As of December 31, 2022, the Company’s estimated future minimum lease payments under long-term operating and finance lease agreements are associated with the Company’s adoption of ASC 842 and relate to lease payment maturities. The Company’s leases include office space, equipment and vehicles. See Note 6, Leases, for additional disclosure on the Company’s estimated future minimum lease payments.

Purchase Commitments

On March 23, 2022, the Company entered into an agreement to purchase transportation and logistics equipment in the amount of $5.2 million and $26.2 million in 2022 and 2023, respectively, subject to customary terms and conditions. On April 20, 2022, the Company entered into an agreement to purchase transportation and logistics equipment in the amount of $8.5 million and $11.9 million in 2022 and 2023, respectively, subject to customary terms and conditions.

Litigation

The Company is involved in various legal and administrative proceedings that arise from time to time in the ordinary course of doing business. Some of these proceedings may result in fines, penalties or judgments being assessed against the Company, which may adversely affect financial results. In addition, from time to time, the Company is involved in various disputes, which may or may not be settled prior to legal proceedings being instituted and which may result in losses in excess of accrued liabilities, if any, relating to such unresolved disputes. Expenses related to litigation reduce operating income. The Company does not believe that the outcome of any of these proceedings or disputes would have a significant adverse effect on the financial position, long-term results of operations or cash flows. It is possible, however, that charges related to these matters could be significant to results of operations or cash flows in any single accounting period. Management is not aware of any legal, environmental or other commitments and contingencies that would have a material effect on the consolidated financial statements.

Note 9—Equity

The Company has authority to issue an unlimited number of units under its current capital structure and the ability to issue additional units of different classes or series. The outstanding units are designated as Class A units, Class C units, Class D units and Class P units. Additional units, of the same or different classes or series, having the same or different rights, powers and duties as preexisting units may be created and issued. All Class A, Class C, Class D and Class P unitholders as of December 31, 2022 and 2021, are deemed to be members of the Company (“Members”).

On January 30, 2018, the Company executed the Third Amended and Restated Limited Liability Company Agreement of Atlas Sand Company, LLC (“LLC Agreement”) to create Class D units as a class of unit that the Company is authorized to issue. This amendment was executed in connection with the issuance of the 2018 Term Loan Credit Facility. The Company delivered to the lender warrants


F-30


Table of Contents

ATLAS SAND COMPANY, LLC

NOTES TO THE CONSOLIDATED FINANCIAL STATEMENTS


for up to 41,299,845 Class D units, with an exercise price of $0.01 per warrant unit, that became exercisable upon the funding of each draw under the 2018 Term Loan Credit Facility. During the year ended December 31, 2018, the lender exercised all 41,299,845 Class D warrants.

On April 3, 2019, the Company amended certain terms of the 2018 Term Loan Credit Facility. In connection with the First Amendment, the Company delivered to the lender additional warrants for up to 4,192,460 Class D units, which were exercisable upon funding of the draws in proportion to the additional drawings. During the year ended December 31, 2020, the Company delivered and the lender immediately exercised the remaining 2,515,470 Class D warrants associated with the First Amendment. There were no warrants outstanding as of December 31, 2022 and 2021.

Each Member of the Company is entitled to one vote for each Class A, Class C and Class D unit owned by such Member. Class P units are issued in connection with the Company’s long-term incentive plan and have no voting rights.

The Company’s LLC Agreement contains provisions for the allocation of net income and loss to the Class A and Class D units. For purposes of maintaining Member capital accounts, the LLC Agreement specifies that net income or net loss shall be allocated proportionally among Members in accordance with their respective percentage ownership interest.

In accordance with the Company’s LLC Agreement, all Class C units shall automatically convert to Class A units immediately prior to the closing of a Capital Event, as defined in the Company’s LLC Agreement, which, in general, includes a public offering or sale of the Company’s assets or equity. Additionally, the holders of Class C units may elect, at any time prior to the approval of a Capital Event, to convert all Class C units into newly issued Class A units by providing notice to the Company.

The Company’s LLC Agreement sets forth the calculation to be used to determine the amount of cash distributions that the unitholders will receive.

In December 2021, May 2022, August 2022, and October 2022, the Company paid a cash distribution to Class A and Class D unitholders in the aggregate amount of $10.0 million, $15.0 million, $15.0 million, and $15.0 million, respectively, based on the Company’s LLC Agreement calculation. In January 2023, the Company paid additional cash distributions to Class A and Class D unitholders of $15.0 million based on the Company’s LLC Agreement calculation. Class C units do not participate in cash distributions, based on the terms of the Company’s LLC Agreement.

Upon admittance as Members of the Company, the Class C unitholders were initially granted an option that entitles them to acquire a percentage of the units of the Company that are offered in conjunction with additional capital contribution events, as defined by the Company’s LLC Agreement, which generally includes instances where additional units are issued by the Company. The option is not unconditional and can only be exercised upon the occurrence of certain capital events. The consideration for the exercise of the option is based on the percentage ownership of the Class C unitholders at the date of the capital event and the total capital to be contributed in connection with such capital event.

In October 2021, pursuant to the Company’s LLC Agreement, the Company delivered a Funding Notice to the Atlas Sand Company, LLC unitholders (other than ASMC, which is the majority unitholder and had already made Additional Capital Contributions related to such Funding Notice), by which the Company offered each unitholder the right, but not the obligation, to make Additional Capital


F-31


Table of Contents

ATLAS SAND COMPANY, LLC

NOTES TO THE CONSOLIDATED FINANCIAL STATEMENTS


Contributions to the Company. In addition, the Company delivered a notice to the Class C unitholders pursuant to their option giving them the right to make additional capital contributions, which they exercised. The offering closed on December 1, 2021 and resulted in Additional Capital Contributions of $12.6 million for the year ended December 31, 2021.

Note 10—Unit-Based Compensation

The Company recognizes unit-based compensation expense for awards granted under two long-term incentive plans, the Atlas Sand Management Company, LLC Long-Term Incentive Plan (the “ASMC Plan”) and the Atlas Sand Company, LLC Long-Term Incentive Plan (the “ASCo Plan”). The ASMC Plan was adopted on September 15, 2017, by ASMC for officers, employees, directors, managers and consultants of the Company (the “ASMC Participants”). The ASCo Plan was adopted by the Company on December 15, 2017, for officers, employees, directors, managers, consultants or other advisors of the Company (the “ASCo Participants”).

The Company has applied the guidance of FASB Interpretation 44, which establishes an accounting model where equity awards granted by a parent company to employees of a subsidiary are recognized in the financial statements of the subsidiary. During the years ended December 31, 2022, 2021 and 2020, the Company recognized $0.2 million, de minimis, and $0.9 million of unit-based compensation expense in its consolidated statements of operations related to awards in the ASMC Plan, respectively.

On May 28, 2018, the Company adopted the Amended and Restated Long-Term Incentive Plan that reduced the authorized available awards to be issued under the ASCo Plan from 149,425 to 100,000. The ASCo Plan consists of equity grants of Class P units made to ASCo Participants at the discretion of the plan administrator. Pursuant to the terms of the ASCo Plan, to the extent that an award is canceled, any and all Class P units that are canceled and repurchased will be available again for new awards under the ASCo Plan.

The vesting schedule for each grant under the plans shall be determined by the respective plans’ administrator.

A summary of ASCo’s Class P unit activity is as follows (in thousands):


ASCo Plan Class P unit activity

   Number of Class
P Units
     Weighted Average
Grant Date Fair
Value
 

Non-vested at December 31, 2020

     2,500      $ 151.57  

Granted

     2,500        —    

Vested

     (2,167    $ 151.57  

Forfeited

     —          —    


Non-vested at December 31, 2021

     2,833      $ 151.57  


Granted

     2,200      $ 151.57  

Vested

     (1,500    $ 151.57  

Forfeited

     —          —    


Non-vested at December 31, 2022

     3,533      $ 151.57  


The Company accounts for each tranche of the unit awards as compensatory awards in accordance with FASB ASC 718, and as such, compensation expense is recognized over the service condition


F-32


Table of Contents

ATLAS SAND COMPANY, LLC

NOTES TO THE CONSOLIDATED FINANCIAL STATEMENTS


vesting period based on the grant date fair values using a graded vesting methodology. To determine grant date fair value, the Company valued these unit awards utilizing a Monte Carlo option pricing model, to take into consideration the probability of a market condition on being met. This methodology involves making assumptions for the expected time to liquidity, volatility and risk-free rate.

The Company estimated expected volatility based on a 50/50 blend of historical and implied volatility. The risk-free interest rate is based on the yield on U.S. government bonds for a period commensurate with the expected term. The expected term is based on time to the expected exit date as of the valuation date based on the probability weighted average of exit scenario terms. The Company applies a discount to reflect the lack of marketability due to the absence of an active market for its shares. Further, the Company assumed no expected dividend yield.

For the years ended December 31, 2022, 2021 and 2020, the Company recognized $0.4 million, $0.1 million, and $1.6 million of unit-based compensation expense related to awards in the ASCo Plan, respectively.

As of December 31, 2022, unrecognized unit-based compensation expense amounts related to the ASCo and ASMC Plans were $0.2 million and $0.1 million, respectively, with a weighted average remaining service period of 1.2 years.

Note 11—Income Taxes

The components of the income tax provision are as follows (in thousands):


     For the Year Ended
December 31,
 
     2022      2021      2020  

Current income tax provision:


Federal

   $ —        $ —        $ —    

State

     1,858        471        (294


Total current income tax provision (benefit)

   $ 1,858      $ 471      $ (294

Deferred income tax provision:


Federal

   $ —        $ —        $ —    

State

     (2      360        666  


Total deferred income tax provision (benefit)

   $ (2    $ 360      $ 666  


Income tax provision

   $ 1,856      $ 831      $ 372  


Income tax expense was different than the amounts computed by applying the statutory federal income tax rate for partnerships (0%) as follows (in thousands, except effective tax rates):


    For the Year Ended
December 31,
 
    2022     2021     2020  

Income before income taxes

  $ 218,862     $ 5,089     $ (34,070

Income tax expense at the federal statutory rate

    —         —         —    

State income tax expense

    1,856       831       372  


Income tax expense

  $ 1,856     $ 831     $ 372  

Effective tax rate

    0.8     16.3     (1.1 )% 


F-33


Table of Contents

ATLAS SAND COMPANY, LLC

NOTES TO THE CONSOLIDATED FINANCIAL STATEMENTS


The tax effects of cumulative temporary differences that give rise to significant deferred tax assets and deferred tax liabilities are presented below (in thousands):


     For the Year Ended
December 31,
 
     2022      2021  

Deferred tax assets:


Other

   $ —        $ —    


Total deferred tax assets

   $ —        $ —    


Deferred tax liabilities:


Depreciable and depletable assets

   $ 1,906      $ 1,908  

Other

     —          —    


Total deferred tax liabilities

   $ 1,906      $ 1,908  


Due to the contribution of certain depletable assets by members of the Company, a deferred tax liability was created equal to the difference between the fair market value of the contributed assets (“GAAP basis”) and the historical cost basis (“Tax basis”). A deferred tax liability of $0.9 million has been recorded as a component of members’ equity because the difference resulted from transactions with members. The deferred tax liability will be amortized as the associated basis difference is realized on the tax return.

Note 12—Related-Party Transactions

One member of the Company’s Board of Managers served as an executive for a company to whom the Company sold product. For the year ended December 31, 2020, the Company recognized $0.8 million in revenues from this customer. This entity was no longer considered a related party subsequent to May 2020, as the member of the Company’s Board of Managers was no longer associated with this entity.

The Company had one month-to-month lodging facility lease with a counterparty controlled by one member of the Company’s Board of Managers. During both the years ended December 31, 2021 and 2020, the Company recognized $1.5 million of rent expense associated with these leases. On December 10, 2021, the Company acquired this lodging facility and related assets in West Texas for $7.0 million from counterparties controlled by the Executive Chairman of the Company’s Board of Managers. This transaction is considered an asset acquisition in 2021. Subsequent to this transaction and as of December 31, 2021, the man camp lease was terminated. Therefore, the Company did not incur rental expense on the lodging facility for the year ended December 31, 2022.

On January 26, 2021, the Company entered into a Joint Development Agreement with, among others, a customer, which is controlled by one member of the Company’s Board of Managers. Under the Joint Development Agreement, the Company has agreed to supply sand for certain wells to be drilled and completed the customer. For the years ended December 31, 2022 and 2021, the Company recognized no revenue and $0.2 million under the agreement. For the years ended December 31, 2022 and 2021, the Company recognized $0.9 million and no revenue with this customer that was not under the agreement. As of December 31, 2022 and 2021, the Company’s outstanding balance of related-party accounts receivable to this customer was $0.9 million and $0.1 million.

During the years ended December 31, 2022, 2021 and 2020, the Company incurred $2.4 million, $2.0 million and $1.2 million of expenses with members of the Company, including such activities as


F-34


Table of Contents

ATLAS SAND COMPANY, LLC

NOTES TO THE CONSOLIDATED FINANCIAL STATEMENTS


payroll reimbursements, business development activities, travel expenditures and other general business expenditures, respectively.

As of December 31, 2022 and 2021, the Company’s outstanding balance of related-party accounts payable to these members was $0.2 million and $0.6 million, respectively.

The Company issued warrants for Class D units to the 2018 Term Loan Credit Facility lender, which the 2018 Term Loan Credit Facility lender exercised in full prior to the termination of the 2018 Term Loan Credit Facility. Refer to 2018 Term Loan Credit Facility section in Note 7—Debt and Note 9—Equity for additional disclosure.

Refer to Note 8—Commitments and contingencies for disclosure related to the Company’s royalty agreement with a related party.


F-35


Table of Contents

REPORT OF INDEPENDENT REGISTERED PUBLIC ACCOUNTING FIRM

To the Sole Director and Stockholder of Atlas Energy Solutions Inc.

Opinion on the Financial Statements

We have audited the accompanying balance sheets of Atlas Energy Solutions Inc. (the “Corporation”) as of February 3, 2022 and December 31, 2022 and the related notes (collectively referred to as the “financial statements”). In our opinion, the financial statements presents fairly, in all material respects, the financial position of the Corporation at February 3, 2022 and December 31, 2022, in conformity with U.S. generally accepted accounting principles.

Basis for Opinion

The financial statements are the responsibility of the Corporation’s management. Our responsibility is to express an opinion on the Corporation’s financial statements based on our audits. We are a public accounting firm registered with the Public Company Accounting Oversight Board (United States) (PCAOB) and are required to be independent with respect to the Company in accordance with the U.S. federal securities laws and the applicable rules and regulations of the Securities and Exchange Commission and the PCAOB.

We conducted our audits in accordance with the standards of the PCAOB. Those standards require that we plan and perform the audit to obtain reasonable assurance about whether the financial statements are free of material misstatement, whether due to error or fraud. The Corporation is not required to have, nor were we engaged to perform, an audit of its internal control over financial reporting. As part of our audits, we are required to obtain an understanding of internal control over financial reporting but not for the purpose of expressing an opinion on the effectiveness of the Corporation’s internal control over financial reporting. Accordingly, we express no such opinion.

Our audits included performing procedures to assess the risks of material misstatement of the financial statement, whether due to error or fraud, and performing procedures that respond to those risks. Such procedures included examining, on a test basis, evidence regarding the amounts and disclosures in the financial statements. Our audits also included evaluating the accounting principles used and significant estimates made by management, as well as evaluating the overall presentation of the financial statements. We believe that our audits provides a reasonable basis for our opinion.

/s/ Ernst & Young LLP

We have served as the Corporation’s auditor since 2022.

Austin, Texas

February 15, 2023


F-36


Table of Contents

ATLAS ENERGY SOLUTIONS INC.

BALANCE SHEET


     December 31,
2022
     February 3,
2022
 

Assets


Cash and cash equivalents

   $ 10      $ 10  


Total assets

   $ 10      $ 10  


Stockholders’ equity


Class A Common stock, $0.01 par value, authorized 1,000 shares, 1,000 issued and outstanding at February 3, 2022

   $ 10      $ 10  

Total stockholders’ equity

   $ 10      $ 10  


The accompanying notes are an integral part of these financial statements


F-37


Table of Contents

ATLAS ENERGY SOLUTIONS INC.

NOTES TO THE BALANCE SHEETS

Note 1—Organization and Basis of Presentation

Atlas Energy Solutions Inc. (“Atlas Inc.” or “Corporation”) is a Delaware corporation formed on February 3, 2022. Atlas Inc.’s fiscal year end is December 31. Atlas Inc. was formed with the intent that Atlas Inc. will be included in a reorganization into a holding corporation structure. It is anticipated that the Atlas Inc. will become a holding corporation and its sole material asset is expected to be an equity interest in Atlas Sand Company, LLC, a Delaware limited liability company (the “Company”).

These balance sheets have been prepared in accordance with accounting principles generally accepted in the United States. Separate statements of operations, changes in stockholders’ equity and of cash flows have not been presented because there have been no activities in this entity and because the single transaction is fully disclosed below. These balance sheets have been prepared assuming the Corporation will continue as a going concern, which contemplates, among other things, the realization of assets and satisfaction of liabilities in the normal course of business.

Note 2—Summary of Significant Accounting Policies

Cash and Cash Equivalents

Cash and cash equivalents consist of all highly liquid investments that are readily convertible into cash and have original maturities of three months or less when purchased. The Company places cash deposits with high-credit-quality financial institutions. At times, cash may be uninsured or in deposit accounts that exceed or are not covered under the Federal Deposit Insurance Corporation limit.

Income Taxes

The Corporation is treated as a subchapter C corporation, and therefore, are subject to both federal and state income taxes. The federal and state tax provisions were de minimis as of December 31, 2022.

Note 3—Stockholders’ Equity

Atlas Inc. is authorized to issue 1,000 shares of Class A common stock, par value $0.01 per share (“Class A Common Stock”). Under the Atlas Inc.’s certificate of incorporation in effect as of February 3, 2022, all shares of Class A Common Stock are identical. In exchange for $10.00, the Corporation has issued 1,000 shares of Class A common stock, all of which were held by the Company as of February 3, 2022 and December 31, 2022.

Note 4—Subsequent Events

Subsequent events have been evaluated through February 15, 2023, the date this balance sheet was issued.


F-38


Table of Contents

GLOSSARY OF CERTAIN INDUSTRY TERMS

100-mesh frac sand:    Sand that passes through a sieve with 40 holes per linear inch and is retained by a sieve with 140 holes per linear inch.

40/70-mesh frac sand:    Sand that passes through a sieve with 40 holes per linear inch and is retained by a sieve with 70 holes per linear inch.

API:    American Petroleum Institute.

Crush strength:    A proppant is exposed to varying stress levels in one-thousand PSI increments. The crush strength classifies a proppant according to the stress at which 10% fines is generated. For example, a 7,000 PSI proppant would produce less than 10% fines at 7,000 PSI.

Frac sand:    A proppant used in the completion and re-completion of unconventional oil and natural gas wells to stimulate and maintain oil and natural gas exploration and production through the process of hydraulic fracturing.

Hydraulic fracturing:    The process of pumping fluids, mixed with granular proppants, into a geological formation at pressures sufficient to create fractures in the hydrocarbon-bearing rock.

Inferred resource:    The part of a mineral resource for which quantity and grade or quality can be estimated on the basis of geological evidence and limited sampling and reasonably assumed, but not verified, geological and grade continuity. The estimate is based on limited information and sampling gathered through appropriate techniques from locations such as outcrops, trenches, pits, workings and drill holes.

Mesh size:    Measurement of the size of a grain of sand indicating it will pass through a sieve of a certain size.

mmtpy:    Means one million metric tons per year.

Natural gas:    A mixture of hydrocarbons (principally methane, ethane, propane, butanes and pentanes), water vapor, hydrogen sulfide, carbon dioxide, helium, nitrogen and other chemicals that occur naturally underground in a gaseous state.

Overburden:    Material such as soil and unusable sand that lies above the useable sand and must be removed to excavate the useable sand.

Probable reserves:    Reserves for which quantity and grade and/or quality are computed from information similar to that used for proven reserves, but the sites for inspection, sampling and measurement are farther apart or are otherwise less adequately spaced. The degree of assurance, although lower than that for proven reserves, is high enough to assume continuity between points of observation.

Proppant:    A sized particle mixed with fracturing fluid to hold fractures open after a hydraulic fracturing treatment.

Proven reserves:    Reserves for which (a) quantity is computed from dimensions revealed in outcrops, trenches, workings or drill holes; grade and/or quality are computed from the results of detailed sampling and (b) the sites for inspection, sampling and measurement are spaced so closely and the geologic character is so well defined that size, shape, depth and mineral content of reserves are well-established.

Reserves:    Sand that can be economically extracted or produced at the time of determination based on relevant legal, economic and technical considerations.


A-1


Table of Contents

Roundness:    A measure of how round the curvatures of an object are. The opposite of round is angular. It is possible for an object to be round but not spherical (e.g. an egg-shaped particle is round, but not spherical). When used to describe proppant, roundness is a reference to having a curved shape which promotes hydrocarbon flow, as the curvature creates a space through which the hydrocarbons can flow.

Silica:    A chemically resistant dioxide of silicon that occurs in crystalline, amorphous and cryptocrystalline forms.

Sphericity:    A measure of how well an object is formed in a shape where all points are equidistant from the center. The more spherical a proppant, the more highly it is desired relative to non-spherical proppant, as the gaps created by it are typically the largest and this promotes maximum hydrocarbon flow.

Turbidity:    Measurement of the level of contaminants, such as silt and clay, in a sample.

Shale play:    A geological formation that contains petroleum and/or natural gas in nonporous rock that requires special drilling and completion techniques.

U.S. Energy Information Administration (EIA):    The statistical and analytical agency within the U.S. Department of Energy.


A-2


Table of Contents


Atlas Energy Solutions Inc.

                 Shares


Class A Common Stock


Until                      , 2023 (the 25th day after the date of this prospectus), all dealers effecting transactions in these securities, whether or not participating in this offering, may be required to deliver a prospectus. This is in addition to a dealer’s obligation to deliver a prospectus when acting as an underwriter and with respect to an unsold allotment or subscription.


Table of Contents

PART II

INFORMATION NOT REQUIRED IN PROSPECTUS

Item 13. Other Expenses of Issuance and Distribution.

The following table sets forth an itemized statement of the amounts of all expenses (excluding underwriting discounts and commissions) payable by us in connection with the registration of the common stock offered hereby. With the exception of the SEC registration fee, FINRA filing fee and the NYSE listing fee, the amounts set forth below are estimates.


SEC registration fee

   $ 11,020  

FINRA filing fee

     14,850  

NYSE listing fee

     295,000

Accounting fees and expenses

     450,000

Directors’ & officers’ liability insurance premiums

     525,000

Legal fees and expenses

     3,000,000  

Printing and engraving expenses

     400,000

Transfer agent and registrar fees

     10,000

Miscellaneous

     44,130


Total

   $ 4,750,000


*

To be provided by amendment

Item 14. Indemnification of Directors and Officers.

Subsection (a) of Section 145 of the General Corporation Law of the State of Delaware (referred to as the “DGCL”) empowers a corporation to indemnify any person who was or is a party or who is threatened to be made a party to any threatened, pending or completed action, suit or proceeding, whether civil, criminal, administrative or investigative (other than an action by or in the right of the corporation) by reason of the fact that the person is or was a director, officer, employee or agent of the corporation, or is or was serving at the request of the corporation as a director, officer, employee or agent of another corporation, partnership, joint venture, trust or other enterprise, against expenses (including attorneys’ fees), judgments, fines and amounts paid in settlement actually and reasonably incurred by the person in connection with such action, suit or proceeding if the person acted in good faith and in a manner the person reasonably believed to be in or not opposed to the best interests of the corporation, and, with respect to any criminal action or proceeding, had no reasonable cause to believe the person’s conduct was unlawful.

Subsection (b) of Section 145 empowers a corporation to indemnify any person who was or is a party or is threatened to be made a party to any threatened, pending or completed action or suit by or in the right of the corporation to procure a judgment in its favor by reason of the fact that the person acted in any of the capacities set forth above, against expenses (including attorneys’ fees) actually and reasonably incurred by the person in connection with the defense or settlement of such action or suit if the person acted in good faith and in a manner the person reasonably believed to be in or not opposed to the best interests of the corporation, except that no indemnification shall be made in respect of any claim, issue or matter as to which such person shall have been adjudged to be liable to the corporation unless and only to the extent that the Court of Chancery or the court in which such action or suit was brought shall determine upon application that, despite the adjudication of liability but in view of all the circumstances of the case, such person is fairly and reasonably entitled to indemnity for such expenses which the Court of Chancery or such other court shall deem proper.

Section 145 further provides that to the extent a director or officer of a corporation has been successful on the merits or otherwise in the defense of any action, suit or proceeding referred to in


II-1


Table of Contents

subsections (a) and (b) of Section 145, or in defense of any claim, issue or matter therein, such person shall be indemnified against expenses (including attorneys’ fees) actually and reasonably incurred by such person in connection therewith; that indemnification provided for by Section 145 shall not be deemed exclusive of any other rights to which the indemnified party may be entitled; and the indemnification provided for by Section 145 shall, unless otherwise provided when authorized or ratified, continue as to a person who has ceased to be a director, officer, employee or agent and shall inure to the benefit of such person’s heirs, executors and administrators. Section 145 also empowers the corporation to purchase and maintain insurance on behalf of any person who is or was a director, officer, employee or agent of the corporation, or is or was serving at the request of the corporation as a director, officer, employee or agent of another corporation, partnership, joint venture, trust or other enterprise against any liability asserted against such person and incurred by such person in any such capacity, or arising out of his status as such, whether or not the corporation would have the power to indemnify such person against such liabilities under Section 145.

Section 102(b)(7) of the DGCL provides that a corporation’s certificate of incorporation may contain a provision eliminating or limiting the personal liability of a director to the corporation or its stockholders for monetary damages for breach of fiduciary duty as a director, provided that such provision shall not eliminate or limit the liability of a director (i) for any breach of the director’s duty of loyalty to the corporation or its stockholders, (ii) for acts or omissions not in good faith or which involve intentional misconduct or a knowing violation of law, (iii) under Section 174 of the DGCL or (iv) for any transaction from which the director derived an improper personal benefit.

Our amended and restated certificate of incorporation will provide for indemnification of its directors, officers, employees and other agents to the maximum extent permitted by the Delaware General Corporation Law, and our bylaws will provide for indemnification of its directors, officers, employees and other agents to the maximum extent permitted by the Delaware General Corporation Law.

In addition, we will enter into indemnification agreements with each of our directors and officers. These agreements will require us to indemnify these individuals to the fullest extent permitted under Delaware law against liabilities that may arise by reason of their service to us, and to advance expenses incurred as a result of any proceeding against them as to which they could be indemnified. We intend to enter into indemnification agreements with its future directors.

The proposed form of underwriting agreement, to be filed as Exhibit 1.1 to this registration statement provides for indemnification of our directors and officers by the underwriters against certain liabilities arising under the Securities Act or otherwise in connection with this offering.

Insofar as indemnification for liabilities arising under the Securities Act may be permitted to directors, officers or person controlling us pursuant to the foregoing provisions, we have been informed that in the opinion of the SEC, such indemnification is against public policy as expressed in the Securities Act and is therefore unenforceable.

Item 15. Recent Sales of Unregistered Securities.

In connection with our incorporation on February 3, 2022 under the laws of the State of Delaware, we issued 1,000 shares of our Class A common stock to Atlas LLC for an aggregate purchase price of $10.00. These securities were offered and sold by us in reliance upon the exemption from the registration requirements provided by Section 4(a)(2) of the Securities Act. These shares will be redeemed for nominal value in connection with our reorganization.

Further, pursuant to the terms of certain reorganization transactions that will be completed prior to the closing of this offering, as described in further detail under “Corporate Reorganization,” we will


II-2


Table of Contents

issue shares of Class B common stock to certain of the Legacy Owners. Such issuances will not involve any underwriters, underwriting discounts or commissions or a public offering, and we believe that each such issuance will be exempt from registration requirements pursuant to Section 4(a)(2) of the Securities Act.

Item 16. Exhibits and Financial Statement Schedules.


Exhibit
Number


Description

  *1.1        Form of Underwriting Agreement.
  *2.1        Form of Master Reorganization Agreement.
  **3.1        Certificate of Incorporation of Atlas Energy Solutions Inc.
  *3.2        Form of Amended and Restated Certificate of Incorporation of Atlas Energy Solutions Inc.
  **3.3        Bylaws of Atlas Energy Solutions Inc.
  **3.4        Form of Amended and Restated Bylaws of Atlas Energy Solutions Inc.
  **4.1        Form of Class A Common Stock Certificate.
  **4.2        Form of Registration Rights Agreement.
  **5.1        Form of Opinion of Vinson & Elkins L.L.P. as to the legality of the securities being registered.
  *10.1†      Form of Atlas Energy Solutions Inc. Long Term Incentive Plan.
  **10.2      Form of Indemnification Agreement.
  *10.3        Form of Stockholders’ Agreement.
  **10.4        Form of Amended and Restated Limited Liability Company Agreement of Atlas Sand Operating, LLC.
  *10.5        Loan, Security and Guaranty Agreement, dated as of February 22, 2023, among Atlas Sand Company, LLC, as Borrower, certain of its subsidiaries, as Guarantors, Bank of America, N.A., as Agent and Bank of America, N.A., as Sole Lead Arranger and Sole Bookrunner.
  **10.6        Credit Agreement, dated October  20, 2021 by and between Atlas Sand Company, LLC, as borrower, and Stonebriar Commercial Finance, LLC as lender.
  **#10.7        Mining Lease Agreement, dated as of December 15, 2017, by and between the Sealy & Smith Foundation and Atlas Sand Company, LLC.
  *+10.8      Third Amended & Restated Limited Liability Company Agreement of Atlas Sand Company, LLC
  *+10.9      First Amended & Restated Limited Liability Company Agreement of Atlas Sand Management Company, LLC
  *10.10†      Atlas Sand Company, LLC Long Term Incentive Plan
  *10.11†      Atlas Sand Management Company, LLC Long Term Incentive Plan
  *+10.12†      Form of Participation Agreement (Atlas Sand Company, LLC Long Term Incentive Plan)
  *+10.13†      Form of Participation Agreement (Atlas Sand Management Company, LLC Long Term Incentive Plan)


II-3


Table of Contents

Exhibit
Number


Description

  **21.1        List of subsidiaries of Atlas Energy Solutions Inc.
  *23.1        Consent of Ernst & Young LLP, independent registered public accounting firm to Atlas Energy Solutions Inc.
  *23.2        Consent of Ernst & Young LLP, independent registered public accounting firm to Atlas Sand Company, LLC.
  **23.3        Consent of Vinson & Elkins L.L.P. (included as part of Exhibit 5.1 hereto).
  **23.4        Consent of John T. Boyd Company, independent mining engineers and geologists.
  **23.5      Consent of Stacy Hock.
  **23.6      Consent of Gayle Burleson.
  **23.7      Consent of Mark P. Mills.
  **23.8      Consent of Robb L. Voyles.
  **23.9      Consent of Douglas G. Rogers.
  **23.10        Consent of A. Lance Langford.
  **23.11      Consent of Stephen C. Cole.
  **24.1        Power of Attorney (included on the signature page of the initial filing of the Registration Statement).
  **99.1        John T. Boyd Company Summary of Reserves at December 31, 2021.
  **99.2        Addendum to Summary Reserve Report of John T. Boyd Company as of December 31, 2022.
  **107        Calculation of Filing Fee Table.


*

Filed herewith.

**

Previously filed.

Compensatory plan or arrangement

#

Certain portions of this exhibit have been omitted because they are both (i) not material and (ii) would be competitively harmful if publicly disclosed.

+

The exhibits and schedules have been omitted pursuant to Item 601(b)(2) of Regulation S-K and will be provided to the Securities and Exchange Commission upon request.

Item 17. Undertakings.

The undersigned registrant hereby undertakes to provide to the underwriters at the closing specified in the underwriting agreement certificates in such denominations and registered in such names as required by the underwriters to permit prompt delivery to each purchaser.

Insofar as indemnification for liabilities arising under the Securities Act may be permitted to directors, officers and controlling persons of the registrant pursuant to the foregoing provisions, or otherwise, the registrant has been advised that in the opinion of the Securities and Exchange Commission such indemnification is against public policy as expressed in the Securities Act and is, therefore, unenforceable. In the event that a claim for indemnification against such liabilities (other than the payment by the registrant of expenses incurred or paid by a director, officer or controlling person of the registrant in the successful defense of any action, suit or proceeding) is asserted by such director, officer or controlling person in connection with the securities being registered, the registrant will, unless


II-4


Table of Contents

in the opinion of its counsel the matter has been settled by controlling precedent, submit to a court of appropriate jurisdiction the question whether such indemnification by it is against public policy as expressed in the Securities Act and will be governed by the final adjudication of such issue.

The undersigned registrant hereby undertakes that:


  (1)

For purposes of determining any liability under the Securities Act of 1933, the information omitted from the form of prospectus filed as part of this registration statement in reliance upon Rule 430A and contained in a form of prospectus filed by the registrant pursuant to Rule 424(b)(1) or (4) or 497(h) under the Securities Act shall be deemed to be part of this registration statement as of the time it was declared effective.


  (2)

For the purpose of determining any liability under the Securities Act of 1933, each post-effective amendment that contains a form of prospectus shall be deemed to be a new registration statement relating to the securities offered therein, and the offering of such securities at that time shall be deemed to be the initial bona fide offering thereof.

For the purpose of determining liability under the Securities Act of 1933 to any purchaser, if the registrant is subject to Rule 430C, each prospectus filed pursuant to Rule 424(b) as part of a registration statement relating to an offering, other than registration statements relying on Rule 430B or other than prospectuses filed in reliance on Rule 430A, shall be deemed to be part of and included in the registration statement as of the date it is first used after effectiveness. Provided, however, that no statement made in a registration statement or prospectus that is part of the registration statement or made in a document incorporated or deemed incorporated by reference into the registration statement or prospectus that is part of the registration statement will, as to a purchaser with a time of contract of sale prior to such first use, supersede or modify any statement that was made in the registration statement or prospectus that was part of the registration statement or made in any such document immediately prior to such date of first use.

For the purpose of determining liability of the registrant under the Securities Act of 1933 to any purchaser in the initial distribution of the securities, the undersigned registrant undertakes that in a primary offering of securities of the undersigned registrant pursuant to this registration statement, regardless of the underwriting method used to sell the securities to the purchaser, if the securities are offered or sold to such purchaser by means of any of the following communications, the undersigned registrant will be a seller to the purchaser and will be considered to offer or sell such securities to such purchaser:


  (1)

Any preliminary prospectus or prospectus of the undersigned registrant relating to the offering required to be filed pursuant to Rule 424;


  (2)

Any free writing prospectus relating to the offering prepared by or on behalf of the undersigned registrant or used or referred to by the undersigned registrant;


  (3)

The portion of any other free writing prospectus relating to the offering containing material information about the undersigned registrant or its securities provided by or on behalf of the undersigned registrant; and


  (4)

Any other communication that is an offer in the offering made by the undersigned registrant to the purchaser.


II-5


Table of Contents

SIGNATURES

Pursuant to the requirements of the Securities Act of 1933, the registrant has duly caused this registration statement to be signed on its behalf by the undersigned, thereunto duly authorized, in the City of Austin, State of Texas, on February 24, 2023.


ATLAS ENERGY SOLUTIONS INC.
By:  

/s/ Ben M. Brigham

Name:  

Ben M. Brigham

Title:  

Executive Chairman, Chief Executive Officer and Director

Pursuant to the requirements of the Securities Act of 1933, as amended, this Registration Statement has been signed below by the following persons in the capacities indicated below on February 24, 2023.


Name


Title

/s/ Ben M. Brigham

   Executive Chairman, Chief Executive Officer and Director
Ben M. Brigham   

(Principal Executive Officer)

/s/ John Turner

   President and Chief Financial Officer
John Turner    (Principal Accounting and Financial Officer)


II-6