UNITED STATES
SECURITIES AND EXCHANGE COMMISSION
Washington, D.C. 20549
FORM
(Mark One)
ANNUAL REPORT PURSUANT TO SECTION 13 OR 15(d) OF THE SECURITIES EXCHANGE ACT OF 1934 |
For the fiscal year ended
OR
TRANSITION REPORT PURSUANT TO SECTION 13 OR 15(d) OF THE SECURITIES EXCHANGE ACT OF 1934 |
For the transition period from to
Commission File Number
t
(Exact name of Registrant as specified in its Charter)
(State or other jurisdiction of incorporation or organization) |
(I.R.S. Employer |
(Address of principal executive offices) |
(Zip Code) |
Registrant’s telephone number, including area code:
(
Securities registered pursuant to Section 12(b) of the Act:
Title of each class |
|
Trading Symbol(s) |
|
Name of each exchange on which registered |
|
|
Securities registered pursuant to Section 12(g) of the Act: None
Indicate by check mark if the Registrant is a well-known seasoned issuer, as defined in Rule 405 of the Securities Act. Yes ☐
Indicate by check mark if the Registrant is not required to file reports pursuant to Section 13 or 15(d) of the Act. Yes ☐
Indicate by check mark whether the Registrant: (1) has filed all reports required to be filed by Section 13 or 15(d) of the Securities Exchange Act of 1934 during the preceding 12 months (or for such shorter period that the Registrant was required to file such reports), and (2) has been subject to such filing requirements for the past 90 days.
Indicate by check mark whether the Registrant has submitted electronically every Interactive Data File required to be submitted pursuant to Rule 405 of Regulation S-T (§232.405 of this chapter) during the preceding 12 months (or for such shorter period that the Registrant was required to submit such files).
Indicate by check mark whether the registrant is a large accelerated filer, an accelerated filer, a non-accelerated filer, a smaller reporting company, or an emerging growth company. See the definitions of “large accelerated filer,” “accelerated filer,” “smaller reporting company,” and “emerging growth company” in Rule 12b-2 of the Exchange Act.
Large accelerated filer |
|
☐ |
|
Accelerated filer |
|
☐ |
|
☒ |
|
Smaller reporting company |
|
||
Emerging growth company |
|
|
|
|
|
If an emerging growth company, indicate by check mark if the registrant has elected not to use the extended transition period for complying with any new or revised financial accounting standards provided pursuant to Section 13(a) of the Exchange Act.
Indicate by check mark whether the registrant has filed a report on and attestation to its management’s assessment of the effectiveness of its internal control over financial reporting under Section 404(b) of the Sarbanes-Oxley Act (15 U.S.C. 7262(b)) by the registered public accounting firm that prepared or issued its audit report.
If securities are registered pursuant to Section 12(b) of the Act, indicate by check mark whether the financial statements of the registrant included in the filing reflect the correction of an error to previously issued financial statements.
Indicate by check mark whether any of those error corrections are restatements that required a recovery analysis of incentive-based compensation received by any of the registrant’s executive officers during the relevant recovery period pursuant to §240.10D-1(b). ☐
Indicate by check mark whether the Registrant is a shell company (as defined in Rule 12b-2 of the Exchange Act). YES ☐ NO
The aggregate market value of the outstanding common stock held by non-affiliates of the registrant as of June 30, 2023, the last business day of the registrant's most recently completed second fiscal quarter, was approximately $
As of February 21, 2024, the registrant had
DOCUMENTS INCORPORATED BY REFERENCE
Portions of the registrant’s definitive proxy statement for its 2024 Annual Meeting of Stockholders (the “Proxy Statement”) are incorporated by reference into Part III of this Annual Report on Form 10-K and will be filed within 120 days of the registrant’s fiscal year end.
Table of Contents
|
|
Page |
PART I |
|
|
Item 1. |
9 |
|
Item 1A. |
18 |
|
Item 1B. |
46 |
|
Item 1C. |
46 |
|
Item 2. |
48 |
|
Item 3. |
54 |
|
Item 4. |
54 |
|
|
|
|
PART II |
|
|
Item 5. |
55 |
|
Item 6. |
56 |
|
Item 7. |
Management’s Discussion and Analysis of Financial Condition and Results of Operations |
57 |
Item 7A. |
70 |
|
Item 8. |
F-1 |
|
Item 9. |
Changes in and Disagreements With Accountants on Accounting and Financial Disclosure |
108 |
Item 9A. |
108 |
|
Item 9B. |
108 |
|
Item 9C. |
Disclosure Regarding Foreign Jurisdictions that Prevent Inspections |
108 |
|
|
|
PART III |
|
|
Item 10. |
109 |
|
Item 11. |
109 |
|
Item 12. |
Security Ownership of Certain Beneficial Owners and Management and Related Stockholder Matters |
109 |
Item 13. |
Certain Relationships and Related Transactions, and Director Independence |
109 |
Item 14. |
109 |
|
|
|
|
PART IV |
|
|
Item 15. |
110 |
|
Item 16. |
112 |
i
GLOSSARY OF COMMONLY USED TERMS
Unless the context otherwise requires, all references in this Annual Report on Form 10‑K (this “Annual Report”) to:
2
3
4
CAUTIONARY STATEMENT REGARDING FORWARD-LOOKING STATEMENTS
This Annual Report contains forward-looking statements that are subject to risks and uncertainties. All statements, other than statements of historical fact included in this Annual Report, regarding our strategy, future operations, financial position, estimated revenues and losses, projected costs, prospects, plans and objectives of management are forward-looking statements. Additionally the information in this Annual Report includes forward-looking statements related to the recently-announced Hi-Crush Transaction (as defined in Item 7. “Management’s Discussion and Analysis of Financial Condition and Results of Operations.—Recent Developments”). When used in this Report, the words “may,” “forecast,” “continue,” “could,” “would,” “will,” “plan,” “believe,” “anticipate,” “intend,” “estimate,” “expect,” “project” and similar expressions are intended to identify forward-looking statements, although not all forward-looking statements contain such identifying words. These forward-looking statements are based on our current expectations and assumptions about future events and are based on currently available information as to the outcome and timing of future events. When considering forward-looking statements, you should keep in mind the risk factors and other cautionary statements described in Item 1A. “Risk Factors” included in this Annual Report. By their nature, forward-looking statements involve known and unknown risks and uncertainties because they relate to events and depend on circumstances that may or may not occur in the future. Although we believe that the forward-looking statements contained in this Annual Report are based on reasonable assumptions, you should be aware that many factors could affect our actual financial results or results of operations and could cause actual results to differ materially from those in such forward-looking statements, including but not limited to:
5
We caution you that these forward-looking statements are subject to numerous risks and uncertainties, most of which are difficult to predict and many of which are beyond our control. These risks include, but are not limited to, the risks described in Item 1A. “Risk Factors” in this Annual Report.
You are cautioned not to place undue reliance on any forward-looking statements, which speak only as of the date of this Annual Report. Should one or more of the risks or uncertainties described in this Annual Report occur, or should underlying assumptions prove incorrect, our actual results and plans could differ materially from those expressed in any forward-looking statements. All forward-looking statements, expressed or implied, included in this Annual Report are expressly qualified in their entirety by this cautionary statement. This cautionary statement should also be considered in connection with any subsequent written or oral forward-looking statements that we or persons acting on our behalf may issue. Except as otherwise required by applicable law, we disclaim any duty to update any forward-looking statements to reflect events or circumstances after the date of this Annual Report.
6
SUMMARY OF RISK FACTORS
This summary briefly lists the principal risks and uncertainties facing our business, which are only a select portion of those risks. A more complete discussion of those risks and uncertainties is set forth in Item 1A. “Risk Factors.” Additional risks not presently known to us or that we currently deem immaterial may also affect us. If any of these risks occur, our business, financial condition or results of operations could be materially and adversely affected. Our business is subject to, among others, the following principal risks and uncertainties:
Risks Related to Our Business and Operations
Risks Related to Our Financial Condition
7
Risks Related to Our Organizational Structure and Ownership of Our Common Stock
Risks Related to Environmental, Mining and Other Regulations
Risks Related to the Hi-Crush Transaction
8
PART I
Item 1. Business.
Overview
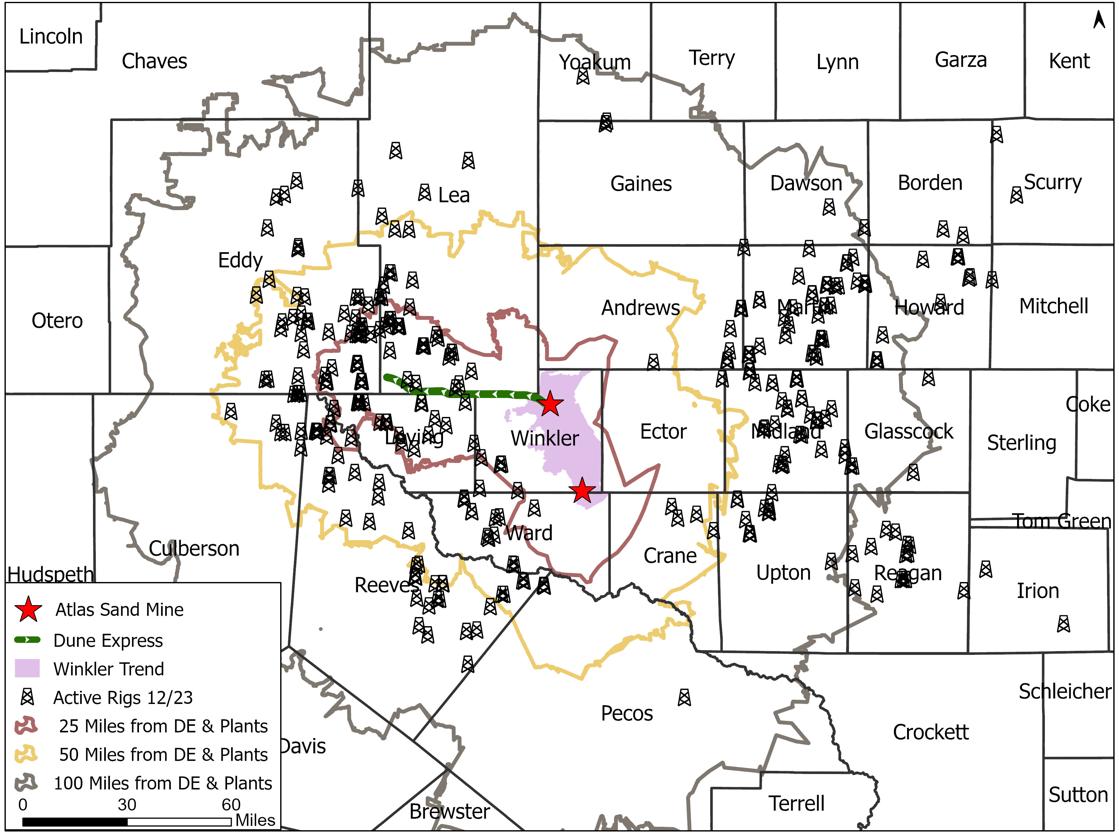
We are a low-cost producer of high-quality, locally sourced 100 mesh and 40/70 sand used as a proppant during the well completion process. Proppant is necessary to facilitate the recovery of hydrocarbons from oil and natural gas wells. One hundred percent of our sand reserves are located in Winkler and Ward Counties, Texas, within the Permian Basin, and our operations consist of proppant production and processing facilities, including two facilities near Kermit, Texas and a third facility near Monahans, Texas. As of December 31, 2023, our Kermit and Monahans facilities have a total combined annual production capacity of 16.5 million tons.
We also operate a logistics platform that is designed to increase the efficiency, safety and sustainability of the oil and natural gas industry within the Permian Basin. This includes our fleet of fit-for-purpose trucks and trailers and will include the Dune Express, an overland conveyor infrastructure solution currently under construction.
On March 13, 2023, Old Atlas completed its initial public offering of 18,000,000 shares of Old Atlas Class A Common Stock at a price of $18.00 per share. The IPO generated $324.0 million of gross proceeds and net proceeds of approximately $291.2 million, after deducting underwriter discounts and commissions and estimated offering costs. In connection with the IPO, pursuant to a master reorganization agreement dated March 8, 2023, by and among Old Atlas, ASMC, Atlas LLC, Holdings, Atlas Operating, Holdings II, ASMC II, and Atlas Sand Merger Sub, LLC, a Delaware limited liability company, Old Atlas and the parties thereto completed certain restructuring transactions. As a result of these restructuring transactions, Atlas Operating became the wholly-owned operating subsidiary of Old Atlas, Atlas LLC became a wholly-owned subsidiary of Atlas Operating, and Atlas LLC continued to own all of the Company’s operating assets.
On October 2, 2023, Old Atlas and the Company completed the Up-C Simplification as contemplated by the Master Reorganization Agreement in order to, among other things, reorganize under a new public holding company and eliminate Old Atlas’s “up-C” and dual-class stock structure. Pursuant to the Master Reorganization Agreement, (a) PubCo Merger Sub merged with and into Old Atlas, as a result of which (i) each share of Old Atlas Class A Common Stock then issued and outstanding was exchanged for one share of Common Stock of the Company, (ii) all of the shares of Old Atlas Class B Common Stock then issued and outstanding were surrendered and cancelled for no consideration and (iii) Old Atlas survived the PubCo Merger as a direct, wholly-owned subsidiary of the Company; and (b) Opco Merger Sub merged with and into Atlas Operating, as a result of which (i) each Operating Unit then issued and outstanding, other than those Operating Units held by Old Atlas, was exchanged for one share of Common Stock of the Company and (ii) Atlas Operating became a wholly-owned subsidiary of the Company.
After completion of the Up-C Simplification, the Company replaced Old Atlas as the publicly held entity and, through its subsidiaries, conducts all of the operations previously conducted by Old Atlas, and Old Atlas remains the managing member of Atlas Operating.
Assets and Operations
We developed our Kermit and Monahans facilities as in-basin proppant mines on approximately 38,000 surface acres that we own or lease in Winkler and Ward Counties, Texas. We control 14,575 acres of large open-dune reserves and resources, which represent more than 70% of the total giant open dune acreage in the Winkler Sand Trend available for sand mining. The Monahans Dune consists of approximately 8,750 acres of premium open-dune reserves. Additionally, we have substantial off-dune acreage at Monahans that is not included in our estimated reserves or resources but that could be mined following our removal of material, such as soil and unusable sand, that lies above the useable sand and must be removed to excavate the useable sand, which we refer to as “overburden.” The Kermit Dunes consists of approximately 5,826 acres of premium open-dune reserves.
Significant Innovation Projects
Second Kermit Facility
At the start of 2023, we had one Kermit facility and one Monahans facility, each of which was capable of producing 5.5 million tons of proppant annually. In response to the increase in market demand, and also in connection with the expansion of our logistics offering, we expanded our Kermit production capacity in 2023 by adding a new facility with 5.5 million tons of annual production capacity, for a combined total production capacity of 16.5 million tons annually as of December 31, 2023.
The Dune Express Electric Conveyor System
The Dune Express, which will originate at our Kermit facilities and stretch into the middle of the Northern Delaware Basin, will be the first long-haul proppant conveyor system in the world. Upon completion, we expect the Dune Express to be 42 miles in length, capable of transporting 13 million tons of proppant annually and to have approximately 85,000 tons of dry storage within the system. This conveyor system will be strategically located to deliver proppant to the producing region of the Delaware Basin. We expect the Dune Express to lower transportation cost and increase safety by removing trucks from public roadways, thus reducing traffic, accidents and fatalities on public roadways in the region.
9
We plan to install two permanent loadout facilities near the middle of the conveyor system close to the Texas side of the Texas-New Mexico state line and at the end of the Dune Express right-of-way on BLM land near the Lea-Eddy County line in New Mexico. The conveyor system will also utilize one or more “mobile” loadouts, which can be mobilized and relocated from time to time, to maximize delivery efficiencies particularly for operators pursuing a concentrated development plan in the area that is proximate to the conveyor system but not proximate to one of the two permanent loadouts connected to the system.
As of December 31, 2023, 90% of equipment and materials and 80% of installation services for construction of the Dune Express have been ordered and contracted. Additionally, we have cleared, graded and laid caliche on the vast majority of the right-of-way and have taken delivery of approximately 150 conveyor belt sections, equivalent to approximately 57 miles of total conveyor belt and over 100 miles of fiberoptic cable. The Dune Express is expected to be in service during the fourth quarter of 2024.
Wellsite Delivery Assets
Our existing logistics business utilizes third-party transportation contractors which we currently supplement with our own trucks and trailers. As of February 27, 2024, we added 120 trucks and 323 trailers to our fit-for-purpose trucking fleet, which we expect will improve our productivity, as measured by tons per truck that can be delivered daily, compared to the throughput performance of traditional trucking assets.
Map of Operations
The following map shows the locations of our Kermit and Monahans facilities in Winkler and Ward Counties, Texas, as well as the Dune Express route based on secured rights-of-ways and federal permits, alongside a recent snapshot of the rig count in the Permian Basin as of December 31, 2023:
Source: Enverus, Baker Hughes.
Our Kermit and Monahans facilities were built to produce high quality 40/70-mesh and 100-mesh sands, each of which is used extensively in upstream operations in the Permian Basin. Each facility was constructed with a modular design that provides us with the flexibility to expand any of the existing facilities to achieve incremental production capacity gains if such expansion were found to be necessary or desirable in light of customer demand, broader market conditions or other relevant considerations. Innovative plant design and large-scale operations facilitate low-cost operations and continuity on site. Redundancies were designed into our facilities to remove singular points of failure that could disrupt the production process, ensuring maximum reliability of proppant production and delivery. The facilities are capable of operating year-round and feature advanced safety designs, onsite water supply, power infrastructure and access to low-cost natural gas through connections to interstate natural gas lines. Collectively, our Kermit and Monahans facilities have a combined annual production capacity of 16.5 million tons, 85,000 tons of dry storage, 1,190,000 tons of wet storage and 17 loadout lanes.
10
Further, we benefit from the strategic locations of our facilities, proximal to major highways at the south and north ends of the Winkler Sand Trend. Our Kermit facilities are bisected by two state highways, while our Monahans facility its adjacent to two highways, one of which is Interstate 20, facilitating efficient transportation of our proppant to customers located at various points within the Permian Basin.
The operations of our sand facilities are managed and monitored in a highly automated manner from our command center in Austin, Texas. The remote ecosystem allows our employees to simultaneously manage processes at all facilities, resulting in personnel productivity gains.
Our Products and Services
Product
We serve the oil and gas end markets, and our sand reserves contain deposits of fine grade 40/70-mesh and 100-mesh sizes that API specifies for use in wellsite fracturing operations. We believe that this mix of finer grade sand reserves is in higher demand and meets current industry preferences. Based on the reserve report prepared by John T. Boyd Company, our independent mining engineers and geologists, as of December 31, 2023, we had 488.0 million tons of proven and probable sand reserves at our Kermit and Monahans locations, and our reserves were composed of approximately 53% 40/70-mesh and 47% 70/140-mesh substrate sand. Based on our current total annual expected production capacity of approximately 16.5 million tons as of December 31, 2023, we estimate our reserve life to be approximately 31 years for our Kermit facilities and 29 years for our Monahans facility, as may be extended or adjusted for future conversions of measured, indicated or inferred resources to proven or probable reserves or any change to our production capacity. For more information regarding our mineral reserves, see Item 2. “Property.—Our Reserves.”
Proppant from our Kermit and Monahans facilities is stored in our onsite silos before transport and delivery by truck to customers’ well sites located primarily in the Delaware and Midland Basins. Our proppant is offered to our customers at the mine or as an integrated mine-to-wellhead solution.
Services
We provide transportation, storage solutions and contract labor services to companies in the oil and gas industry. Transportation services typically consist of transporting product from the plant facilities to the wellsite. The locations of the Kermit and Monahans facilities are within close proximity to well activity and enable us to deliver proppant directly to our customers’ wellheads using traditional pneumatic assets, portable silos, boxes or portable conveyance systems, reducing handling costs and delivery lead times.
Our Permits
We have obtained numerous federal, state and local permits required for operations at our Kermit and Monahans facilities. The Kermit and Monahans operations are predominantly regulated by the TCEQ with respect to environmental compliance. The predominant permitting requirement is an active New Source Review (“NSR”) permit for air pollution control. Both of our operations have a current NSR permit which is renewable next in 2028. Other permits held by our operations include Stormwater, Above Ground Storage Tank, Aggregate Production Operation, and a septic permit. A Spill Prevention, Control, and Countermeasure plan is also active at both locations.
While resources invested in securing permits are significant, this cost has not had a material adverse effect on our results of operations or financial condition. We cannot be certain that existing environmental laws and regulations will not be reinterpreted or revised or that new environmental laws and regulations will not be adopted or become applicable to us. Revised or additional environmental requirements that result in increased compliance costs or additional operating restrictions could have a material adverse effect on our business.
Environmental and Occupational Health and Safety Regulations
We are subject to stringent and complex federal, state and local laws and regulations governing the discharge of materials into the environment or otherwise relating to protection of worker health, safety and the environment and natural resources (including threatened and endangered species). Compliance with these laws and regulations may expose us to significant costs and liabilities and cause us to incur significant capital expenditures in our operations. Any failure to comply with these laws and regulations may result in the assessment of administrative, civil and criminal penalties, imposition of remedial obligations and the issuance of injunctions delaying or prohibiting operations. Certain environmental laws may impose strict, joint and several liability for remediation costs. Private parties may also have the right to pursue legal actions to enforce compliance as well as to seek damages for non-compliance with environmental laws and regulations or for personal injury or property damage. In addition, the trend in environmental regulation has been to place more restrictions on activities that may affect the environment, and thus, any changes in, or more stringent enforcement of, these laws and regulations that result in more stringent and costly pollution control equipment, the occurrence of delays in the permitting or performance of projects, or waste handling, storage, transport, disposal or remediation requirements could have an adverse effect on our operations and financial position.
11
We do not believe that compliance by us and our customers with federal, state or local environmental laws and regulations will have an adverse effect on our business, financial position or results of operations or cash flows. We cannot assure you, however, that future events, such as changes in existing laws or enforcement policies, the enactment or promulgation of new laws or regulations or the development or discovery of new facts or conditions adverse to our operations will not cause us to incur significant costs. The following is a discussion of material environmental and worker health and safety laws, as amended from time to time, that relate to our operations or those of our customers that could have an adverse effect on our business.
Worker & Community Health and Safety
We are subject to the requirements of the federal Occupational Safety and Health Administration (“OSHA”), and comparable state statutes that regulate the protection of the health and safety of workers. In addition, the OSHA hazard communication standard requires that information be maintained about hazardous materials used or produced in operations and that this information be provided to employees, state and local government authorities and the public. Similar obligations related to community safety are codified in the Emergency Planning & Community Right to Know Act, as authorized by the Superfund Amendments and Reauthorization Act. These laws and regulations are subject to frequent changes and any failure to comply with these laws could lead to the assertion of third-party claims against us, civil or criminal fines and changes in the way we operate our facilities, which one or more events could have an adverse effect on our financial position. We have an internal program of inspection designed to monitor and enforce compliance with worker safety requirements. Historically, our worker and community health and safety compliance costs have not had an adverse effect on our results of operations.
Air Emissions
Our operations and the operations of our customers are subject to the federal Clean Air Act (“CAA”) and related state and local laws, which restrict the emission of air pollutants and impose permitting, monitoring and reporting requirements on various sources. These regulatory programs may require preconstruction permitting, best available control technology analysis, the installation of emissions abatement equipment, modification of operational practices and obtaining permits or similar authorizations for our operations. Obtaining air emissions permits has the potential to delay the development or continued performance of our operations. Over the next several years, we may be required to incur certain capital expenditures for air pollution control equipment or to address air emissions-related issues as we expand our facilities or develop new ones. Changing and increasingly stricter requirements, future non-compliance or failure to maintain necessary permits or other authorizations could require us to incur substantial costs or suspend or terminate our operations. We could be subject to administrative, civil and criminal penalties as well as injunctive relief for noncompliance with air permits or other requirements of the CAA and comparable state laws and regulations.
Climate Change
In the United States, no comprehensive climate change legislation has been implemented at the federal level. However, following the U.S. Supreme Court finding that emissions of greenhouse gases (“GHGs”) constitute a pollutant under the CAA, the EPA has adopted regulations that, among other things, establish construction and operating permit reviews for emissions from certain large stationary sources, require the monitoring and annual reporting of GHG emissions from certain petroleum and natural gas system sources in the United States, and together with the Department of Transportation (the “DOT”), implement GHG emissions limits on vehicles manufactured for operation in the United States. In recent years the U.S. Congress has also considered legislation to reduce emissions of methane and carbon dioxide, two GHGs associated with the development and use of natural gas. Additionally, energy legislation and related regulatory initiatives have been and continue to be proposed that are relevant to GHG emissions issues. For example, the Inflation Reduction Act of 2022 (“IRA”) appropriated significant federal funding for renewable energy initiatives and, for the first time ever, imposed a fee (the implementation of which is currently under development by the EPA) on GHG emissions from certain facilities. The emissions fee and funding provisions of the law could increase the operating costs of our customers and accelerate the transition away from fossil fuels, which could in turn adversely affect our business and results of operations. Additionally, several U.S. states, either individually or in regional collaboration, have adopted or are considering adopting legislation, policies, or regulatory initiatives focused on GHG emissions reductions, including cap and trade programs, carbon taxes, performance standards, and reporting and monitoring programs. Internationally, the United Nations-sponsored Paris Agreement (“Paris Agreement”) requires member states to individually determine and submit non-binding emissions reduction targets every five years after 2020. President Biden recommitted the United States to the Paris Agreement and, in April 2021, announced a goal of reducing the United States’ emissions by 50-52% below 2005 levels by 2030. Various U.S. states and local governments have also publicly committed to furthering the goals of the Paris Agreement. The international community continues to gather annually to develop and negotiate international climate initiatives, pledges, and frameworks. The impacts of these orders, pledges, agreements and any legislation or regulation promulgated to fulfill the United States’ commitments under the Paris Agreement or other international agreements cannot be predicted at this time.
12
Domestically, President Biden highlighted addressing climate change as a priority of his administration and has issued several executive orders addressing climate change, published a strategic roadmap to net-zero emissions in the United States by 2050, “The Long-Term Strategy of the United States: Pathways to Net-Zero Greenhouse Gas Emissions by 2050,” and directed federal agencies to include climate change considerations into their decision-making processes. For example, the Biden Administration temporarily paused federal oil and gas leasing, and is currently pausing authorizations for new LNG exports to certain countries, for federal agency-led reviews of these programs, which incorporate climate-impact analyses.
Emerging climate-change focused legislation and regulation, policy directives, and related initiatives have the potential to increase our and our customers’ operating costs and reduce demand for our customers’ products and thereby our services. Further, any limitations or restrictions on the development of fossil fuel-specific infrastructure and our customers’ ability to access capital, develop their assets, and market their products may adversely affect our business and results of operations. For more information on applicable climate change-related regulatory matters, developments and risks affecting our business, please see our “Risk Factors—Risks Related to Environmental, Mining and Other Regulations—Our and our customers’ operations are subject to a number of risks arising out of the threat of climate change, including regulatory, political, litigation and financial risks, which could result in increased operating and capital costs for our customers and reduced demand for our products and services” and “Risk Factors—Risks Related to Our Business and Operations— Increased stakeholder and market attention to ESG and conservation matters may adversely impact our business and access to capital.”
Water Discharges
The federal Clean Water Act (“CWA”) and analogous state laws impose restrictions and strict controls with respect to the discharge of pollutants, including spills and leaks of oil and other substances, into waters of the United States. The discharge of pollutants into regulated waters, including jurisdictional wetlands, is prohibited, except in accordance with the terms of a permit issued by the EPA or an analogous state agency. The CWA also prohibits the discharge of dredge and fill material in regulated waters, including wetlands, unless authorized by a permit issued by the U.S. Army Corps of Engineers (the “Corps”). Federal and state regulatory agencies can impose administrative, civil and criminal penalties, as well as require remedial or mitigation measures, for non-compliance with discharge permits or other requirements of the CWA and analogous state laws and regulations. In the event of an unauthorized discharge of wastes, we may be liable for penalties and costs.
The scope of waters subject to federal jurisdiction has been subject to substantial controversy. In 2015 and 2020, respectively, the Obama and Trump Administrations each published final rules attempting to define the federal jurisdictional reach over waters of the United States (“WOTUS”). However, both of these rulemakings were subject to legal challenge. In January 2023, the EPA and the Corps published a final rule based on the pre-2015 definition of WOTUS, with updates to incorporate existing Supreme Court decisions and regulatory guidance. However, the January 2023 rule was challenged and is currently enjoined in 27 states. In May 2023, the U.S. Supreme Court released its opinion in Sackett v. EPA, which involved issues relating to the legal tests used to determine whether wetlands qualify as WOTUS. The Sackett decision invalidated certain parts of the January 2023 rule and significantly narrowed its scope, resulting in a revised rule being issued in September 2023. However, due to the injunction on the January 2023 rule, the implementation of the September 2023 rule currently varies by state. In the 27 states subject to the injunction, the agencies are interpreting the definition of WOTUS consistent with the pre-2015 regulatory regime and the changes made by the Sackett decision, which utilizes the “continuous surface connection” test to determine if wetlands qualify as WOTUS. In the remaining 23 states, the agencies are implementing the September 2023 rule, which did not define the term “continuous surface connection.” Therefore, some uncertainty remains as to how broadly the September 2023 rule and the Sackett decision will be interpreted by the agencies. To the extent the implementation of the final rule, results of the litigation or any action further expands the scope of the CWA’s jurisdiction in areas where we operate, we could face increased costs and delays with respect to obtaining permits for dredge and fill activities in wetland areas.
Additionally, the process for obtaining permits has the potential to delay our operations. Spill prevention, control and countermeasure requirements of federal laws require appropriate containment berms and similar structures to help prevent the contamination of navigable waters by a petroleum hydrocarbon tank spill, rupture or leak. In addition, the CWA and analogous state laws require individual permits or coverage under general permits for discharges of storm water runoff from certain types of facilities. Federal and state regulatory agencies can impose administrative, civil and criminal penalties as well as other enforcement mechanisms for non-compliance with discharge permits or other requirements of the CWA and analogous state laws and regulations. The CWA and analogous state laws provide for administrative, civil and criminal penalties for unauthorized discharges and, impose rigorous requirements for spill prevention and response planning, as well as substantial potential liability for the costs of removal, remediation, and damages in connection with any unauthorized discharges.
13
Hydraulic Fracturing
We supply proppant to the oil and natural gas industry. Hydraulic fracturing is an important common practice that is used to stimulate production of oil and natural gas from low permeability hydrocarbon bearing subsurface rock formations. The hydraulic fracturing process involves the injection of water, proppant and chemicals under pressure into the formation to fracture the surrounding rock, increase permeability and stimulate production. Although we do not directly engage in hydraulic fracturing activities, our customers purchase our proppant for use in their hydraulic fracturing activities. Hydraulic fracturing is typically regulated by state oil and natural gas commissions and similar agencies; however, the EPA has asserted jurisdiction over hydraulic fracturing activities in some circumstances. Separately, the EPA released a final report in December 2016 assessing the potential adverse impact of hydraulic fracturing to water resources, concluding that activities relating to water consumption, use and disposal associated with hydraulic fracturing may impact drinking water resources under certain circumstances. To date, EPA has taken no further action in response to the December 2016 report. Some states have adopted, and other states are considering adopting, regulations that could impose new or more stringent permitting, disclosure or well construction requirements on hydraulic fracturing operations. State and federal regulatory agencies have also recently focused on a possible connection between the operation of injection wells used for oil and natural gas waste disposal and seismic activity. Similar concerns have been raised that hydraulic fracturing may also contribute to seismic activity. Aside from state laws, local land use restrictions may restrict drilling in general or hydraulic fracturing in particular. Municipalities may adopt local ordinances attempting to prohibit hydraulic fracturing altogether or, at a minimum, allow such fracturing processes within their jurisdictions to proceed but regulating the time, place and manner of those processes. At the same time, certain environmental groups have suggested that additional laws may be needed to more closely and uniformly limit or otherwise regulate the hydraulic fracturing process, and legislation has been proposed by some members of Congress to provide for such regulation.
The adoption of new laws or regulations at the federal or state levels imposing reporting obligations on, or otherwise limiting or delaying, the hydraulic fracturing process could make it more difficult to complete natural gas wells, increase our customers’ costs of compliance and doing business and otherwise adversely affect the hydraulic fracturing services they perform, which could negatively impact demand for our proppant. In addition, heightened political, regulatory and public scrutiny of hydraulic fracturing practices could expose us or our customers to increased legal and regulatory proceedings, which could be time-consuming, costly or result in substantial legal liability or significant reputational harm. We could be directly affected by adverse litigation involving us, or indirectly affected if the cost of compliance limits the ability of our customers to operate. Such costs and scrutiny could directly or indirectly, through reduced demand for our proppant, have an adverse effect on our business, financial condition and results of operations.
Non-Hazardous and Hazardous Wastes
The Resource Conservation and Recovery Act (“RCRA”) and comparable state laws control the management and disposal of hazardous and non-hazardous waste. These laws and regulations govern the generation, storage, treatment, transfer and disposal of wastes that we generate. In the course of our operations, we generate waste that are regulated as non-hazardous wastes and hazardous wastes, obligating us to comply with applicable standards relating to the management and disposal of such wastes. In addition, drilling fluids, produced waters and most of the other wastes associated with the exploration, development and production of oil or natural gas, if properly handled, are currently exempt from regulation as hazardous waste under RCRA and, instead, are regulated under RCRA’s less stringent non-hazardous waste provisions, state laws or other federal laws. However, it is possible that certain oil and natural gas drilling and production wastes now classified as non-hazardous could be classified as hazardous wastes in the future. A loss of the RCRA exclusion for drilling fluids, produced waters and related wastes could result in an increase in our customers’ costs to manage and dispose of generated wastes and a corresponding decrease in their drilling operations, which developments could have an adverse effect on our business.
Site Remediation
The Comprehensive Environmental Response, Compensation and Liability Act (“CERCLA”) and comparable state laws impose strict, joint and several liability on certain classes of persons that contributed to the release of a hazardous substance into the environment without regard to fault or the legality of the original conduct. These persons include the owner and operator of a disposal site where a hazardous substance release occurred and any company that transported, disposed of or arranged for the transport or disposal of hazardous substances released at the site. Under CERCLA, such persons may be liable for the costs of remediating the hazardous substances that have been released into the environment, for damages to natural resources and for the costs of certain health studies. In addition, where contamination may be present, it is not uncommon for the neighboring landowners and other third parties to file claims for personal injury, property damage and recovery of response costs. We have not received notification that we may be potentially responsible for cleanup costs under CERCLA at any site.
14
Endangered Species
The ESA restricts activities that may affect endangered or threatened species or their habitats. Similar protections are offered to migratory birds under the Migratory Bird Treaty Act (“MBTA”) and analogous state laws. Compliance with these laws may require the implementation of avoidance or mitigation measures or time and place restrictions on certain operations during migration or breeding seasons. The listing of new species as endangered or threatened and the designation of such species’ habitat as critical under the ESA or related laws in areas where we or our customers operate, we or our customers may incur increased costs arising from required species protection measures or experience operational delays or limitations, either of which could adversely affect our and our customers operations or reduce demand for our services. For more information regarding risks associated with compliance with endangered species laws and regulations, including discussion of certain risks related to the DSL and lesser prairie chicken, please see our “Risk Factors—Risks Related to Environmental, Mining and Other Regulations—Restrictions on our operations and those of our customers intended to protect certain species of wildlife could have an adverse impact on our ability to expand some of our existing operations or limit our customers’ ability to develop new oil and natural gas wells.”
Mining and Workplace Safety
Our proppant production operations will be subject to mining safety regulation. Mine Safety and Health Administration (“MSHA”) is the primary regulatory organization governing proppant mining and processing. Accordingly, MSHA regulates quarries, surface mines, underground mines and the industrial mineral processing facilities associated with and located at quarries and mines. The mission of MSHA is to administer the provisions of the Federal Mine Safety and Health Act of 1977 and to enforce compliance with mandatory miner safety and health standards. As part of MSHA’s oversight, representatives perform at least two unannounced inspections annually for each above-ground facility. Failure to comply with MSHA’s regulations could result in the imposition of civil or criminal penalties and fines.
In addition, our operations are subject to a number of federal and state laws and regulations, including the OSHA and comparable state statutes, whose purpose is to protect the health and safety of workers. Also, OSHA hazard communication standard, the EPA community right-to-know regulations under Title III of the federal Superfund Amendment and Reauthorization Act and comparable state statutes require that information be maintained concerning hazardous materials used or produced in operations and that this information be provided to employees, state and local government authorities and citizens. Violations of OSHA can result in OSHA civil and criminal enforcement. Moreover, the inhalation of respirable crystalline silica is associated with the lung disease silicosis. There is recent evidence of an association between crystalline silica exposure or silicosis and lung cancer and a possible association with other diseases, including immune system disorders such as scleroderma. These health risks have been, and may continue to be, a significant issue confronting the silica industry. In response to these potential concerns, OSHA promulgated a new rule seeking to lower work exposure to crystalline silica. The rule became effective for general industry in 2018. In June 2022, MSHA launched a new enforcement initiative to better protect U.S. miners from health hazards resulting from repeated overexposure to respirable crystalline silica. For more information, please see our “Risk Factors—Risks Related to Environmental, Mining and Other Regulations— Silica-related health issues and legislation, including compliance with existing or future regulations relating to respirable crystalline silica, or litigation could have an adverse effect on our business, reputation or results of operations.”
In addition, concerns over silicosis and other potential adverse health effects, as well as concerns regarding potential liability from the use of silica, may have the effect of discouraging our customers’ use of our silica products and discouraging our insurers from risk. The actual or perceived health risks of mining, processing and handling silica could adversely affect silica producers, including us, through reduced use of silica products, the threat of product liability or employee lawsuits, increased scrutiny by federal, state and local regulatory authorities of us and our customers or reduced financing sources available to the silica industry.
Environmental Reviews
If permits or other authorizations from the federal government are required, our future operations may be subject to broad environmental review under the National Environmental Policy Act, as amended (“NEPA”). NEPA requires federal agencies to evaluate the environmental impact of all “major federal actions” significantly affecting the quality of the human environment. The granting of a federal permit for a major development project, such as a proppant production operations, may be considered a “major federal action” that requires review under NEPA. As part of this evaluation, the federal agency considers a broad array of environmental impacts, including, among other things, impacts on air quality, water quality, wildlife (including threatened and endangered species), historic and archeological resources, geology, socioeconomics and aesthetics. NEPA also requires the consideration of alternatives to the project. The NEPA review process, especially the preparation of a full environmental impact statement, can be time consuming and expensive. The purpose of the NEPA review process is to inform federal agencies’ decision-making on whether federal approval should be granted for a project and to provide the public with an opportunity to comment on the environmental impacts of a proposed project. Though NEPA requires only that an environmental evaluation be conducted and does not mandate a particular result, a federal agency could decide to deny a permit or impose certain conditions on its approval, based on its environmental review under NEPA, or a third party could challenge the adequacy of a NEPA review and thereby delay the issuance of a federal permit or approval, which could have an adverse effect on our business. For more information, please see “Risk Factors—Risks Related to Environmental, Mining and Other Regulations—Any restrictions on oil and natural gas development on federal lands have the potential to adversely impact our operations and the operations of our customers.”
15
Motor Carrier Operations
Among the services we provide, we operate as a motor carrier and therefore are subject to regulation by the DOT and various state agencies. These regulatory authorities exercise broad powers, governing activities such as the authorization to engage in motor carrier operations; regulatory safety; hazardous materials labeling, placarding and marking; financial reporting; and certain mergers, consolidations and acquisitions. There are additional regulations specifically relating to the trucking industry, including testing and specification of equipment and product handling requirements. The trucking industry is subject to possible regulatory and legislative changes that may affect the economics of the industry by requiring changes in operating practices or by changing the demand for common or contract carrier services or the cost of providing truckload services. Some of these possible changes include increasingly stringent environmental regulations, changes in the hours of service regulations which govern the amount of time a driver may drive in any specific period and requiring onboard black box recorder devices or limits on vehicle weight and size.
Interstate motor carrier operations are subject to safety requirements prescribed by the DOT. Intrastate motor carrier operations are subject to safety regulations that often mirror federal regulations. Such matters as weight and dimension of equipment are also subject to federal and state regulations. The DOT regulations also mandate drug testing of drivers. From time to time, various legislative proposals are introduced, including proposals to increase federal, state or local taxes, including taxes on motor fuels, which may increase our costs or adversely impact the recruitment of drivers. We cannot predict whether, or in what form, any increase in such taxes applicable to us will be enacted.
State and Local Regulation
We are subject to a variety of state and local environmental review and permitting requirements. In some cases, the state environmental review may be more stringent than the federal review. Our operations may require state-law based permits in addition to federal permits, requiring state agencies to consider a range of issues, many the same as federal agencies, including, among other things, a project’s impact on wildlife and their habitats, historic and archaeological sites, aesthetics, agricultural operations and scenic areas. The development of new sites and our existing operations also are subject to a variety of local environmental and regulatory requirements, including land use, zoning, building and transportation requirements.
Demand for proppant in the oil and natural gas industry drove a significant increase in the production of proppant. As a result, some local communities expressed concern regarding silica sand mining operations. These concerns have generally included exposure to ambient silica sand dust, truck traffic, water usage and blasting. In response, certain state and local communities have developed or are in the process of developing regulations or zoning restrictions intended to minimize dust from becoming airborne, control the flow of truck traffic, significantly curtail the amount of practicable area for proppant production activities, provide compensation to local residents for potential impacts of proppant production activities and, in some cases, ban issuance of new permits for proppant production activities. To date, we have not experienced any material impact to the development of our proppant production facilities and do not anticipate an impact on future operations as a result of these types of concerns. We would expect this trend to continue as oil and natural gas production increases.
Competition
The market in which we operate is highly competitive. We compete with both public and private large, national producers and small, regional or local in-basin proppant providers, such as Covia Corp., High Roller Sand, Black Mountain Sand, Freedom Proppants, Hi-Crush, U.S. Silica Inc., Alpine Silica, Badger Mining Corporation, Vista Proppants and Logistics and Capital Sand Company, among others. Competition in the proppant production industry is based on a number of factors, including product and service quality, reliability of the service provider, the geographic location of facilities and the associated logistics costs of transporting proppant from the supplier to the customer, innovation, etc.
Human Capital and Employees
Our employees are a critical asset to our innovative culture and overall success. We are focused on sustaining a high-performance culture through attracting, engaging, developing, retaining and rewarding top talent. We strive to enhance the economic and social wellbeing of our employees and the communities in which we operate. We seek to provide a welcoming, inclusive environment for our workforce, with best-in-class training and career development opportunities to enable employees to thrive and achieve their career goals.
As of December 31, 2023, we had a total of 490 employees, of which 111 service our corporate headquarters and 379 work in field locations. None of our employees are represented by labor unions or subject to collective bargaining agreements. We consider our employee relations to be good.
16
Health and Safety
The health, safety, and wellbeing of our employees is of the utmost importance. We believe that we are an industry leader with a proven track record in safety.
We provide employees the option to participate in health and welfare plans, including medical, dental, life, accidental death and dismemberment and short-term and long-term disability insurance plans. We also offer a number of health and wellness programs, including telemedicine, health screens and fitness reimbursement as well as access to the Employee Assistance Program which provides employees and their family members access to professional providers to help navigate challenging life events 24 hours a day, 365 days a year.
Available Information
Our headquarters office is located at 5918 W. Courtyard Dr., Suite 500, Austin, TX 78730, and our telephone number at that address is (512) 220‑1200. Our website address is https://atlas.energy. Our periodic reports and other information filed with or furnished to the SEC, including our Annual Reports on Form 10-K, Quarterly Reports on Form 10-Q and Current Reports on Form 8-K, as well as any amendments to such filings, are available free of charge through our website under the “Investors” link as soon as reasonably practicable after those reports and other information are electronically filed with or furnished to the SEC. The SEC also maintains an internet website at www.sec.gov that contains reports, proxy and information statements and other information regarding issuers, including us, that file electronically with the SEC. In addition to its reports filed or furnished with the SEC, the Company publicly discloses material information from time to time in its press releases, at annual meetings of shareholders, in publicly accessible conferences and Investor presentations, and through its website (principally in its Press Room and Investor Relations pages). Information on our website or any other website is not incorporated by reference into this Annual Report and does not constitute a part of this Annual Report.
17
Item 1A. Risk Factors.
There are numerous factors that affect our business and operating results, many of which are beyond our control. The following is a summary of significant factors that might cause our future results to differ materially from those currently expected. The risks described below are not the only risks facing our Company. Additional risks and uncertainties not presently known to us or that we currently deem immaterial may also affect our business operations. If any of these risks actually occur, our business, financial position, operating results, cash flows, reserves or our ability to pay our debts and other liabilities could suffer, the trading price and liquidity of our securities could decline and you may lose all or part of your investment in our securities.
Risks Related to Our Business and Operations
Our proppant production and logistics operations depend on the level of activity in the oil and natural gas industries, which experience substantial volatility.
Our operations that produce and transport proppant are materially dependent on the levels of activity in oil and natural gas exploration, development and production. More specifically, the demand for the proppant we produce is closely related to the number of oil and natural gas wells completed in geological formations where sand-based proppant is used in fracture treatments. These activity levels are affected by both short- and long-term trends in oil and natural gas prices. In recent years, oil and natural gas prices and, therefore, the level of exploration, development and production activity, have experienced significant volatility.
When oil and natural gas prices decrease, exploration and production companies may reduce their exploration, development, production and well completion activities. During such periods, demand for our products and services, which supply oil and natural gas wells, including our transportation and logistics solutions, may decline, and may lead to a decline in the market price of proppant, if the supply of proppant is not similarly reduced. When demand for proppant increases, there may not be a corresponding increase in the prices for our products or our customers may not increase use of our products, which could have an adverse effect on our business, financial condition and results of operations.
Worldwide economic, political and military events, including war, terrorist activity, events in the Middle East and initiatives by OPEC+, have contributed, and are likely to continue to contribute, to oil and natural gas price volatility. For example, the ongoing armed conflicts between Russia and Ukraine and Israel and Hamas and the continuation of, and the escalation in the severity of, these conflicts has led to extreme regional instability, caused dramatic fluctuations in global financial markets and has increased the level of global economic uncertainty, including uncertainty about world-wide oil supply and demand, which in turn has caused increased volatility in commodity prices. Further, the Houthi movement, which controls parts of Yemen, has targeted and launched numerous attacks on Israeli, American and international commercial marine vessels in the Red Sea as the ships approach the Suez Canal, resulting in many shipping companies re-routing to avoid the region altogether and worsening existing supply chain issues, including delays in supplier deliveries, extended lead times and increased cost of freight, impacts to the shipping of oil and gas, insurance and materials. The potential for conflict with Iran, a major oil producer, the Houthi movement in Yemen or the Hezbollah movement in Lebanon has increased as a result of continued, increasing hostilities in the Middle East.
Additionally, warmer than normal winters in North America and other weather patterns may adversely impact the short-term demand for natural gas and, therefore, demand for our products. Reduction in demand for natural gas to generate electricity could also adversely impact the demand for proppant. In addition, any future decrease in the rate at which oil and natural gas reserves are discovered or developed, whether due to increased governmental regulation, limitations on exploration and drilling activity, technological innovations that result in new processes for oil and natural gas production that do not require proppant or other factors, could adversely affect the demand for our products, even in a stronger oil and natural gas price environment. Moreover, the energy transition to a low carbon economy, increased deployment of renewable power generation, renewable fuels and electric vehicles all have the potential to reduce demand for oil and natural gas and consequently the services we provide. The continued or future occurrence of any of these risks could have an adverse effect on our business, financial condition and results of operations.
Our business is subject to the cyclical nature of our customers’ businesses and on the oil and natural gas industry.
Our business is directly affected by capital spending to explore for, develop and produce oil and natural gas in the United States. The oil and natural gas industry is cyclical and historically has experienced periodic downturns in activity. During periods of economic slowdown in one or more of the industries or geographic regions we serve or in the worldwide economy, our customers often reduce their production and capital expenditures by deferring or canceling pending projects, even if such customers are not experiencing financial difficulties. These developments can have an adverse effect on sales of our products and our results of operations.
Weakness in the industries we serve has had, and may in the future have, an adverse effect on our sales and results of operations. A continued or renewed economic downturn in one or more of the industries that we serve, or in the worldwide economy, could cause actual results of operations to differ materially from historical and expected results.
Industry conditions are influenced by numerous factors over which we have no control, including:
18
Decreased demand for proppant or the development of technically- and cost-effective alternative proppants or new processes to replace hydraulic fracturing would negatively impact our business.
Frac sand is the most commonly used proppant in the completion and re-completion of oil and natural gas wells through hydraulic fracturing. A significant shift in demand from frac sand to other proppants, such as ceramic proppant, the development and use of other effective alternative proppants, or the development of new processes to replace hydraulic fracturing altogether, could cause a decline in demand for frac sand that we produce and would have an adverse effect on our business, financial condition and results of operations.
In addition, fuel conservation measures, alternative fuel requirements and increasing consumer demand for alternatives to oil and natural gas could reduce demand for oil and natural gas. The impact of the reduced demand for oil and natural gas may have an adverse effect on our business, financial condition, prospects, results of operations and cash flows. Additionally, the increased competitiveness of alternative energy sources (such as wind, solar, geothermal, tidal and biofuels) could reduce demand for oil and natural gas and therefore for our products and services, which would lead to a reduction in our revenues and negatively impact our business, financial condition and results of operations.
Our future performance will depend on our ability to succeed in competitive markets and on our ability to appropriately react to potential fluctuations in demand for, and supply of, our products and services.
We operate in a highly competitive market that is characterized by a small number of large, national producers and a larger number of small, regional or local producers. Transportation costs are a significant portion of the total cost to customers of proppant (in many instances, transportation costs can represent more than 50% of delivered cost), the proppant market is typically local, and competition from beyond the local area is limited. Further, competition in the industry is based on customer relationships, reliability of supply, consistency and quality of product, customer service, site location, distribution capability, breadth of product offering, technical support and price.
Some of our competitors may have or may develop greater financial, natural and other resources than we have. Periodically, some of our competitors may reduce the pricing that they offer to our customers for a variety of reasons. One or more of our competitors may develop technology superior to ours or may have production facilities located in closer proximity to certain customer locations than we do. For example, mobile mines may be able to mine resources in close proximity to wells, enabling them to deliver sand with significantly lower transportation costs.
19
When the demand for hydraulic fracturing services decreases or the supply of proppant available in the market increases, prices in the proppant market can materially decrease. Our competitors may choose to consolidate, which could provide them with greater financial and other resources than we have and improve their competitive positioning. Furthermore, oil and natural gas exploration and production companies and other providers of hydraulic fracturing services have acquired, and in the future may acquire, their own proppant reserves to fulfill their proppant requirements, and these other market participants may expand their existing proppant production capacity, all of which would negatively impact demand for our proppant. In addition, increased competition in the proppant industry could have an adverse impact on our ability to enter into long-term contracts or to enter into contracts on favorable terms.
Past performance by members of our management team, our directors or their respective affiliates may not be indicative of our future performance or an investment in us.
Information regarding performance by, or businesses associated with, our management team, our directors and their affiliates is presented for informational purposes only. Past performance of our management team, our directors and their affiliates is not a guarantee of our future success or similar results. You should not rely on the historical record of the performance of our management team, our directors or their affiliates as being indicative of the future performance of an investment in us or the returns we will, or are likely to, generate going forward.
Increasing costs, a lack of dependability or availability of transportation services or infrastructure or an oversupply of transportation services could have an adverse effect on our business, financial condition and results of operations.
The transportation industry is subject to possible legislative and regulatory changes that may affect the economics of the industry by requiring changes in operating practices or by changing the demand or the cost of providing truckload services.
Transportation and related costs tend to be a significant component of the total delivered cost to our customers purchasing our proppant. The high relative cost of transportation related expense tends to favor manufacturers located in close proximity to the customer. Additionally, increases in the price of transportation costs, including freight charges, fuel surcharges and demurrage costs, could negatively impact operating costs if we are unable to pass those increased costs along to our customers. Failure to find long-term solutions to these logistical challenges could adversely affect our ability to respond quickly to the needs of our customers or result in additional increased costs, and thus could negatively impact our business, results of operations and financial condition.
Our operations are subject to operational hazards and inherent risks, some of which are beyond our control, and some of which may not be fully covered by insurance.
Our business and operations may be affected by natural or man-made disasters and other external events, many of which are not in our control. In addition to the other risks described in these risk factors, risks include:
These hazards can also cause personal injury and loss of life, severe damage to and destruction of property and equipment, pollution or environmental damage and suspension or cancellation of operations. Any prolonged downtime or shutdowns at our mining properties or production facilities could have an adverse effect on our business, financial condition and results of operations. In addition, our operations are subject to, and exposed to, employee/employer liabilities and risks such as wrongful termination, discrimination, labor organizing, retaliation claims and general human resource related matters.
Not all of these risks are reasonably insurable, and our insurance coverage contains limits, deductibles, exclusions and endorsements. Our insurance coverage may not be sufficient to meet our needs in the event of loss and any such loss may have an adverse effect on our business, financial condition and results of operations.
20
Our ability to produce our products economically and in commercial quantities could be impaired if we are unable to acquire adequate supplies of water for our dredging operations.
The dredging process that we currently employ to produce from our Kermit, Texas and Monahans, Texas proppant production and processing facilities requires significant quantities of water from the aquifer underlying our acreage. If in the future there is insufficient capacity available from this aquifer to provide a source of water for our dredging and associated processes as a result of drought or similar conditions affecting the environment, we will be required to obtain water from other sources that may not be readily available, or may be too costly, and we may be unable to continue our dredge mining operations entirely. The effects of climate change may also further exacerbate water scarcity in certain regions, including at the aquifer on our acreage. If an environmental, weather or other event were to require us to discontinue dredging and resume operations using traditional proppant production processes, this could impair our cost of operations and ability to economically produce our product and would have an adverse effect on our financial condition, results of operations and cash flows.
Failure to maintain effective quality control systems at our mining and production facilities could have an adverse effect on our business, financial condition and operations.
The quality and safety of our products are critical to the success of our business. These factors depend significantly on the effectiveness of our quality control systems, which, in turn, depend on a number of factors, including the design of our quality control systems, our quality-training program and our ability to ensure that our employees adhere to the quality control policies and guidelines. Any significant failure or deterioration of our quality control systems could have an adverse effect on our business, financial condition, results of operations and reputation.
Given the nature of our proppant production operations, we face a material risk of liability, delays and increased cash costs of production from environmental and industrial accidents and operational breakdowns.
Our business involves significant risks and hazards, including environmental hazards, industrial accidents and breakdowns of equipment and machinery. Our electric dredge mining operations are subject to delays and accidents associated with electrical supply, repositioning and maintenance. Furthermore, during operational breakdowns, the relevant facility may not be fully operational within the anticipated timeframe, which could result in further business losses. The occurrence of any of these or other hazards could delay production, suspend operations, increase repair, maintenance or medical costs and, due to the integration of our facilities, could have an adverse effect on the productivity and profitability of a particular facility or on our business as a whole. Although insurance policies provide limited coverage for these risks, such policies will not fully cover some of these risks.
The development of the Dune Express is a complex and challenging process that may take longer and cost more than estimated, or not be completed at all. In addition, successful development and operation of the Dune Express will depend on certain factors that may be outside of our control, and the storage and transportation capacity or other anticipated benefits of our Dune Express may not be achieved.
We may encounter adverse geological conditions, regulatory procedures or other legal requirements that could impede the construction or operation of the Dune Express. The inability to obtain any permits and other federal, state or local approvals that may be required, and any excessive delays in obtaining such permits and approvals due, for example, to litigation or third-party appeals, could potentially prevent us from successfully constructing and operating the Dune Express in a timely manner.
We engage qualified construction firms to perform work associated with the construction of the Dune Express. However, if such firms experience delays, if they perform sub-standard work or if we fail to properly monitor the quality of their work or the timeliness of their progress, we may not be able to complete construction or begin operation of the Dune Express by the date or at the cost currently estimated. In any such circumstance, we could also face difficulties meeting certain delivery obligations to our customers or incur additional costs in making such deliveries by truck or other alternative means. Any material delay caused by our construction firms and subcontractors could therefore ultimately impact our ability achieve the anticipated benefits of the Dune Express and its integrated mining facilities and have an adverse effect on our business, financial condition and results of operations.
Operation of the Dune Express will depend on transmission and distribution facilities. If transmission to the Dune Express or any of its integrated mining facilities were to be interrupted physically, mechanically or with cyber means, it may hinder our ability to mine, sell or deliver proppant to our customers, satisfy our contractual obligations or otherwise operate or fully realize the expected benefits of the Dune Express.
21
Increased stakeholder and market attention to ESG and conservation matters may adversely impact our business and access to capital.
Businesses across all industries face scrutiny from stakeholders related to their ESG approach and practices. Businesses that are perceived to be operating in contrast to investor or stakeholder expectations and standards, which are continuing to evolve, or businesses that are perceived to have not responded appropriately to the growing concern for ESG issues, regardless of whether there is a legal requirement to do so, may suffer from reputational damage and the business, financial condition, access to capital, and/or stock price of such business entity could be materially and adversely affected. Increasing societal, investor, regulator, and stakeholder attention to climate change, natural capital, and other ESG matters along with changes in consumer demand for alternative sources of energy may result in increased costs (including but not limited to increased costs related to compliance, stakeholder engagement, contracting, and insurance) and reduced demand for our customers’ hydrocarbon products and our products and services. Increasing investor, lender, and societal expectations regarding voluntary ESG-related disclosures and trends towards mandatory ESG-related disclosures could result in increased costs, heightened regulatory, judicial, and legislative scrutiny, governmental investigations, and litigation. From time to time, we may also be subject to ESG-specific activist campaigns as stockholders may attempt to effect changes to our business or governance practices.
In addition, organizations that provide information to investors on corporate governance and related matters have developed ratings processes for evaluating companies on their approach to ESG matters. Such ratings are used by some investors to inform their investment and voting decisions. Accordingly, we may receive pressure from investors, lenders or other groups to adopt climate or other ESG-related goals or participate in various voluntary frameworks or certification programs intended to improve our ESG profile. A failure or a perception (whether valid or not) of failure to implement ESG strategies or adopt ESG goals or commitments, including any voluntary GHG emission reduction or carbon intensity goals or commitments, could result in private litigation or reputational damage, cause investors or customers to lose confidence in us, harm our ability to effectively recruit or retain employees and negatively impact our operations and goodwill, all of which may adversely affect our financial performance. Moreover, even if we voluntarily elect to pursue climate or ESG goals, we cannot guarantee that we will be able to implement such goals because of potential costs, technical or operational obstacles, uncertainty in long-term assumptions and expectations or other market or technological developments beyond our control. Similarly, we cannot guarantee that participation in any sustainability, climate-related, or ESG certification program or framework will have the intended results on our ESG profile.
Separately, some members of the investment community have increased their focus on the ESG practices and disclosures of public companies, including practices and disclosures related to climate change and sustainability, diversity, equity, and inclusion, and heightened governance standards. Certain large institutional investors may also evaluate companies for ESG disclosure and performance prior to investing in our Company or including our Company’s stock in their investment products, and such evaluation criteria may not be made known to us. To the extent any of these large institutional investors choose not to invest in our Company on account of their evaluation of our ESG performance or a decision to allocate capital away from the fossil fuel production sector, we may lose investors, our cost of capital may increase, and our stock price may be negatively impacted.
Our business may suffer if we lose or are unable to attract and retain members of our workforce.
We depend to a large extent on the services of our senior management team and other key personnel. These employees have extensive experience and expertise in evaluating and analyzing industrial mineral properties, maximizing production from such properties, marketing industrial mineral production and developing and executing financing and hedging strategies.
Competition for management and key personnel is intense, and the pool of qualified candidates is limited. The loss of any of these individuals or the failure to attract additional personnel as needed could have an adverse effect on our operations and could lead to higher labor costs or the use of less-qualified personnel. In addition, if any of our executives or other key employees were to join a competitor or form a competing company, we could lose customers, suppliers, know-how and other personnel. Our operations also rely on skilled laborers using modern techniques and equipment to mine efficiently. We may be unable to train or attract the necessary number of skilled laborers to maintain our operating costs.
With respect to our trucking services, the industry periodically experiences a shortage of qualified drivers, particularly during periods of economic expansion, in which alternative employment opportunities are more plentiful and freight demand increases, or during periods of economic downturns, in which unemployment benefits might be extended. The trucking industry suffers from a high driver turnover rate, which requires us to continually recruit a substantial number of drivers to operate our equipment and could negatively affect our operations and expenses if we are unable to do so. Our success will be dependent on our ability to continue to attract, employ and retain highly skilled personnel at all levels of our operations.
A shortage of skilled labor together with rising labor costs in the excavation industry may further increase operating costs, which could adversely affect our business, results of operations and financial condition.
Efficient sand excavation using modern techniques and equipment requires skilled laborers, preferably with several years of experience and proficiency in multiple tasks, including processing of mined minerals. If there is a shortage of experienced labor in areas in which we operate, we may find it difficult to hire or train the necessary number of skilled laborers to perform our own operations, which could have an adverse impact on our business, results of operations and financial condition.
22
As a result of the volatility of the oilfield services industry and the demanding nature of the work, workers may choose to pursue employment in fields that offer a more desirable work environment at wage rates that are competitive. Increased competition for their services could result in a loss of available, skilled workers or at a price that is not as advantageous to our business, both of which could negatively affect our operating results. If we are unable to retain or meet the growing demand for skilled technical personnel, our operating results and our ability to execute our growth strategies may be adversely affected.
Inaccuracies in our estimates of sand reserves and resource deposits, or deficiencies in our title to those deposits, could result in our inability to mine the deposits or require us to pay higher than expected costs.
We base our sand reserve and resource estimates on engineering, economic and geological data assembled and analyzed by our mining engineers, which are reviewed periodically by outside firms. However, frac sand reserve estimates are by nature imprecise and depend to some extent on statistical inferences drawn from available drilling data, which may prove unreliable. There are numerous uncertainties inherent in estimating quantities and qualities of frac sand reserves and non-reserve frac sand deposits and costs to mine recoverable reserves, many of which are beyond our control and any of which could cause actual results to differ materially from our expectations. These uncertainties include:
In addition, title to, and the area of, mineral properties and water rights may also be disputed. Mineral properties sometimes contain claims or transfer histories that examiners cannot verify. A successful claim that we do not have title to one or more of our properties or lack appropriate water rights could cause us to lose any rights to explore, develop and extract any minerals on that property, without compensation for our prior expenditures relating to such property. Any inaccuracy in our estimates related to our mineral reserves and non-reserve mineral deposits, or our title to such deposits, could result in our inability to mine the deposits or require us to pay higher than expected costs.
Further, the SEC has adopted amendments to its disclosure rules (the “SEC Modernization Rules”) to modernize the mineral property disclosure requirements for issuers whose securities are registered with the SEC under the Exchange Act, which are codified in Regulation S-K subpart 1300. Under the SEC Modernization Rules, the historical property disclosure requirements for mining registrants included in SEC Industry Guide 7 have been replaced. As a result of the adoption of the SEC Modernization Rules, the SEC now recognizes estimates of “measured mineral resources,” “indicated mineral resources” and “inferred mineral resources.” However, compared to mineralization that has been characterized as reserves, mineralization described using these terms has a greater amount of uncertainty as to their existence and whether they can be mined legally or economically, and investors are therefore cautioned not to assume that any reported “measured mineral resources,” “indicated mineral resources” or “inferred mineral resources” are or will be economically or legally mineable.
All of our product sales are currently generated at three facilities. Any adverse developments at those facilities could have an adverse effect on our business, financial condition and results of operations.
All of our product sales are currently derived from our Kermit and Monahans facilities located in Winkler and Ward Counties in Texas. Any adverse development at these facilities due to catastrophic events or weather, adverse government regulatory impacts, transportation-related constraints or any other events that could cause us to curtail, suspend or terminate operations at any of our facilities, could result in our being unable to deliver our contracted volumes and related obligations. Although we maintain insurance coverage to cover a portion of these types of risks, there could be potential risks associated with our operations not covered by insurance. There also may be certain risks covered by insurance where the policy does not reimburse us for all of the costs related to such risks. Downtime or other delays or interruptions to our future operations that are not covered by insurance could have an adverse effect on our business, results of operations and financial condition. In addition, under our supply contracts, if we are unable to deliver contracted volumes, we may be required to pay liquidated damages that could have an adverse effect on our financial condition and results of operations.
23
Our operations consume large amounts of natural gas and electricity. An increase in the price or a significant interruption in the supply of these or any other energy sources could have an adverse effect on our business, financial condition and results of operations.
Natural gas and electricity costs represented approximately 2.1% and 0.7%, respectively, of our total product sales in the year ended December 31, 2023, and 3.4% and 0.7%, respectively, of our total product sales in the year ended December 31, 2022. Potential climate change regulations or carbon or emissions taxes could result in higher cost of production for energy, which may be passed on to us in whole or in part. A significant increase in the price of energy that is not recovered through an increase in the price of our products and services or covered through our hedging arrangements or an extended interruption in the supply of electricity or natural gas to our production facilities could have an adverse effect on our business, results of operations and financial condition.
A large portion of our sales is generated by our top 10 customers, and the loss of or a significant reduction in purchases by our largest customers could adversely affect our business, financial condition and results of operations.
Our 10 largest customers accounted for approximately 86.5% of total sales for the year ended December 31, 2023, and approximately 67.7% of total sales for the year ended December 31, 2022. Some of our customers have exited or could exit the business, or have been or could be acquired by other companies that purchase proppant solutions or logistics services we provide from other third-party providers. Our current customers also may seek to acquire proppant or logistics services from other providers that offer more competitive pricing or capture and develop their own sources of proppant solutions or logistics services. The loss of a customer or contract, or a reduction in the amount of proppant solutions or logistics services purchased by any customer, could have an adverse effect on our business, financial condition and results of operations. Further, as a result of market conditions, competition or other factors, these customers may not continue to purchase the same levels of our products in the future, if at all. Substantial reductions in purchased volumes across these customers could have an adverse effect on our business, financial condition and results of operations.
Upon the expiration of our current contracts, our customers may not continue to purchase the same levels of proppant solutions or logistics services due to a variety of reasons. In addition, we may choose to renegotiate our existing contracts on less favorable terms or at reduced volumes in order to preserve relationships with our customers. Any renegotiation of our contracts on less favorable terms, or inability to enter into new contracts on economically acceptable terms upon the expiration of our current contracts, could have an adverse effect on our business, financial condition and results of operations.
Our business and operations depend on our and our customers’ ability to obtain and maintain necessary permits.
We and our customers hold numerous governmental, environmental, mining and other permits and approvals authorizing operations at each of our facilities. Our future success depends on, among other things, our ability, and the ability of our customers, to obtain and maintain the necessary permits and licenses required to conduct operations. In order to obtain permits and renewals of permits in the future, we may be required to prepare and present data to governmental authorities pertaining to the impact that our activities may have on the environment. Compliance with these regulatory requirements is expensive and significantly lengthens the time needed to conduct operations. Additionally, obtaining or renewing required permits is sometimes delayed, conditioned or prevented due to community opposition, opposition from other parties, the location of existing or proposed third-party operations, or other factors beyond our control. The denial of a new or renewed permit essential to our operations, delays in obtaining such a permit or the imposition of conditions in order to acquire the permit could impair our ability to continue operations at the affected facilities, delay those operations, or involve significant unplanned costs, any of which could adversely affect our business, performance and financial condition.
Our supply agreements may preclude us from taking advantage of increasing prices for proppant or mitigating the effect of increased operational costs during the term of those contracts.
The supply agreements we have may negatively impact our results of operations. Our sales contracts require our customers to pay a specified price for a specified volume of proppant. Although some of our supply agreements provide for price adjustments based on various factors, such adjustments are generally calculated on a quarterly basis and do not adjust dollar-for-dollar with adjustments in spot market prices. As a result, in periods with increasing prices our sales will not keep pace with market prices.
Additionally, if our operational costs increase during the terms of our supply agreements, we will not be able to pass some of those increased costs to our customers. If we are unable to otherwise mitigate these increased operational costs, our net income could decline.
24
A proppant production facility closure entails substantial costs, and if we close any of our facilities sooner than anticipated, our results of operations may be adversely affected.
We base our assumptions regarding the life of our proppant production facilities on detailed studies that we perform from time to time, but our studies and assumptions do not always prove to be accurate. If we close any of our proppant production facilities sooner than expected, sales will decline unless we are able to increase production at any of our other proppant production facilities, which may not be possible. The closure of a proppant production facility may also involve significant fixed closure costs, including accelerated employment legacy costs, severance-related obligations and potentially advance employee notice obligations and attendant costs with respect to a plant closure or mass layoff, and potentially reclamation and other environmental costs and the costs of terminating long-term obligations, including energy contracts and equipment leases. We accrue for the estimated costs to retire the assets over the expected timing of settlement. If we were to reduce the estimated time to settlement, the fixed proppant production facilities closure costs could be applied to a shorter period of production, which would increase production costs per ton produced and could adversely affect our results of operations and financial condition.
In addition, some environmental laws such as CERCLA, impose strict, retroactive and joint and several liability for the remediation of releases of hazardous substances.
Certain of our contracts contain provisions requiring us to deliver minimum amounts of sand-based proppant. If we are unable to meet our minimum requirements under these contracts, we may be required to pay penalties or the contract counterparty may be able to terminate the agreement.
In certain instances, we commit to deliver products under penalty of nonperformance. We commit to deliver products to our customers prior to production, and we are obligated to deliver a minimum volume of sand-based proppant per year or per month under our supply agreements over their respective terms. Depending on the contract, our inability to deliver the requisite volume of sand-based proppant may permit our customers to terminate the agreement or require us to pay our customers a fee, the amount of which is generally calculated by multiplying the difference between the amount of volume contracted for and the amount delivered by a per-ton penalty specified in the contract. In such events, our results of operations may be adversely affected.
Currently, all of our operations are concentrated in the Permian Basin, making us vulnerable to risks associated with operating in a limited geographic area.
Currently, all of our operations are geographically concentrated in the Permian Basin. As a result, we may be disproportionately exposed to various factors, including, among others: (i) the impact of regional supply and demand factors, (ii) delays or interruptions of completion activity in such areas caused by governmental regulation, (iii) processing or transportation capacity constraints, (iv) market limitations, (v) availability of equipment and personnel or (vi) water shortages or other drought related conditions. This concentration in a limited geographic area also increases our exposure to changes in local laws and regulations, certain lease stipulations designed to protect wildlife and unexpected events that may occur in the regions such as natural disasters, seismic events, industrial accidents or labor difficulties. Any of the risks described above could have an adverse effect on our business, financial condition, results of operations and cash flow.
An increase in the supply of proppant having similar characteristics as the proppant we produce could make it more difficult for us to renew or replace our existing contracts on favorable terms, or at all.
If significant new reserves of proppant are discovered and developed and have similar characteristics to the proppant we produce, we may be unable to renew or replace our existing contracts on favorable terms, if at all. Specifically, if proppant is oversupplied, our customers may not be willing to enter into long-term take-or-pay contracts, may demand lower prices or both, which would have an adverse effect on our business, results of operations and financial condition. Similarly, the COVID-19 pandemic caused a historic slowdown in oil and natural gas activity, which led to an increase in available proppant supply relative to the reduced demand. The foregoing events have led to increased competition among our competitors, which could lead to pressure to further reduce prices to compete effectively.
Our results of operations are significantly affected by the market price of sand-based proppant, which have been historically subject to substantial price fluctuations.
Our results of operations and financial conditions are, and will continue to be, particularly sensitive to the long- and short-term changes in the market price of sand-based proppant. Among other factors, these prices also affect the value of our reserves and inventories, and could negatively impact the market price of our Common Stock.
Market prices are affected by numerous factors beyond our control, including, among others, demand for high quality sand-based proppant, the availability and relative cost of alternate sources of sand, drilling and completion activity in the Permian Basin, prevailing commodity prices and overall economic activity.
25
Additionally, when demand for sand-based proppant increases, there may not be a corresponding or immediate increase in the prices for our products or our customers may choose to opt for lower-quality, lower-priced products, which could have an adverse effect on our results of operations and financial condition. For example, our average price of product was approximately $20.59 per ton in 2019 compared to approximately $12.75 per ton in 2020 during the COVID-19 pandemic. As activity recovered during 2021, our average price was approximately $17.21 per ton. For the year ended December 31, 2023 and 2022, our average price was approximately $42.63 per ton and $40.10 per ton, respectively.
In addition, any future decreases in the rate at which oil and natural gas reserves are discovered or developed, whether due to increased governmental regulation, limitations on exploration and drilling activity, including hydraulic fracturing or other factors, could have an adverse effect on our business and financial condition, even in a stronger oil and natural gas price environment.
Our E&P customers’ operations are subject to operating risks that are often beyond our control and could have an adverse effect on our business, financial condition and results of operations.
In addition to the sand-based proppant that we supply, the operations of our E&P customers rely on several other products and services in order to perform hydraulic fracturing activities, such as skilled laborers and equipment required for pumping proppant, water and fluids into oil and natural gas wells. Any failure by our E&P customers to obtain these other products and services could have an adverse effect on our business, financial condition and results of operations.
There are complex software and technology systems that need to be developed in coordination with our technology partner in connection with our autonomous trucking initiative, and there can be no assurance such systems will be successfully developed or implemented for use in our planned applications or at all.
One of our long-term logistics development goals is to bring autonomous wellsite delivery of our proppant to the Permian Basin. Our planned autonomous proppant-delivery vehicles, when deployed, will use a substantial amount of third-party software codes and complex hardware to operate. The development of these advanced technologies is inherently complex, and we will need to coordinate with our technology partner in connection with the design, production and deployment of our autonomous proppant-delivery vehicles. Defects and errors may be revealed over time and our control over the performance of such third-party services and systems may be limited. Accordingly, our potential inability to successfully develop and implement the necessary software and technology systems may harm our competitive position.
The autonomous trucking technologies are emerging technologies that may not be commercially viable when used in our planned applications or at all. There can be no assurances that our technology partner will be able to meet the technological requirements, production timing and end-use specifications required to successfully implement our planned autonomous trucking initiative. Any material delays or cost increases may also make us unable to meet certain proppant-delivery obligations to our customers or incur additional costs in making such deliveries by traditional trucking methods or other alternative means, which could have an adverse effect on our business, financial condition and results of operations.
Our autonomous driving technology and related hardware and software, when deployed, could have undetected defects, errors or bugs in hardware or software, which could create safety or cybersecurity issues and could expose us to liability and other claims that could adversely affect our business.
Autonomous driving technology is highly technical and very complex, and has in the past and may in the future experience defects, errors or bugs at various stages of implementation. In the event of such defect, error or bug, we may incur significant additional development costs, repair or replacement costs, or more importantly, liability for personal injury or property damage caused by such errors or defects. Any insurance that we carry may not be sufficient or it may not apply to all situations that may arise in connection with the planned applications of our autonomous delivery vehicles. In accidents involving semi-trucks, most of the resulting fatalities are victims outside of the vehicle. If we experience such an event or multiple events, our insurance premiums could significantly increase or insurance may not be available to us at all. In addition, lawmakers or governmental agencies could pass laws or adopt regulations that limit the use of autonomous-trucking technology or increase liability associated with its use. Any of these events could adversely affect our reputation, relationships with our customers, financial condition and results of operations.
In addition, we could face material legal claims as a result of these problems. Any such lawsuit may cause irreparable damage to our brand and reputation. In addition, defending a lawsuit, regardless of its merit, could be costly and may divert management’s attention and adversely affect the market’s perception of us and our products and services. In addition, our business liability insurance coverage could prove inadequate with respect to a claim and future coverage may be unavailable to us on acceptable terms or at all. These product-related issues could result in claims against us and have an adverse effect on our business, financial condition and results of operations.
26
Any unauthorized control or manipulation of the information technology systems in our autonomous proppant-delivery vehicles could result in loss of customer confidence in us and the products and services we provide.
Our autonomous proppant-delivery vehicles, when deployed, will contain complex information technology systems and built-in data connectivity to log location data and accept and install periodic remote updates to improve or update their functionality or performance. Our technology partner expects to design, implement and test security measures intended to prevent unauthorized access to its and our information technology networks, the autonomous vehicle platforms it produces and related or connected systems. However, hackers may attempt to gain unauthorized access to modify, alter and use such networks, vehicles and systems to gain control of or to change our autonomous vehicles’ functionality, user interface and performance characteristics, or to gain access to data stored in or generated by our autonomous vehicles. Future vulnerabilities could be identified and manipulated and our or our technology partner’s efforts to remediate such vulnerabilities may not be successful. Any unauthorized access to or control of our autonomous proppant-delivery vehicles, or any loss of data, could result in legal claims or proceedings against us and remediation of such problems could result in significant, unplanned capital expenditures. In addition, regardless of their veracity, reports of unauthorized access to our autonomous proppant-delivery vehicles or our or our customers’ data, as well as other factors that may result in the perception that our autonomous proppant-delivery vehicles or data are capable of being “hacked,” could negatively affect our brand and harm our business, financial condition and results of operations.
Natural disasters and unusual weather conditions could disrupt business and result in operational delays and otherwise have an adverse effect on our business.
The occurrence of one or more natural disasters, such as tornadoes, hurricanes, tsunamis, fires, droughts, floods and earthquakes or unusual weather conditions or temperatures in the regions in which our facilities are located could result in delayed operations, repair costs or disruptions to our supply chains or similarly impact the operations of our customers. For example, in February 2021, Texas and New Mexico experienced record-setting cold temperatures from Winter Storm Uri. Proppant volumes were negatively impacted in February and March 2021 as the cold weather delayed completion schedules and pushed forecasted producer activity into the latter half of the year. Events such as this could have an adverse effect on our or our customers’ businesses and may become more frequent or intense as a result of climate change.
Our acquisitions, dispositions and investments may not result in anticipated benefits and may present risks not originally contemplated, which may have a material adverse effect on our liquidity, financial condition and results of operations.
We continually seek opportunities to maximize efficiency and value in our Company, which includes consideration of purchases or sales of assets, businesses, or investments. Such strategic transactions, among others, would be intended to (but may not) result in the realization of savings, the creation of efficiencies, the generation of cash or income, or the reduction of risk. Acquisition transactions may use cash on hand or be financed by additional borrowings or by the issuance of Common Stock. Such transactions could also affect our liquidity, financial condition and results of operations.
Such transactions would also involve risks, and we cannot ensure that:
Risks Related to Our Financial Condition
Our indebtedness could adversely affect our financial flexibility and our competitive position.
We have, and expect to maintain in the near term, a significant amount of indebtedness. On July 31, 2023, we entered into the 2023 Term Loan Credit Agreement, pursuant to which Stonebriar extended Atlas LLC a term loan credit facility comprised of a $180.0 million single advance term loan that was made on July 31, 2023 (the “Initial Term Loan”) and commitments to provide up to $100.0 million of delayed draw term loans.
27
The Initial Term Loan is payable in eighty-four consecutive monthly installments and a final payment of the remaining outstanding principal balance at maturity. The Initial Term Loan has a final maturity date of August 1, 2030. The Initial Term Loan bears interest at a rate equal to 9.50% per annum.
Proceeds from the 2023 Term Loan Credit Facility were used to repay outstanding indebtedness under our previous 2021 Term Loan Credit Facility, to repay obligations outstanding under certain equipment lease arrangements and for general corporate purposes.
Under our 2023 ABL Credit Facility, the lenders thereunder provide revolving credit financing to Atlas LLC in an aggregate principal amount of up to $75.0 million with availability thereunder subject to a borrowing base as described in the 2023 ABL Credit Agreement. As of December 31, 2023, we had no loans outstanding under the 2023 ABL Credit Facility and we were using $1.1 million for outstanding letters of credit, leaving $73.9 million of borrowing availability under our 2023 ABL Credit Facility.
Our debt agreements contain a number of significant covenants that may limit our ability to, among other things:
Our indebtedness could also have important consequences to you and significant effects on our business, including:
We may be unable to generate sufficient cash to service all of our indebtedness and financial commitments.
Our ability to make scheduled payments on or to refinance our indebtedness and financial commitments depends on our financial condition and operating performance, which are subject to prevailing economic and competitive conditions including financial, business and other factors beyond our control. We may be unable to generate sufficient cash flow to permit us to pay the principal, premium, if any, and interest on our indebtedness.
If our cash flows and capital resources are insufficient to fund debt and other obligations, we may be forced to reduce or delay capital expenditures, sell assets, seek additional capital or restructure our indebtedness. Our ability to restructure or refinance indebtedness will depend on the condition of the capital markets and our financial condition at such time. Any refinancing of indebtedness could be at higher interest rates and may require us to comply with more onerous covenants, which could further restrict our operations. The terms of existing or future debt instruments may restrict us from adopting some of these alternatives. In addition, any failure to service our debt would likely result in a reduction of our future credit rating, if any, which could harm our ability to incur additional indebtedness. If we face substantial liquidity problems, we might be required to sell assets to meet debt and other obligations. Our debt restricts our ability to dispose of assets and dictates our use of the proceeds from such disposition. We may not be able to consummate dispositions, and the proceeds of any such disposition may be inadequate to meet our obligations.
28
We may be unable to access adequate funding as a result of a decrease in the borrowing base under the 2023 ABL Credit Facility due to an unwillingness or inability on the part of lending counterparties to meet their funding obligations and the inability of other lenders to provide additional funding to cover a defaulting lender’s portion. As a result, we may be unable to execute our development plan, make acquisitions or otherwise conduct operations, which would have an adverse effect on our financial condition and results of operations.
Changes to applicable tax laws and regulations, exposure to additional income tax liabilities, changes in our effective tax rates or an assessment of taxes resulting from an examination of our income or other tax returns could adversely affect our results of operations and financial condition, including our ability to repay our debt.
We are subject to various complex and evolving U.S. federal, state and local taxes. U.S. federal, state and local tax laws, policies, statutes, rules, regulations or ordinances could be interpreted, changed, modified or applied adversely to us, in each case, possibly with retroactive effect, and may have an adverse effect on our results of operations and financial condition, including our ability to repay our debt. The passage of any tax legislation or other changes in U.S. federal income tax laws could adversely affect our results of operations and financial condition.
Changes in our effective tax rates or tax liabilities could also adversely affect our results of operations and financial condition. Our future effective tax rates could be subject to volatility or adversely affected by a number of factors, including:
In addition, an adverse outcome arising from an examination of our income or other tax returns could result in higher tax exposure, penalties, interest or other liabilities that could have an adverse effect on our results of operations and financial condition.
We will need substantial additional capital to operate our business, and the inability to obtain needed capital or financing, on satisfactory terms, or at all, whether due to restrictions in our 2023 ABL Credit Facility, 2023 Term Loan Credit Facility or otherwise, could have an adverse effect on our growth and profitability.
Our business plan requires a significant amount of capital expenditures to maintain and grow our production levels over the long term. Although we currently use a significant amount of our cash reserves and cash generated from our operations to fund the maintenance and development of our existing sand reserves, we may need to depend on external sources of capital to fund future capital expenditures if proppant prices were to decline for an extended period of time, if the costs of our operations were to increase substantially or if other events were to occur that reduce our sales or increase our costs. Our ability to obtain bank financing or to access the capital markets for future equity or debt offerings may be limited by our financial condition at the time of any such financing or offering, adverse market conditions or other contingencies and uncertainties that are beyond our control. Our failure to obtain the funds necessary to maintain, develop and increase our asset base could adversely impact our growth and profitability.
In addition, our existing 2023 ABL Credit Facility and 2023 Term Loan Credit Facility contain, and any future financing agreements we may enter into could also contain, operating and financial restrictions and covenants that may limit our ability to finance future operations or capital needs or to engage in, expand or pursue our business activities.
Our ability to comply with these restrictions and covenants is uncertain and will be affected by the levels of cash flow from our operations and events and circumstances beyond our control. If market or other economic conditions deteriorate, our ability to comply with these covenants may be impaired. If we violate any of the restrictions or covenants in our 2023 ABL Credit Facility and 2023 Term Loan Credit Facility, a significant portion of our indebtedness may become immediately due and payable and our lenders’ commitment to make further loans to us may terminate. We might not have, or be able to obtain, sufficient funds to make these accelerated payments. In addition, our obligations under our 2023 Term Loan Credit Facility are secured by substantially all of our assets, and if we are unable to repay our indebtedness or satisfy our other obligations under these, the lenders could seek to foreclose on our assets.
Even if we are able to maintain existing financing or access the capital markets, incurring additional debt may significantly increase our interest expense and financial leverage, and our indebtedness could restrict our ability to fund future development and acquisition activities. In addition, the issuance of any additional equity interests may result in significant dilution to the holders of our Common Stock.
29
We are subject to counterparty credit risk. Nonpayment or nonperformance by our customers, suppliers or vendors could have an adverse effect on our business, liquidity, financial condition and results of operations.
We are subject to the risk of loss resulting from nonpayment or nonperformance by our customers, suppliers and vendors. Our credit procedures and policies may not be adequate to fully eliminate customer credit risk. If we fail to adequately assess the creditworthiness of existing or future customers or unanticipated deterioration in their creditworthiness, any resulting increase in nonpayment or nonperformance by them and our inability to re-market or otherwise use the production could have an adverse effect on our business, results of operations and financial condition. A decline in oil and natural gas prices could negatively impact the financial condition of our customers and sustained lower prices could impact their ability to meet their financial obligations to us. Further, our contract counterparties may not perform or adhere to our existing or future contractual arrangements. To the extent one or more of our contract counterparties is in financial distress or commences bankruptcy proceedings, contracts with these counterparties may be subject to renegotiation or rejection under applicable provisions of the United States Bankruptcy Code. Any material nonpayment or nonperformance by our contract counterparties due to inability or unwillingness to perform or adhere to contractual arrangements could adversely affect our business and results of operations. If our customers delay or fail to pay us a significant amount of our outstanding receivables, it could have an adverse effect on our business, liquidity, financial condition and results of operations.
If we fail to comply with the restrictions and covenants in our debt agreements, there could be an event of default under the terms of such agreements, which could result in an acceleration of payment.
A breach of any representation, warranty or covenant in any of our debt agreements would result in a default under the applicable agreement after any applicable grace periods. A default could result in acceleration of the indebtedness, which would have an adverse effect on us. If an acceleration occurred, it would likely accelerate all of our indebtedness through cross-default provisions and we would likely be unable to make all of the required payments to refinance such indebtedness. Even if new financing were available at that time, it may not be on terms that are acceptable to us.
Any future indebtedness could adversely affect our financial condition.
We are, subject to the terms and conditions in the ABL Credit Agreement and availability under the borrowing base described therein, able to borrow up to $75.0 million under our 2023 ABL Credit Facility.
In addition, subject to the limits contained in our 2023 ABL Credit Facility and 2023 Term Loan Credit Facility, we may incur substantial additional debt from time to time. Any borrowings we may incur in the future would have several important consequences for our future operations, including that:
If we incur indebtedness in the future, we may have significant principal payments due at specified future dates under the documents governing such indebtedness. Our ability to meet such principal obligations will be dependent upon future performance, which in turn will be subject to general economic conditions, industry cycles and financial, business and other factors affecting our operations, many of which are beyond our control. Our business may not continue to generate sufficient cash flow from operations to repay any incurred indebtedness. If we are unable to generate sufficient cash flow from operations, we may be required to sell assets, to refinance all or a portion of such indebtedness or to obtain additional financing.
30
Risks Related to Our Organizational Structure and Ownership of the Common Stock
We may reduce or suspend our dividend in the future.
We have paid a quarterly dividend or distribution for many years, and commencing in the second quarter of 2023 we established base quarterly dividend of $0.15 per share and paid an additional variable dividend of $0.05 per share per quarter, amounting to a total dividend payment of $0.20 per share for each of the second and third quarters of 2023. For the fourth quarter of 2023, we increased the base dividend to $0.16 per share, amounting to a total dividend payment of $0.21 per share for the quarter. Despite establishing this base dividend in 2023, our Board has not yet adopted a dividend policy, and in the future, our Board may, without advance notice, determine to reduce or suspend our dividends in order to maintain our financial flexibility and best position the Company for long‑term success. The declaration and amount of future dividends is at the discretion of our Board and will depend on our financial condition, results of operations, cash flows, prospects, industry conditions, capital requirements and other factors and restrictions our Board deems relevant. The likelihood that dividends will be reduced or suspended is increased during periods of prolonged market weakness or uncertainty, such as the economic downturn that resulted from the COVID-19 pandemic and the oil price collapse in 2020. In addition, our ability to pay dividends may be limited by agreements governing our indebtedness now or in the future. Although we do not currently have plans to reduce or suspend our dividend, there can be no assurance that we will not reduce our dividend or that we will continue to pay a dividend in the future.
Our stock prices and trading volumes could be volatile, and you may not be able to resell shares of your Common Stock when desired, at or above the price you paid, or at all.
The stock market has experienced and continues to experience extreme price and volume fluctuations that have often been unrelated or disproportionate to the operating performance of the underlying businesses. Recently, market volatility has been high due to the ongoing conflicts between Ukraine and Russia, Israel and Hamas and other instability in the Middle East, including from the Houthi rebels in Yemen, interest rate increases, rising inflation, instability of the banking sector, a softening U.S. economy and other factors. Broad market fluctuations may adversely affect the market price of the Common Stock, regardless of our actual operating performance. In addition to the other risks described in this section, the market price of our Common Stock may fluctuate significantly in response to a number of factors, many of which we cannot control, including:
31
Volatility in the market price or trading volume of the Common Stock may make it difficult or impossible for you to sell your Common Stock at or above the price at which you purchased the stock. As a result, you may suffer a loss on your investment. Securities class action litigation has often been instituted against companies following periods of volatility in the overall market and in the market price of a company’s securities. This litigation, if instituted against us, could result in substantial costs, reduce our profits, divert our management’s attention and resources and harm our business.
Future sales of Common Stock in the public market, or the perception that such sales may occur, could reduce the trading price of the Common Stock, and any additional capital raised by us through the sale of equity or convertible securities may dilute your ownership in our Company.
We may sell additional shares of Common Stock in subsequent offerings. In addition, subject to certain limitations and exceptions, the Legacy Owners holding shares of Common Stock may sell those shares in the future. Certain Legacy Owners who own, in the aggregate, approximately 46% of the Common Stock, are party to the A&R Registration Rights Agreement, which includes provisions pursuant to which we have agreed, after the expiration of any applicable lock-up period, to register under the U.S. federal securities laws the offer and resale of shares of Common Stock by such Legacy Owners or certain of their respective affiliates or permitted transferees under the A&R Registration Rights Agreement.
We cannot predict with certainty the size of future issuances of Common Stock or the effect, if any, that future issuances and sales of shares of Common Stock will have on the market price of the Common Stock. Sales of substantial amounts of Common Stock (including shares issued in connection with an acquisition), or the perception that such sales could occur, may adversely affect prevailing market prices of the Common Stock.
Certain of the Principal Stockholders will have the ability to direct the voting of a significant proportion of the voting power of the Common Stock, and their interests may conflict with those of other stockholders.
In connection with the consummation of the Up-C Simplification, the Principal Stockholders entered into the A&R Stockholders’ Agreement with the Company. The Principal Stockholders collectively own approximately 45% of the Company’s voting stock. As a result, on a combined basis, the Principal Stockholders have considerable influence over matters requiring stockholder approval, including the election of directors, changes to our organizational documents and significant corporate transactions. This concentration of ownership makes it unlikely that any other holder or group of holders of Common Stock will be able to affect the way the Company is managed or the direction of its business. The interests of the Principal Stockholders with respect to matters potentially or actually involving or affecting the Company, such as future acquisitions, financings and other corporate opportunities and attempts to acquire the Company, may conflict with the interests of other stockholders. Given this significant concentrated ownership, the Principal Stockholders would likely have to approve any potential acquisition of the Company.
The A&R Stockholders’ Agreement provides Mr. Brigham (or his affiliates, as applicable) with the right to designate certain numbers of nominees to the Board and the right to approve certain actions by the Company, so long as the Principal Stockholders and their affiliates collectively beneficially own specified percentages of the outstanding shares of Common Stock. Additionally, the A&R Stockholders’ Agreement provides that the Principal Stockholders agree to cause their respective shares of Common Stock to be voted in favor of the election of each of the director nominees designated by Mr. Brigham.
Accordingly, Mr. Brigham has the ability to strongly influence the election of the members of the Board, and thereby its management and affairs. In addition, the Principal Stockholders are able to strongly influence the outcome of all matters requiring stockholder approval, including mergers and other material transactions. This ownership by the Principal Stockholders may also have the effect of deterring hostile takeovers, delaying or preventing changes in control or changes in management, or limiting the ability of other stockholders to approve transactions that they may deem to be in the best interests of the Company. Moreover, this ownership by the Principal Stockholders may also adversely affect the trading price of the Common Stock to the extent investors perceive a disadvantage in owning stock of a company with such concentrated ownership.
Certain of the Principal Stockholders and members of the Board are not limited in their ability to compete with the Company, and the corporate opportunity provisions in the Charter permit certain of the Principal Stockholders and members of the Board to benefit from corporate opportunities that might otherwise be available to us.
The Charter provides that the Principal Stockholders and any member of the Board who is not at the time an officer of the Company, or their respective affiliates are not restricted from owning assets or engaging in businesses that compete directly or indirectly with the Company and that the Company renounces any interest or expectancy in any business opportunity that may be from time to time presented to the Principal Stockholders and any member of the Board who is not at the time an officer of the Company, or their respective affiliates. In particular, subject to the limitations of applicable law, the Charter, among other things:
32
The Principal Stockholders or any member of the Board who is not at the time an officer of the Company, or their respective affiliates, may become aware, from time to time, of certain business opportunities (such as acquisition opportunities) and may direct such opportunities to other businesses in which they have invested, in which case the Company may not become aware of or otherwise have the ability to pursue such opportunity. Further, such businesses may choose to compete with the Company for these opportunities, possibly causing these opportunities to not be available to the Company or causing them to be more expensive for the Company to pursue. In addition, the Principal Stockholders and any member of the Board who is not at the time an officer of the Company, and their respective affiliates, may dispose of mining or other properties or other assets in the future, without any obligation to offer the Company the opportunity to purchase any of those assets. As a result, the Company’s renouncing of its interest and expectancy in any business opportunity that may be from time to time presented to the Principal Stockholders and any member of the Board who is not at the time an officer of the Company, and their respective affiliates, could adversely impact the Company’s business or prospects if attractive business opportunities are procured by such parties for their own benefit rather than for the Company’s.
Certain of the Principal Stockholders or their affiliates are established participants in the oil and natural gas industry and may have resources greater than ours, which may make it more difficult for the Company to compete with the Principal Stockholders or their affiliates with respect to commercial activities as well as for potential acquisitions. We cannot assure you that any conflicts that may arise between us and our stockholders, on the one hand, and the Principal Stockholders or their affiliates, on the other hand, will be resolved in our favor. As a result, potential competition from the Principal Stockholders or their affiliates could adversely impact our results of operations.
Anti-takeover provisions in our organizational documents might discourage or delay acquisition bids or merger proposals, which may adversely affect the market price of the Common Stock and limit the price investors might be willing to pay in the future for the Common Stock.
The Charter and Bylaws contain provisions that may discourage unsolicited takeover proposals that stockholders may consider to be in their best interests. These provisions:
These anti-takeover provisions could discourage, delay or prevent a transaction involving a change in control of the Company altogether, even if doing so would benefit our stockholders. These provisions could also discourage proxy contests and make it more difficult for our stockholders to elect directors of their choosing and to cause the Company to take other corporate actions our stockholders desire. Further, the A&R Stockholders’ Agreement, the staggered Board and the ability of the Board to designate the terms of and issue new series of preferred stock may make the removal of management more difficult and may discourage transactions that otherwise could involve payment of a premium over prevailing market prices for our securities.
33
The Charter designates the Court of Chancery of the State of Delaware and, to the extent enforceable, the federal district courts of the United States of America as the sole and exclusive forum for certain types of actions and proceedings that may be initiated by our stockholders, which could limit such stockholders’ ability to obtain a favorable judicial forum for disputes with the Company or our directors, officers, employees or agents.
The Charter provides that, unless the Company consents in writing to the selection of an alternative forum, the Court of Chancery of the State of Delaware (or, if the Court of Chancery of the State of Delaware does not have jurisdiction, the Superior Court of the State of Delaware, or, if the Superior Court of the State of Delaware does not have jurisdiction, the United States District Court for the District of Delaware, in each case, subject to that court having personal jurisdiction over the indispensable parties named defendants therein) will, to the fullest extent permitted by applicable law, be the sole and exclusive forum for any stockholder (including a beneficial owner) to bring (i) any derivative action or proceeding brought on the Company’s behalf, (ii) any action asserting a claim of breach of a fiduciary duty owed by any of the Company’s current or former directors, officers, employees or stockholders to the Company or its stockholders, (iii) any action asserting a claim arising pursuant to any provision of the DGCL, the Charter or the Bylaws (as either may be amended or restated), or as to which the DGCL confers jurisdiction to the Court of Chancery of the State of Delaware, the Charter or Bylaws, or (v) any other action asserting a claim against the Company that is governed by the internal affairs doctrine.
The Charter also provides that, unless the Company consents in writing to an alternate forum, to the fullest extent permitted by applicable law, the federal district courts of the United States will be the exclusive forum for resolving any complaint asserting a cause of action arising under the Securities Act. Notwithstanding the foregoing, the exclusive forum provision will not apply to suits brought to enforce any liability or duty created by the Exchange Act or any other claim for which the federal courts have exclusive jurisdiction. While the Delaware courts have determined that such choice of forum provisions are facially valid, a stockholder may nevertheless seek to bring a claim in a venue other than those designated in the exclusive forum provisions, and there can be no assurance that such provisions will be enforced by a court in those other jurisdictions. If a court were to find the exclusive-forum provisions contained in the Charter to be inapplicable or unenforceable in an action, the Company may incur additional costs associated with resolving such action in other jurisdictions, which could harm our business.
To the fullest extent permitted by law, any person or entity purchasing or otherwise acquiring any interest in shares of our capital stock will be deemed to have notice of, and consented to, the provisions of the Charter described in the preceding sentence. This choice of forum provision may limit a stockholder’s ability to bring a claim in a judicial forum that it finds favorable for disputes with the Company or our directors, officers, employees or agents, which may discourage such lawsuits against the Company and such persons. Alternatively, if a court were to find these provisions of the Charter inapplicable to, or unenforceable in respect of, one or more of the specified types of actions or proceedings, the Company may incur additional costs associated with resolving such matters in other jurisdictions, which could adversely affect our business, financial condition or results of operations.
We are an “emerging growth company” and we cannot be certain if the reduced disclosure requirements applicable to emerging growth companies will make our Common Stock less attractive to investors.
We are an “emerging growth company,” as defined in the JOBS Act, and intend to take advantage of certain exemptions from various reporting requirements that are applicable to other public companies, including, but not limited to, not being required to comply with the auditor attestation requirements of Section 404 of the Sarbanes-Oxley Act, reduced disclosure obligations regarding executive compensation in our periodic reports and proxy statements and exemptions from the requirements of holding a nonbinding advisory vote on executive compensation and stockholder approval of any golden parachute payments not previously approved. We intend to take advantage of these reporting exemptions until the Company is no longer an emerging growth company. We cannot predict if investors will find our Common Stock less attractive because we will rely on these exemptions. If some investors find the Common Stock less attractive as a result, there may be a less active trading market for the Common Stock and its trading price may be more volatile.
As Old Atlas’s successor entity, the Company may remain an emerging growth company for up to five years after the IPO, although it will lose that status sooner if it has more than $1.235 billion of revenues in a fiscal year, has more than $700 million in market value of Common Stock held by non-affiliates as of any June 30 or issues more than $1.0 billion of non-convertible debt over a rolling three-year period.
To the extent that the Company relies on any of the exemptions available to emerging growth companies, you will receive less information about its executive compensation and internal control over financial reporting than issuers that are not emerging growth companies.
34
We may issue preferred stock the terms of which could adversely affect the voting power or value of the Common Stock.
The Charter authorizes the Company to issue, without the approval of its stockholders, one or more classes or series of preferred stock having such designations, preferences, limitations and relative rights, including preferences over Common Stock respecting dividends and distributions, as the Board may determine. The terms of one or more classes or series of preferred stock could adversely impact the voting power or value of the Common Stock. For example, the Company might grant holders of preferred stock the right to elect some number of its directors in all events or on the happening of specified events or the right to veto specified transactions. Similarly, the repurchase or redemption rights or liquidation preferences the Company might assign to holders of preferred stock could affect the residual value of the Common Stock.
Because the Company has elected to take advantage of the extended transition period pursuant to Section 107 of the JOBS Act, its financial statements may not be comparable to those of other public companies.
Section 107 of the JOBS Act provides that an emerging growth company can use the extended transition period provided in Section 7(a)(2)(B) of the Securities Act for complying with new or revised accounting standards. This permits an emerging growth company to delay the adoption of certain accounting standards until those standards would otherwise apply to private companies. The Company has elected to take advantage of this extended transition period and, as a result, will comply with new or revised accounting standards on the relevant dates on which adoption of such standards is required for private companies. Accordingly, our financial statements may not be comparable to companies that comply with public company effective dates, and our stockholders and potential investors may have difficulty in analyzing our operating results by comparing the Company to such companies.
As a result of the Up-C Simplification, the anticipated net cash tax savings attributable to our prior Up-C structure are no longer available to us. The loss of these tax benefits is likely to adversely impact our future tax liability, and this adverse impact could significantly outweigh any costs savings and/or other benefits that resulted from the Up-C Simplification, which could adversely affect our liquidity or the value of our Common Stock.
Under our previous Up-C structure, exchanges of Operating Units for Old Atlas Class A Common Stock pursuant to the terms of the Previous Atlas Operating LLC Agreement generally resulted in certain tax basis increases related to Atlas Operating’s assets. These tax basis increases were expected to generate additional depreciation, depletion, and amortization deductions which in turn, would have reduced our taxable income and resulted in reduced cash tax liabilities. The Company’s exchange of Operating Units for Common Stock in connection with the tax-deferred Up-C Simplification is not expected to result in any such tax basis increases, except to the extent of the limited amount of gain that might have been recognized by the holders of Operating Units as a result of certain debt-financed deductions. Moreover, following completion of the Up-C Simplification, because no Operating Units are held by any person other than Old Atlas, there will be no future exchanges of Operating Units for shares of Old Atlas Class A Common Stock or the Company’s Common Stock. Accordingly, the net cash tax savings that were expected to be available to Old Atlas under the previous Up-C structure are no longer be available to us since the completion of the Up-C Simplification. Foregoing these potential cash tax savings attributable to the Up-C structure will likely to increase our tax liability materially, and such increased tax liability could significantly outweigh the anticipated benefits of the Up-C Simplification, reducing the amount of cash available to use in our business or distribute to our stockholders, which could adversely affect our liquidity or the value of our Common Stock.
The Company’s new structure may impact our ability to offer equity consideration in acquisitive transactions on a tax-deferred basis, which could increase the price we must pay in such acquisition or adversely affect our ability to compete with other potential acquirors.
Our previous Up-C structure permitted us to use Operating Units, rather than Old Atlas Class A Common Stock, as equity consideration in acquisitive transactions. Due to the classification of Atlas Operating as a partnership for U.S. federal income tax purpose, many sellers in potential acquisitive transactions would have been able to receive Operating Units, but not shares of Old Atlas Class A Common Stock, as tax-deferred consideration for assets or equity of a target company, making Operating Units a preferable form of equity consideration. The Up-C Simplification eliminated our ability to offer Operating Units as equity consideration, such that we may not be able to offer tax-deferred equity consideration to potential sellers, while many other companies in the energy industry are organized as partnerships and would have this ability. As such, our inability to offer tax-deferred equity consideration in acquisitive transactions could require us to pay more for assets or target companies than we previously would have or could adversely affect our ability to compete with other potential acquirors.
35
Risks Related to Environmental, Mining and Other Regulations
Silica-related health issues and legislation, including compliance with existing or future regulations relating to respirable crystalline silica, or litigation could have an adverse effect on our business, reputation or results of operations.
We are subject to laws and regulations relating to human exposure to crystalline silica. For example, OSHA has implemented rules establishing a more stringent permissible exposure limit for exposure to respirable crystalline silica and provided other provisions to protect employees. These rules require compliance with engineering control obligations to limit exposures to respirable crystalline silica in connection with hydraulic fracturing activities. In June 2022, the DOL’s MSHA launched a new enforcement initiative to better protect U.S. miners from health hazards resulting from repeated overexposure to respirable crystalline silica. MSHA reports that silica dust affects thousands of miners each year and, without adequate protection, miners face risks of serious illnesses, many of which can be fatal.
As part of the program, MSHA will conduct silica dust-related mine inspections and expand silica sampling at mines, while providing mine operators with compliance assistance and best practices to limit miners’ exposure to silica dust.
Specifically, the silica enforcement initiative will include:
In addition, the DOL’s Educational Field and Small Mine Services staff will provide compliance assistance and outreach to mine operators, unions and other mining community organizations to promote and advance protections for miners.
The MSHA initiative is intended to take immediate action to reduce the risks of silica dust exposure as the DOL’s development of a mining industry standard continues. Then, in a related subsequent regulatory action, on July 13, 2023, the DOL published a notice of proposed rulemaking which would require operators to limit miners’ permissible exposure limit to respirable crystalline silica to 50 micrograms per cubic meter of air for a full shift exposure and take immediate corrective action if such exposure limits are exceeded. The proposed rule also establishes related requirements for exposure sampling, medical surveillance, and updated respiratory protection equipment standards.
If we are unable to satisfy these obligations, or are not able to do so in a manner that is cost effective or attractive to our customers, our business operations may be adversely affected or availability or demand for our products could be significantly affected. Federal and state regulatory authorities, including OSHA and MSHA, and analogous state agencies may continue to propose changes in their regulations regarding workplace exposure to crystalline silica, such as permissible exposure limits and required controls and personal protective equipment, and we can provide no assurance that we will be able to comply with any future laws and regulations relating to exposure to crystalline silica that are adopted, or that costs of complying with such future laws and regulations or any costs arising from non-compliance would not have an adverse effect on our operating results by requiring us to modify or cease our operations.
In addition, the inhalation of respirable crystalline silica is associated with health risks, including the lung disease silicosis. There is evidence of an association between crystalline silica exposure or silicosis and lung cancer and possible association with other diseases, including immune system disorders such as scleroderma. These health risks have been, and may continue to be, a significant issue confronting the hydraulic fracturing industry. Concerns over silicosis and other potential adverse health effects, as well as concerns regarding potential liability from the use of frac sand, may have the effect of discouraging our customers’ use of frac sand. The actual or perceived health risks of handling frac sand could adversely affect hydraulic fracturing service providers, including us, through reduced use of frac sand, the threat of product liability or employee lawsuits naming us as a defendant, increased scrutiny by federal, state and local regulatory authorities of us and our customers or reduced financing sources available to the hydraulic fracturing industry.
36
Over the past few decades, a number of companies that utilize silica in their operations have been named as a defendant, usually among many defendants, in numerous product liability lawsuits brought by or on behalf of current or former employees or customers alleging damages caused by silica exposure. The silica-related litigation brought against us to date and associated litigation costs, settlements and verdicts have not resulted in a material liability to us, and we presently maintain insurance policies where available. However, we may continue to have silica exposure claims filed against us in the future, including claims that allege silica exposure for periods or in areas not covered by insurance, and the costs, outcome and impact to us of any pending or future claims is not certain. Any such pending or future claims or inadequacies of our insurance coverage could have a material adverse effect on our business, reputation, financial condition, and results of operations.
Federal, state and local legislative and regulatory initiatives relating to hydraulic fracturing and the potential for related litigation could result in increased costs, additional operating restrictions or delays for our customers, which could cause a decline in the demand for our proppant and negatively impact our business, results of operations and financial condition.
We supply proppant to hydraulic fracturing operators in the oil and natural gas industry. Hydraulic fracturing is an important practice that is used to stimulate production of oil and natural gas from low permeability hydrocarbon bearing subsurface rock formations. The hydraulic fracturing process involves the injection of water, proppant, and chemicals under pressure into the formation to fracture the surrounding rock, increase permeability and stimulate production.
Although we do not directly engage in hydraulic fracturing activities, our customers purchase our proppant for use in their hydraulic fracturing activities. Hydraulic fracturing is typically regulated by state oil and natural gas commissions and similar agencies. Some states have adopted, and other states are considering adopting, regulations that could impose new or more stringent permitting, disclosure or well construction requirements on hydraulic fracturing operations. Aside from state laws, local land use restrictions may restrict drilling in general or hydraulic fracturing in particular. Municipalities may adopt local ordinances attempting to prohibit hydraulic fracturing altogether or, at a minimum, allow such fracturing processes within their jurisdictions to proceed but regulating the time, place and manner of those processes. In addition, federal agencies have started to assert regulatory authority over the process and various studies have been conducted or are currently underway by the EPA and other federal agencies concerning the potential environmental impacts of hydraulic fracturing activities. At the same time, certain environmental groups have suggested that additional laws may be needed and, in some instances, have pursued voter ballot initiatives to more closely and uniformly limit or otherwise regulate the hydraulic fracturing process, and legislation has been proposed by some members of Congress to provide for such regulation.
The adoption of new laws or regulations at the federal, state or local levels imposing reporting obligations on, or otherwise limiting, delaying, restricting, or prohibiting the hydraulic fracturing process could make it more difficult to complete oil and natural gas wells, increase our customers’ costs of compliance and doing business, and otherwise adversely affect the hydraulic fracturing services they perform, which could negatively impact demand for our proppant. In addition, heightened political, regulatory, and public scrutiny of hydraulic fracturing practices could expose us or our customers to increased legal and regulatory proceedings, which could be time- consuming, costly, or result in substantial legal liability or significant reputational harm. We could be directly affected by adverse litigation involving us, or indirectly affected if the cost of compliance limits the ability of our customers to operate. Such costs and scrutiny could directly or indirectly, through reduced demand for our proppant, have an adverse effect on our business, financial condition and results of operations.
We and our customers are subject to extensive environmental and natural resources regulations that impose, and will continue to impose, risks of significant costs and liabilities. In addition, future regulations, or more stringent enforcement of existing regulations, could increase those costs and liabilities, which could adversely affect our results of operations.
We are subject to a variety of federal, state and local environmental laws and regulations affecting the mining and mineral processing industry, including, among others, those relating to environmental permitting and licensing, plant and wildlife protection, wetlands protection, air and water emissions, greenhouse gas emissions, water pollution, waste management, including the transportation and disposal of waste and other materials, remediation of soil and groundwater contamination, land use, reclamation and restoration of properties, hazardous materials and natural resources. These laws and regulations have imposed, and will continue to impose, numerous obligations on our operations and the operations of our customers, including the acquisition of permits or other approvals to conduct regulated activities, the imposition of restrictions on the types, quantities and concentrations of various substances that may be released into the environment or injected in non-productive formations below ground in connection with oil and natural gas drilling and production activities, the incurrence of capital expenditures to mitigate or prevent releases of materials from our equipment or facilities or from customer locations where we are providing services, the imposition of substantial liabilities for pollution resulting from our operations, and the application of specific health and safety criteria addressing worker protection. Some environmental laws impose substantial penalties for noncompliance, and others, such as CERCLA, impose strict, retroactive and joint and several liability for the remediation of releases of hazardous substances.
37
Further, our business activities present risks of incurring significant environmental costs and liabilities, including costs and liabilities resulting from our handling of oilfield and other wastes, because of air emissions and wastewater discharges related to our operations, and due to historical oilfield industry operations and waste disposal practices. Moreover, accidental releases or spills may occur in the course of our operations or at facilities where our wastes are taken for reclamation or disposal, and we cannot assure you that we will not incur significant costs and liabilities as a result of such releases or spills, including any third-party claims for injuries to persons or damages to properties or natural resources. Remedial costs and other damages arising as a result of environmental laws and costs associated with changes in environmental laws and regulations could be significant and have an adverse effect on our liquidity, results of operations and financial condition.
Additionally, any failure by us or by our customers to comply with applicable environmental laws and regulations may cause governmental authorities to take actions that could adversely impact our operations and financial condition, including:
Moreover, environmental requirements, and the interpretation and enforcement of these requirements, change frequently and have tended to become more stringent over time. Future environmental laws and regulations could restrict our ability to expand our facilities or extract our mineral deposits or could require us to acquire costly equipment or to incur other significant expenses in connection with our business. The costs associated with complying with such requirements could have an adverse effect on our business, financial condition and results of operations. Additionally, our customers may not be able to comply with any new or amended laws and regulations, which could cause our customers to curtail or cease operations and thus reduce demand for our products and services. We cannot at this time reasonably estimate our costs of compliance or the timing of any costs associated with any new or amended laws and regulations, or any material adverse effect that any new or modified standards will have on our customers and, consequently, on our operations.
Our and our customers’ operations are subject to a number of risks arising out of the threat of climate change, including regulatory, political, litigation and financial risks, which could result in increased operating and capital costs for our customers and reduced demand for our products and services.
The threat of climate change continues to attract considerable attention in the United States and around the world. Numerous proposals have been made and could continue to be made at the international, national, regional and state levels of government to monitor and limit existing emissions of GHGs. These efforts have included consideration of cap-and-trade programs, carbon taxes, GHG disclosure obligations and regulations that directly limit GHG emissions from certain sources. Moreover, President Biden highlighted addressing climate change as a priority under his Administration, issued several Executive Orders related to climate change, recommitted the United Sates to long-term international goals to reduce emissions and continues to require executive agencies to incorporate climate change considerations in their decision-making and policy setting. As a result, our operations and the operations of our natural gas and crude oil exploration and production customers are subject to a series of regulatory, political, litigation, financial, and physical risks associated with the production and processing of fossil fuels and the emission of GHGs.
At the federal level, the EPA has adopted rules that, among other things, establish construction and operating permit reviews for GHG emissions from certain large stationary sources, require the monitoring and annual reporting of GHG emissions from certain industrial sources, and impose new standards reducing methane emissions from oil and gas operations through limitations on venting and flaring and the implementation of enhanced emission leak detection and repair requirements. The regulation of methane emissions from oil and gas facilities has been subject to considerable attention in recent years, and the EPA recently finalized rules in December 2023 that establish new and more stringent standards for the use of emission capture and control equipment and systems, leak detection equipment and monitoring, and so-called “green well completion” requirements for both new and existing sources across the oil and gas sector. The BLM has also proposed rules intended to curtail the waste of methane flared, vented, or leaked from oil and gas operations on federal and Tribal lands. In addition, the U.S. Congress may continue to consider and pass legislation related to the reduction of GHG emissions, including methane and carbon dioxide. For example, the IRA, which appropriates significant federal funding for renewable energy initiatives and, for the first time ever, imposes a fee on GHG emissions from certain facilities, was signed into law in August 2022. These ongoing regulatory actions and the emissions fee and funding provisions of the IRA could increase operating costs within the oil and gas industry and accelerate the transition away from fossil fuels, which could in turn reduce demand for our products and services and adversely affect our and our customers’ business and results of operations. We note that the regulatory activities discussed above are subject to ongoing intense political debate and could be subject to major modification depending upon the outcome of the 2024 election cycle.
38
At the international level, the United Nations-sponsored Paris Agreement, though non-binding, calls for signatory nations to limit their GHG emissions through individually determined reduction goals every five years after 2020. President Biden has recommitted the United States to the Paris Agreement and, in April 2021, announced a goal of reducing the United States’ emissions by 50% to 52% below 2005 levels by 2030. Various U.S. states and local governments have also publicly committed to furthering the goals of the Paris Agreement. Moreover, the international community convenes annually to negotiate further pledges and initiatives, such as the Global Methane Pledge (a collective goal to reduce global methane emissions by 30% from 2020 levels by 2030) and, more recently, an agreement to transition “away from fossil fuels in energy systems in a just, orderly and equitable manner” and increase renewable energy capacity so as to achieve net zero by 2050, although no timeline for doing so was set. The impacts of these orders, pledges, agreements and any legislation or regulation promulgated to fulfill the United States’ commitments under the Paris Agreement or other international agreements cannot be predicted at this time.
Litigation risks are also increasing, as a number of cities and other entities have sought to sue various oil and natural gas companies in state or federal court, alleging, among other things, that such companies created public nuisances by producing fuels that contributed to climate change and its effects, such as rising sea levels or extreme weather events, and therefore are responsible for resulting infrastructure damages, or alleging that the companies have been aware of the adverse effects of climate change for some time but defrauded their investors by failing to adequately disclose those impacts. Our customers’ involvement in such a case, regardless of the substance of the allegations, could have adverse reputational impacts and any unfavorable ruling in any such case could significantly impact their operations and consequently could have an adverse impact on demand for our products and services.
There are also increasing financial risks for the oil and gas sector as shareholders, bondholders, and lenders may elect in the future to shift some or all of their investments into non-fossil fuel energy sectors. Certain institutional lenders have shifted their investment practices to favor non-fossil fuel energy sources, such as wind and solar, and some of them may elect not to provide funding to the oil and gas sector. Many of the largest U.S. banks have made “net zero” carbon emission commitments and have announced that they will be assessing financed emissions across their portfolios and taking steps to quantify and reduce those emissions. Additionally, there is also a risk that financial institutions will be pressured or required to adopt policies that limit funding for the oil and gas sector. In 2023, the six largest U.S. banks performed a pilot climate scenario analysis exercise, pursuant to Federal Reserve instructions. Furthermore, the SEC has proposed rules that would mandate extensive disclosure of climate risks, including financial impacts, related governance and strategy, and GHG emissions for all U.S.-listed public companies. Enhanced climate-related disclosure requirements could result in additional legal and accounting costs and accelerate the trend of certain stakeholders and lenders restricting or seeking more stringent conditions with respect to their investments in carbon-intensive sectors. Such disclosure regulations could also lead to increased litigation risks and reputational harm. Any material reduction in the capital available to us or our customers could make it more difficult to secure funding for our growth projects or our customers’ exploration and production activities, which could reduce the demand for our products and services and impact our financial performance.
Finally, physical climate change impacts, including increased frequency and severity of storms, severe and persistent drought conditions, winter storms, floods and other climatic events, may potentially have a large impact on our operations and financial results, and our customers’ exploration and production operations. While our consideration of changing climatic conditions and inclusion of safety factors in the design and operation of our facilities is intended to reduce the uncertainties that climate change and other events may potentially introduce, our ability to mitigate the adverse impacts of these events depends in part on the effectiveness of our disaster preparedness and response and business continuity planning and those of our customers, which may have not considered or prepared for every eventuality.
Restrictions on our operations and those of our customers intended to protect certain species of wildlife could have an adverse impact on our ability to expand some of our existing operations or limit our customers’ ability to develop new oil and natural gas wells.
Various federal and state statutes prohibit certain actions that adversely affect endangered or threatened species and their habitat, migratory birds, wetlands, and natural resources. These statutes include the ESA, the MBTA and the CWA. The USFWS may designate critical habitat areas that it believes are necessary for survival of threatened or endangered species. A critical habitat designation could result in further material restrictions on federal land use or on private land use and could delay or prohibit land access or development. Where takings of or harm to species or damages to wetlands, habitat, or natural resources occur or may occur, government entities or at times private parties may act to prevent or restrict oil and natural gas exploration activities or seek damages for any injury, whether resulting from drilling or construction or releases of oil, wastes, hazardous substances or other regulated materials, and in some cases, criminal penalties may result.
39
The DSL is one example of a species that, if listed as endangered or threatened under the ESA, could impact our operations and the operations of our customers. On June 3, 2023, the USFWS proposed to list the DSL as an endangered species under the ESA, but did not concurrently propose to designate any critical habitat. In the proposed rule the USFWS determined that designating DSL critical habitat was prudent, but not determinable at the time of issuance, thus triggering a one-year review period for the future designation of critical habitat. If the DSL endangerment listing is finalized as proposed, our operations and the operations of our customers in any area that is later designated as DSL critical habitat may be limited, delayed or, in some circumstances, prohibited, and we and our customers could be required to comply with expensive mitigation measures intended to protect the DSL and its habitat. However, to mitigate the impact of some of these risks, we are a participant in a CCAA for DSL habitat in non-federal lands in certain counties of western Texas, which was approved by the USFWS in January 2021. We have been a contributor to and supporter of the CCAA since its inception and our participation in the CCAA and our other voluntary conservation measures for the benefit of the DSL, including setting aside as much as 17,000 acres for DSL habitat, helps reduce the risk of disruptions to our business and operations in the event DSL critical habitat is designated in the areas in which we operate.
Another species the recent listing of which could impact the operations of our customers is the lesser prairie-chicken. In November 2022, the USFWS formally listed two Distinct Population Segments (“DPSs”) of the lesser prairie-chicken under the ESA. The Southern DPS, the habitat of which includes portions of southeast New Mexico and western Texas, was listed as endangered, while the Northern DPS, the habitat of which spans from northern Texas through eastern Oklahoma and into southeastern Colorado and southwestern Nebraska, was listed as threatened. The listed territory of the Southern DPS could overlap with the operating areas of some of our customers, who in turn may be adversely affected by any restrictions which arise as a result of the endangerment determination. The identification or designation of further previously unprotected species as threatened or endangered in areas where we or our customers operate could cause us to incur increased costs arising from species protection measures or could result in limitations on our customers that result in reduced demand for our services, adversely affecting our results of operations. There is also increasing interest from a variety of stakeholders, including investors and institutional lenders, in nature-related matters beyond protected species, such as general biodiversity, which may similarly require us to incur costs or take other measures which may materially impact our business or operations.
Any restrictions on oil and natural gas development on federal lands have the potential to adversely impact our operations and the operations of our customers.
Many of our customers possess leases in New Mexico, which are granted by the federal government and administered by the BLM. Operations conducted by our customers on federal oil and natural gas leases must comply with numerous additional statutory and regulatory restrictions. These leases contain relatively standardized terms requiring compliance with detailed regulations. Under certain circumstances, the BLM may require operations on federal leases to be suspended or terminated. Any such suspension or termination of our customers’ leases could reduce demand for our products or services and adversely impact our results of operations.
The Biden Administration has taken several actions to curtail oil and natural gas activities on federal lands including a temporary pause on new oil and gas leasing, increases in royalty rates, and a reduction in the total acreage available through lease sales. In November 2022, BLM also issued a proposed rule to reduce the waste of natural gas from venting, flaring, and leaks during oil and gas production activities on Federal and Native American leases. More recently, in July 2023, BLM proposed further reforms to the federal oil and gas leasing program, including increased bonding requirements and the codification of certain IRA provisions related to minimum bids, base rental rates, and royalty rates. While we cannot predict the ultimate impact of these actions or whether the Department of Interior and BLM will implement further reforms or operating restrictions, any revisions to the federal leasing or permitting process that make it more difficult for our customers to pursue operations on federal lands and operate economically may materially adversely impact our operations. The Biden Administration’s ongoing development and implementation of a Social Cost of GHGs (“SC-GHG”) (formerly known as the Social Cost of Carbon or “SCC”) metric may also impact future regulatory decision-making and our customers’ ability to obtain federal leases. In April 2023, the Fifth U.S. Circuit Court of Appeals (the “Fifth Circuit”) dismissed challenges to preliminary then-SCC estimates for lack of standing. However, litigation related to the use of this metric could be revived once federal agencies beginning relying upon finalized SC-GHG values for discrete agency actions. In September 2023, the Biden Administration announced it would be directing federal agencies to consider SC-GHG in budgeting, procurement, and other agency decisions, including environmental reviews, where appropriate. The implementation of the SC-GHG metric in agency decision-making, and the result of any related litigation, could impact the character of new regulations on certain of the federal oil and gas leases of our customers, which in turn could impact our results of operations.
40
Additionally, oil and natural gas operations on federal lands, and related infrastructure projects may be impacted by recent changes to NEPA implementing regulations. In 2020, the Trump Administration made a variety of substantive and procedural changes to NEPA, including limiting the scope of review to the direct effects of a proposed project on the environment. A new “Final Rule,” introduced by the Council on Environmental Quality (“CEQ”) under the Biden Administration, which took effect in May 2022, reversed several changes introduced by the 2020 rule, including the scope limitations. The 2022 Final Rule requires NEPA reviews to incorporate consideration of indirect and cumulative impacts of the proposed project, including effects on climate change and GHGs, consistent with pre-2020 requirements. The new rule also allows agencies to create stricter NEPA rules as they see fit, but left in place the 2020 rule two-year time limit to complete environmental impact statements. More recently, in January 2023, the CEQ released updated guidance for agency consideration of GHG emissions and climate change impacts in environmental reviews, which includes, among other recommendations, best practices for analyzing and communicating climate change effects. Additionally, in July 2023, the CEQ proposed revisions to NEPA that would expand requirements to analyze the cumulative effects of the project on climate change and consider any disproportionate impact of the project on communities with environmental justice concerns as well enhance certain project obligations for implementing environmental mitigation measures. To the extent changes to the NEPA implementing regulations restrict or limit the ability of our customers to pursue oil and gas operations and development projects in an economical manner, demand for our products and services may be impacted, which could adversely affect our results of operations.
Operations on federal lands also face litigation risks. From time to time, legal challenges have been filed relating to federal leasing decisions, such as for failure to adequately assess the impact of any increase of GHG emissions resulting from increased production on federal lands. Separately, there is a risk that authorizations required for existing operations may be delayed to the point that it causes a business disruption, and we cannot guarantee that further action will not be taken to curtail oil and natural gas development on federal land. For example, certain lawmakers have proposed to reduce or ban further leasing on federal lands or to adopt further restrictions on such leasing. To the extent such legislation is passed, it may adversely impact our customers’ operations, which could negatively impact our financial performance or results of operations.
We and our customers are subject to regulations that impose stringent occupational health, safety and labor standards on numerous aspects of our operations.
Multiple aspects of our and our customers’ operations are subject to occupational health and safety standards, including our mining operations, our trucking operations, and employee exposure to crystalline silica.
Our mining operations are subject to the Mine Safety and Health Act of 1977, as amended by the Mine Improvement and New Emergency Response Act of 2006 (as amended, the “Mine Act”), which imposes stringent health and safety standards on numerous aspects of mineral extraction and processing operations, including the training of personnel, operating procedures, operating equipment and other matters. Our operating locations are regularly inspected by MSHA for compliance with the Mine Act.
The DOT and various state agencies exercise broad powers over our trucking services, generally governing matters including authorization to engage in motor carrier service, equipment operation, safety, alcohol and drug testing, and financial reporting. In addition, our operations must comply with the Fair Labor Standard Act, which governs such matters as wages and overtime, and which is administered by the DOL. We may be audited periodically by the DOT or the DOL to ensure that we are in compliance with these safety, hours-of-service, wage and other rules and regulations, and failure to comply could result in material costs.
We are also subject to laws and regulations relating to human exposure to crystalline silica. Several federal and state regulatory authorities, including MSHA and OSHA, may continue to propose changes to their regulations regarding workplace exposure to crystalline silica, such as permissible exposure limits, required controls and personal protective equipment. Our failure to comply with existing or new health and safety standards, or changes in such standards or the interpretation or enforcement thereof, could require us or our customers to modify operations or equipment, shut down some or all operating locations, impose significant restrictions on our ability to conduct operations, impose fines or otherwise have an adverse effect on our business, financial condition, employee relations and results of operations.
We and our customers are subject extensive permitting regulations and obligations. Our or our customers’ failure to obtain, maintain, renew, or comply with the terms of the permits we require to operate may adversely affect our results of operations.
In addition to the regulatory matters described above, we and our customers are subject to extensive permitting obligations and regulations. In order to obtain permits and renewals of permits in the future, we may be required to prepare and present data to governmental authorities pertaining to the potential adverse impact that any proposed excavation or production activities, individually or in the aggregate, may have on the environment. Certain approval procedures may require preparation of archaeological surveys, endangered species studies, and other studies to assess the environmental impact of new sites or the expansion of existing sites. Compliance with these regulatory requirements is expensive and significantly lengthens the time needed to develop a site. Finally, obtaining or renewing required permits is sometimes delayed or prevented due to community opposition and other factors beyond our control.
41
Our future success depends on, among other things, our ability to extract our proppant deposits profitably, and our customers’ ability to operate their businesses as they currently do. The denial or cancellation of a permit essential to our or our customers’ operations or the imposition of conditions with which it is not practicable or feasible to comply could have an adverse effect on our business. Significant opposition to a permit by neighboring property owners, members of the public or other third parties or a delay in the environmental review and permitting process also could impair or delay our or our customers’ operations. Additionally, new regulations or permitting requirements could require us to modify existing permits or obtain new permits, implement additional pollution control technology, curtail operations (including our ability to extract or the pace of extraction of mineral deposits), significantly increase our operating costs or impose additional operating restrictions among our customers (including impacts that may impact our customers’ ability to use our proppant) that reduce demand for our products or services. Such permit proceedings are often subject to public notice and comment, and third parties, including nongovernmental environmental organizations, may challenge government actions related to permits required for our operations. A failure to timely obtain the permits required for the operation of our business may adversely affect our results of operations.
Risks Related to the Hi-Crush Transaction
The Hi-Crush Transaction is subject to a number of conditions which may delay or reduce the anticipated benefits of the Hi-Crush Transaction, result in additional expenditures of money and resources, or result in termination of the Merger Agreement.
Our obligations and the obligations of Hi-Crush to consummate the Hi-Crush Transaction are subject to the satisfaction (or waiver by all parties, to the extent permissible under applicable laws) of a number of conditions described in the Merger Agreement (as defined in Item 7. “Management’s Discussion and Analysis of Financial Condition and Results of Operations.—Recent Developments”), including Hi-Crush’s delivery of a written consent approving the Hi-Crush Transaction signed by Hi-Crush stockholders holding at least 95% of the voting power. Many of the conditions to completion of the Hi-Crush Transaction are not within our control and we cannot predict when, or if, these conditions will be satisfied. If any of these conditions are not satisfied or waived prior to the End Date (as such term is defined in the Merger Agreement), it is possible that the Merger Agreement may be terminated.
Although the parties have agreed to use reasonable best efforts, subject to certain limitations, to complete the Hi-Crush Transaction promptly, these and other conditions may fail to be satisfied. In addition, completion of the Hi-Crush Transaction may take longer, and could cost more, than we expect. The requirements for obtaining the required clearances and approvals could delay the completion of the Hi-Crush Transaction for a significant period of time or prevent them from occurring. Any delay in completing the Hi-Crush Transaction may adversely affect the cost savings and other benefits that we expect to achieve if the Hi-Crush Transaction and the integration of Hi-Crush’s business into ours are completed within the expected timeframe.
We may not realize the anticipated benefits and synergies expected from the Hi-Crush Transaction.
Achieving the expected benefits of the Hi-Crush Transaction depends in part on successfully consolidating the Company’s and Hi-Crush’s functions and integrating their operations and procedures in a timely and efficient manner, as well as being able to realize the anticipated growth opportunities and synergies from combining the companies’ businesses and operations. We may fail to realize the anticipated benefits and synergies expected from the Hi-Crush Transaction, which could adversely affect our business, financial condition and operating results.
Achieving the expected benefits of the Hi-Crush Transaction requires, among other things, realization of the targeted synergies expected from the Hi-Crush Transaction, and there can be no assurance that we will be able to successfully integrate Hi-Crush’s assets or otherwise realize the expected benefits of the Hi-Crush Transaction. The anticipated benefits of the Hi-Crush Transaction may not be realized fully or at all, or may take longer to realize than expected. Difficulties in integrating Hi-Crush’s assets and operations may result in our inability to perform as expected, in operational challenges or in failure to realize anticipated efficiencies. Potential difficulties in realizing the anticipated benefits of the Hi-Crush Transaction include:
42
We have also incurred, and expect to continue to incur, a number of costs associated with completing the Hi-Crush Transaction and integrating the operations of Hi-Crush into our business. The elimination of duplicative costs, as well as the realization of other efficiencies related to the integration of the two companies, may not initially offset integration-related costs or achieve a net benefit in the near term, or at all. Matters relating to the Hi-Crush Transaction (including integration planning) require substantial commitments of time and resources by our management, which may result in the distraction of management from ongoing business operations and pursuing other opportunities that could have been beneficial to us.
Our future success will depend, in part, on our ability to manage our expanded business by, among other things, integrating the assets, operations and personnel of Atlas and Hi-Crush in an efficient and timely manner, consolidating systems and management controls and successfully integrating relationships with customers, vendors and business partners. Failure to successfully manage the combined operations may have an adverse effect on our business, reputation, financial condition and results of operations.
We may be the target of securities class action and derivative lawsuits, which could result in substantial costs and may prevent or delay the consummation of the Hi-Crush Transaction or result in the payment of damages following completion of the Hi-Crush Transaction.
Securities class action lawsuits or derivative lawsuits are often brought against public companies that have entered into merger agreements. Even if the lawsuits are without merit, defending against such claims can result in substantial costs and divert management time and resources. An adverse ruling in any such lawsuit could result in monetary damages, which could have a negative impact on our liquidity and financial condition. Additionally, if a plaintiff is successful in obtaining an injunction prohibiting completion of the Hi-Crush Transaction, then that injunction may delay or prevent the Hi-Crush Transaction from being completed, which could adversely affect our business, financial condition, results of operations and cash flows.
Our stockholders as of immediately prior to the Hi-Crush Transaction will have diluted ownership in our Company.
We anticipate issuing approximately 9.7 million shares of the Company’s Common Stock to Hi-Crush equity owners, pursuant to the Merger Agreement. The issuance of these new shares could have the effect of depressing the market price of our Common Stock, through dilution of earnings per share or otherwise. Any dilution of, or delay of any accretion to, our earnings per share could cause the price of our Common Stock to decline or increase at a reduced rate.
Following the completion of the Hi-Crush Transaction, it is anticipated that persons who were stockholders of Atlas immediately prior to the Hi-Crush Transaction will own approximately 91.2% of the outstanding Common Stock following the issuance of 9.7 million shares of Common Stock to the Hi-Crush equity owners in connection with the consummation of the Hi-Crush Transaction. As a result, our current stockholders will have less influence on the policies of Atlas after the closing of the Hi-Crush Transaction than they currently have on our policies.
We will incur significant transaction and merger-related costs in connection with the Hi-Crush Transaction.
We have incurred and expect to incur a number of non-recurring costs associated with the Hi-Crush Transaction. These costs and expenses include fees paid to financial, legal and accounting advisors, potential employment-related costs, filing fees, printing expenses and other related charges. Some of these costs are payable by us regardless of whether the Hi-Crush Transaction is completed. There are also a large number of processes, policies, procedures, operations, technologies and systems that may or must be integrated in connection with the Hi-Crush Transaction and the integration of operations with ours. While we have assumed that a certain level of expenses would be incurred in connection with the Hi-Crush Transaction and the other transactions contemplated by the Merger Agreement, there are many factors beyond our control that could affect the total amount or the timing of the integration and implementation expenses.
There may also be additional unanticipated significant costs in connection with the Hi-Crush Transaction that we may not recoup. These costs and expenses could reduce the realization of efficiencies, strategic benefits and additional income we expect to achieve from the Hi-Crush Transaction. Although we expect that these benefits will offset the transaction expenses and implementation costs over time, this net benefit may not be achieved in the near term or at all.
43
General Risk Factors
Pandemics, epidemics or disease outbreaks, such as the COVID-19 pandemic, may disrupt our business and operations, which could materially affect our financial condition, results of operations and forward-looking expectations.
Public health crises, pandemics and epidemics, such as the COVID-19 pandemic, may adversely impact our operations, the operations of our customers and the global economy, including the worldwide demand for oil and natural gas and the level of demand for our products and services. Fear of such events has previously altered the level of capital spending by oil and natural gas companies for E&P activities and has adversely affected global economies and financial markets, resulting in economic downturns that have affected demand for our products and services. For instance, the outbreak of COVID-19 caused governmental authorities to impose mandatory closures, seek voluntary closures and impose restrictions on, or advisories with respect to, travel, business operations and public gatherings or interactions. The impact of future health crises, pandemics and epidemics and responsive measures could adversely affect our business in a number of ways, any of which could have a material adverse effect on us.
If securities or industry analysts do not publish research or reports or publish unfavorable research about us, the price and trading volume of our Common Stock could decline.
The trading market for our Common Stock depends in part on the research and reports that securities or industry analysts publish about us and our business. If one or more of the analysts who covers us downgrades our securities, the price of our securities would likely decline. If one or more of these analysts ceases to cover us or fails to publish regular reports on us, interest in the purchase of our securities could decrease, which could cause the price of our Common Stock and other securities and their trading volume to decline.
If we fail to develop or maintain an effective system of internal controls, we may not be able to accurately report our financial results or prevent fraud. As a result, current and potential stockholders could lose confidence in our financial reporting, which would harm our business and the trading price of our Common Stock.
Effective internal controls are necessary for us to provide reliable financial reports, prevent fraud and operate successfully as a public company. If we cannot provide reliable financial reports or prevent fraud, our reputation and operating results would be harmed. We cannot be certain that our efforts to develop and maintain our internal controls will be successful, that we will be able to maintain adequate controls over our financial processes and reporting in the future or that we will be able to comply with our obligations under Section 404 of the Sarbanes-Oxley Act. Any failure to develop or maintain effective internal controls, or difficulties encountered in implementing or improving internal controls, could harm the Company’s operating results or cause us to fail to meet our reporting obligations. Ineffective internal controls could also cause investors to lose confidence in reported financial information, which would likely have a negative effect on the trading price of our Common Stock.
Our business and operations could suffer in the event of cybersecurity breaches, information technology system failures, network disruptions or other cyber security risks. A cyber incident could occur and result in information theft, data corruption, operational disruption and/or financial loss.
We rely on the efficient and uninterrupted operation of both our Company and third-party information technology systems and infrastructure to process transactions, summarize our operating results, deliver our products, perform many of our services and manage our business and operations. In the ordinary course of our business, we collect and store sensitive data, including our proprietary business information and personally identifiable information of our employees. The secure collection, processing, maintenance, storage, and transmission of information is critical to our operations. We have implemented procedural safeguards and stringent access controls designed to protect our information technology systems and data. Furthermore, we have sophisticated tools and third-party vendors monitoring our networks, email, cloud, and operational technology 24/7 against emerging cyber threats and vulnerabilities. However, our information technology systems and networks, and those of our customers, vendors, suppliers and other business partners, are subject to damage or interruption from power outages, computer and telecommunications failures, computer viruses, cyberattack or other security breaches, catastrophic events, such as fires, floods, earthquakes, tornadoes, hurricanes, acts of war or terrorism, usage errors by our employees and other events unforeseen or generally beyond our control. If our information technology systems are damaged or cease to function properly, we may need to make a significant investment to fix or replace them, and we may suffer loss of critical data, damage to our reputation and financial condition and interruptions or delays in our operations.
We have been the target of cyberattacks, and while to date none of these incidents has had a material impact on us, we expect to continue to be targeted in the future. Our risk and exposure to these matters remains heightened because of, among other things, the evolving nature of these threats, the current global economic and political environment, the outsourcing of some of our business operations, the ongoing shortage of qualified cybersecurity professionals and the interconnectivity and interdependence of third parties to our systems.
44
As cyber incidents continue to evolve, we will likely be required to expend additional resources to continue to modify or enhance our protective measures or to investigate and remediate any vulnerability to cyber incidents. In addition, any technology required by any mandate by authorities requiring the transition to remote work increases our vulnerability to cybersecurity threats, including threats to gain unauthorized access to sensitive information or to render data or systems unusable. Any material disruption in our information technology systems or systems that affect our business operations, delays or difficulties in implementing or integrating new systems or enhancing current systems, or any vulnerabilities rendering data or systems unusable following any mandated remote work situations, could have an adverse effect on our business and results of operations.
We monitor our information technology systems in an effort to detect cyberattacks, security breaches and unauthorized access. Our preventative and detective measures include penetration tests on externally facing systems, threat assessments, cybersecurity audits and expert consultations. However, the measures we employ to detect and prevent cyberattacks may be insufficient to protect us from an incident or to minimize the magnitude and effects of such incident for a significant period of time. Despite our security measures, the occurrence of a cyberattack, breach, unauthorized access, misuse, computer virus or other cybersecurity event could jeopardize our systems, interrupt our operations or result in the unauthorized disclosure, gathering, monitoring, misuse, corruption, loss or destruction of confidential and other information that belongs to us, our customers, our counterparties or third-party service providers that is processed and stored in, and transmitted through, our information technology systems and networks. Any such event could result in significant losses, loss of customers and business opportunities, breaches of our contractual obligations, reputational damage, litigation, regulatory fines, penalties or intervention, reimbursement or other compensatory costs, or otherwise adversely affect our business, financial condition or results of operations. Moreover, the constantly evolving global regulatory landscape surrounding data privacy and cybersecurity poses compliance challenges, and complying with such data protection obligations may be expensive. Any failure, whether real or perceived, by us to comply with applicable data privacy and protection obligations could result in significant losses, loss of customers and business opportunities, breaches of our contractual obligations, reputational damage, litigation, regulatory fines, penalties or intervention, reimbursement or other compensatory costs, or otherwise adversely affect our business, financial condition or results of operations.
A terrorist attack or armed conflict could harm our business.
Global and domestic terrorist activities, anti-terrorist efforts and other armed conflicts involving the United States could adversely affect the U.S. and global economies and could prevent us from meeting financial and other obligations. We could experience loss of business, delays or defaults in payments from payors or disruptions of fuel supplies and markets if pipelines, production facilities, processing plants, refineries or transportation facilities are direct targets or indirect casualties of an act of terror or war. Such activities could reduce the overall demand for oil and natural gas, which, in turn, could also reduce the demand for our proppant. Global and domestic terrorist activities and the threat of potential terrorist activities and any resulting physical damage and economic downturn could adversely affect our results of operations, impair our ability to raise capital or otherwise adversely impact our ability to realize certain business strategies.
45
Item 1B. Unresolved Staff Comments.
None.
Item 1C. Cybersecurity.
Risk Management and Strategy
We recognize the critical importance of developing, implementing, and maintaining proactive cybersecurity measures to safeguard our information systems and protect the confidentiality, integrity, and availability of our data. To that end, we engage in the following cybersecurity risk management principles:
Material Risks & Integrated Overall Risk Management
We have strategically integrated cybersecurity risk management into our broader risk management framework to promote a Company-wide culture of cybersecurity risk management. This integration ensures that cybersecurity considerations are an integral part of our decision-making processes at every level. The security function housed within our Information Technology department continuously evaluates and addresses cybersecurity risks in alignment with our business objectives and operational needs and in cooperation with our broader risk management team.
Third-Party Risk Management Advisors
Recognizing the complexity and the evolving nature of cybersecurity threats, we engage with a range of external experts, including cybersecurity assessors, consultants, and auditors in evaluating and testing our cybersecurity program and practices. This ecosystem enables us to leverage specialized knowledge and insights, ensuring our cybersecurity program and practices remain attuned to our Company’s particular needs and vulnerabilities. Our collaboration with these third-parties includes penetration tests on externally facings systems, threat assessments and subject matter expertise consultation on risk remediation and security enhancements.
Vendor Risk Oversight
Given the risks associated with using third-party service providers, we have developed stringent practices to oversee and manage these risks. We start the assessment right from the vendor onboarding stage, by conducting security and background assessments of vendors prior to their engagement, and we monitor ongoing relationships to ensure compliance with our cybersecurity standards. This practice is designed to mitigate risks related to data breaches or other security incidents originating from third-parties.
Risks from Cybersecurity Threats
To date, we have not yet experienced any cybersecurity threats or incidents that have materially affected or are reasonably likely to materially affect our business, financial condition or results of operations.
Governance
The Board is acutely aware of the critical nature of managing risks associated with cybersecurity threats given the significance of these threats to our operational integrity and stakeholder confidence. As such, the Board engages with our management team for periodic updates on our cybersecurity risk program and progress on remediation efforts.
Board Oversight
The Audit Committee is central to the Board’s oversight of cybersecurity risks and bears the primary responsibility for this domain. The Audit Committee is composed of board members with depth of experience in enterprise risk management, compliance, corporate governance, technology, finance, and the unique characteristics and vulnerabilities of the oil and gas industry, equipping them to oversee cybersecurity risks effectively.
Management’s Risk Management Role
Our Chief Financial Officer and our VP of Technology play a pivotal role in informing the Audit Committee on cybersecurity risks. They provide briefings to the Audit Committee encompassing a broad range of topics, including:
46
Cybersecurity Risk Management Personnel
Our VP of Technology, Shaam Farooq, has primary responsibility for assessing, monitoring, and managing our cybersecurity risks. Mr. Farooq has over 25 years of global technology leadership experience in the oil and gas, technology, manufacturing, and automotive industries. Mr. Farooq has led the technology functions and overseen the cybersecurity and digital transformation of startups and Fortune 100 companies alike and brings deep domain expertise and hands on experience to his role. His background includes extensive experience as an enterprise CISO and is an active participant in the oil and gas cybersecurity community, keeping abreast of late breaking threats and remediations. Shaam continues to refresh his Certified Information Systems Security Professional and Certified Information Security Manager trainings as schedule permits.
Cybersecurity Incident Monitoring
The VP of Technology is continually informed about the latest developments in cybersecurity, including potential threats and innovative risk management techniques. This ongoing knowledge acquisition is crucial for the effective prevention, detection, mitigation, and remediation of cybersecurity incidents. The VP of Technology has implemented industry tools and oversees the processes for the regular monitoring of our information systems. This includes the deployment of advanced security measures and regular system audits to identify potential vulnerabilities. In the event of a cybersecurity incident, the VP of Technology is equipped with a well-defined incident response plan (IRP) which is continuously enhanced. This plan includes immediate actions to mitigate the impact and long-term strategies for remediation and prevention of future incidents.
Reporting to Board
The VP of Technology, in his capacity, regularly informs the Executive Chairman and Chief Executive Officer and President and Chief Financial Officer of all aspects related to cybersecurity risks and incidents. This ensures that the highest levels of management are kept abreast of the cybersecurity posture and potential risks facing the Company. In addition to regular briefings, any significant cybersecurity matters and strategic risk management decisions would be escalated to the Board, ensuring that they have comprehensive oversight and can provide guidance on critical cybersecurity issues.
47
Item 2. Properties.
We currently operate our Kermit and Monahans facilities in Winkler and Ward Counties, Texas. For the years ended December 31, 2023, 2022 and 2021, our facilities produced, in aggregate, approximately 11.0, 10.2 and 8.3 million tons of proppant, respectively. The following map shows the location of these facilities:
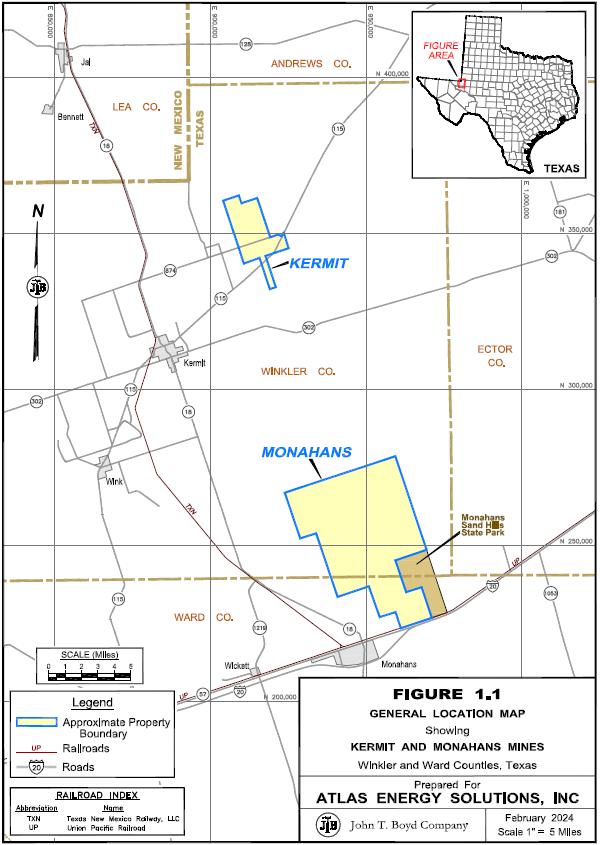
48
Kermit, Texas
As of December 31, 2023, our two Kermit mines had a combined annual production capacity of 11 million tons and are located on 5,826 gross acres of land (of which 5,341 net acres are controlled by us either through lease or fee ownership) in Winkler County, Texas, with onsite processing and truck loading facilities. We commenced construction of our first Kermit mine in October of 2017, and commenced operations in June 2018. We commenced construction of our second Kermit mine in July of 2022, which we completed in December 2023. Our Kermit facilities have a net book value of $386.1 million. Geographically, our Kermit facilities are located at approximately 31° 58’ 6.29” N latitude and 103° O’ 39.46” W longitude, are situated approximately seven miles northeast of Kermit, Texas, and are accessible via Texas State Highway 18. The Midland International Air and Space Port is located approximately 45 miles southeast of the facilities. The facilities’ primary utilities include three phase power, natural gas from an interstate transmission line and groundwater from onsite wells, all of which are present in sufficient quantities to sustainably support facilities producing 11 million tons annually. The facilities were designed with redundancies to provide enhanced reliability and minimize the potential for bottlenecks throughout the processing and loadout operation. Our plants were designed modularly to accommodate efficient expansion—maximizing the increase in production capacity while minimally increasing the facilities’ footprints.
The Kermit facilities have 300.7 million tons of associated proven reserves as of December 31, 2023. The sand deposits generally range from 60 to over 100 feet thick and consist of 40/70-mesh and 100-mesh sand, with an anticipated production mix of approximately 51% 40/70-mesh and approximately 49% 100-mesh. The crush strength of the sand mined at these facilities is between 7,000 to 8,000 pounds-per-square-inch (“PSI”) for 40/70-mesh and between 10,000 to 11,000 PSI for 100-mesh. Given the open-dune reserves and natural aquifer, sand is generally extracted from the mine through surface excavation through mining by electric dredge. The Kermit facilities have onsite transportation infrastructure capable of loading more than 35 trucks per hour.
In December 2017, we entered into a royalty agreement with Sealy Smith. The royalty agreement associated with the Kermit location terminated on the date of our IPO, pursuant to the terms of the agreement. We have received the material permits required to operate our Kermit facilities from the Air Permits Division of the TCEQ, Winkler County, the MSHA and TxDOT. Please see “—Our Permits” for more information.
Monahans, Texas
As of December 31, 2023, our Monahans mine had annual production capacity of 5.5 million tons and is located on approximately 32,224 gross acres of land in Ward County, Texas, with onsite processing and truck loading facilities. We commenced construction of our Monahans mine in February of 2018 and commenced operations in October 2018. Our Monahans facility has a net book value of $228.8 million. Geographically, our Monahans facility is located at approximately 31° 39’ 32.53” N latitude and 102° 52’ 55.46” W longitude, is situated approximately three miles northeast of Monahans, Texas, and is accessible via Texas State Highway 115 and Interstate 20. The Midland International Air and Space Port is located approximated 40 miles east of the facility. The facility’s primary utilities include three phase power from natural gas from an interstate transmission line and groundwater from onsite wells, all of which are present in sufficient quantities to sustainably support a facility producing in excess of 5.5 million tons annually. The facility was designed with redundancies to provide enhanced reliability and minimize the potential for bottlenecks throughout the processing and loadout operation.
The Monahans facility has 148.3 million tons of associated proven reserves as of December 31, 2023. The sand deposits generally range from 60 to over 100 feet thick and consist of 40/70-mesh and 100-mesh sand, with an anticipated production mix of approximately 61% 40/70-mesh and approximately 39% 100-mesh. The crush strength of the sand mined at the facility is 7,000 to 8,000 PSI for 40/70-mesh and between 10,000 to 11,000 PSI for 100-mesh. Given the open-dune reserves and natural aquifer, sand is generally extracted from the mine through surface excavation through mining by electric dredge. Like the Kermit facilities, the Monahans facility was constructed with a modular design that facilitates future expansion opportunities. The Monahans facility has onsite transportation infrastructure capable of loading more than 35 trucks per hour.
The rights and access to the mineral reserves associated with our Monahans operations are secured under a lease agreement (the “Monahans Lease”) with Sealy Smith. Under the Monahans Lease, we are committed to pay royalties on product sold from that facility and are required to pay a minimum royalty of $1.0 million for any lease year following our IPO. We have received the material permits required to operate our Monahans facility from the TCEQ Air Permits Division, Ward County, MSHA and TxDOT. Please see “—Our Permits” for more information.
Our Reserves
Information concerning our material mining properties in this Annual Report has been prepared in accordance with the requirements of Subpart 1300 of Regulation S-K, which first became applicable to us for the fiscal year ended December 31, 2023. As used in this Annual Report, the terms “mineral resource,” “mineral reserve,” “proven mineral reserve” and “probable mineral reserve” are defined and used in accordance with Subpart 1300 of Regulation S-K.
49
We categorize our mineral reserves as proven or probable based on the standards set by our independent mining engineers and geologists, John T. Boyd Company. We estimate that we had a total of approximately 488.0 million tons of proven and probable mineral reserves as of December 31, 2023. As of December 31, 2023, we had approximately 300.7 million tons of proven mineral reserves and 36.9 million tons of probable recoverable mineral reserves associated with our Kermit facilities and approximately 148.3 million tons of proven mineral reserves and 2.2 million tons of probable recoverable mineral reserves associated with our Monahans facility. The quantity and nature of the mineral reserves at each of our properties are estimated by our internal geology department. We use drone surveys and three-dimensional models to regularly update our reserve estimates, making necessary adjustments for operations and mine plans at each location during the year.
Our internal reserve estimates are provided to John T. Boyd Company for review annually so that third-party approved additions or reductions can be made to our mineral reserves and mineral resource calculations due to ore extraction, additional drilling and delineation, property acquisitions and dispositions or quality adjustments. Before acquiring new mineral reserves, we perform surveying, drill core analysis and other tests to confirm the quantity and quality of the acquired mineral reserves. John T. Boyd Company reviewed our mineral reserves and mineral resources as of December 31, 2023. John T. Boyd is not affiliated with the Company nor any other entity that has an ownership, royalty, or other interest in the properties that are the subject of the technical report summaries.
We lease a portion of the mineral reserves associated with our Kermit facilities and all of the mineral reserves associated with our Monahans facilities. As of December 31, 2023, we owned approximately 44% of our mineral reserves and leased approximately 56% of our mineral reserves from third-party landowners at our Kermit facilities. To opine as to the economic viability of our mineral reserves, John T. Boyd Company reviewed our operating cost and revenue per ton data at the time of the proven reserve determination. The sand deposits at our facilities do not require crushing or extensive processing to eliminate clays or other contaminants, enabling us to cost-effectively produce high-quality proppant meeting API specifications.
Summary of Reserves
The following tables provide the tonnage and mesh size characteristics of the proven and probable mineral reserves associated with our Kermit and Monahans facilities as of December 31, 2023, based on $30.00 per ton. Since the commissioning of our wet plants in 2018 through the end of 2023, the actual process yield for both plants is approximately 90%. In general, for every 100 tons of run-of-mine (“ROM”) material fed into the plant, 90 tons of saleable product is produced. It should be noted that these achieved process yields are slightly different than the overall process yields used to estimate the frac sand resources and reserves, which are based on the results of drill hole sample testing at each property.
Kermit Facilities
|
|
Tons by Classification and Mesh Size (in thousands) |
|
|||||||||||||||||||||||||||||||||
|
|
Proven |
|
|
Probable |
|
|
By Mesh Size |
|
|||||||||||||||||||||||||||
Control |
|
40/70 |
|
|
70/140 |
|
|
Total |
|
|
40/70 |
|
|
70/140 |
|
|
Total |
|
|
40/70 |
|
|
70/140 |
|
|
Total |
|
|||||||||
Owned |
|
|
81,869 |
|
|
|
67,718 |
|
|
|
149,587 |
|
|
|
254 |
|
|
|
317 |
|
|
|
571 |
|
|
|
82,123 |
|
|
|
68,035 |
|
|
|
150,158 |
|
Leased |
|
|
70,709 |
|
|
|
80,410 |
|
|
|
151,119 |
|
|
|
16,215 |
|
|
|
20,066 |
|
|
|
36,281 |
|
|
|
86,924 |
|
|
|
100,476 |
|
|
|
187,400 |
|
Total |
|
|
152,578 |
|
|
|
148,128 |
|
|
|
300,706 |
|
|
|
16,469 |
|
|
|
20,383 |
|
|
|
36,852 |
|
|
|
169,047 |
|
|
|
168,511 |
|
|
|
337,558 |
|
Monahans Facility
|
|
Tons by Classification and Mesh Size (in thousands) |
|
|||||||||||||||||||||||||||||||||
|
|
Proven |
|
|
Probable |
|
|
By Mesh Size |
|
|||||||||||||||||||||||||||
Control |
|
40/70 |
|
|
70/140 |
|
|
Total |
|
|
40/70 |
|
|
70/140 |
|
|
Total |
|
|
40/70 |
|
|
70/140 |
|
|
Total |
|
|||||||||
Leased |
|
|
90,294 |
|
|
|
58,000 |
|
|
|
148,294 |
|
|
|
1,372 |
|
|
|
819 |
|
|
|
2,191 |
|
|
|
91,666 |
|
|
|
58,819 |
|
|
|
150,485 |
|
Combined Kermit and Monahans Facilities
The following table provides the tonnage and mesh size characteristics of the proven and probable mineral reserves associated with our Kermit and Monahans operations as of December 31, 2023, based on $30.00 per ton, presented on a combined basis.
|
|
Tons by Classification and Mesh Size (in thousands) |
|
|||||||||||||||||||||||||||||||||
|
|
Proven |
|
|
Probable |
|
|
By Mesh Size |
|
|||||||||||||||||||||||||||
Facilities |
|
40/70 |
|
|
70/140 |
|
|
Total |
|
|
40/70 |
|
|
70/140 |
|
|
Total |
|
|
40/70 |
|
|
70/140 |
|
|
Total |
|
|||||||||
Kermit |
|
|
152,578 |
|
|
|
148,128 |
|
|
|
300,706 |
|
|
|
16,469 |
|
|
|
20,383 |
|
|
|
36,852 |
|
|
|
169,047 |
|
|
|
168,511 |
|
|
|
337,558 |
|
Monahans |
|
|
90,294 |
|
|
|
58,000 |
|
|
|
148,294 |
|
|
|
1,372 |
|
|
|
819 |
|
|
|
2,191 |
|
|
|
91,666 |
|
|
|
58,819 |
|
|
|
150,485 |
|
Total |
|
|
242,872 |
|
|
|
206,128 |
|
|
|
449,000 |
|
|
|
17,841 |
|
|
|
21,202 |
|
|
|
39,043 |
|
|
|
260,713 |
|
|
|
227,330 |
|
|
|
488,043 |
|
50
Drilling density utilized by us to determine proven versus probable mineral reserves is based upon the relative characteristics of the mineral resource field evaluated, including the consistency and density of the mineral resource within the drilling core sample. The target drill-hole spacing utilized by John T. Boyd Company to estimate our proven and probable mineral reserves are as follows:
Material Assumptions
Estimates of frac sand reserves for our Kermit and Monahans operations were derived contemporaneously with estimates of frac sand resources for each property. To derive an estimate of saleable product tons (proven and probable frac sand reserves), the following modifying factors were applied to the in-place measured and indicated frac sand resources underlying the respective mine plan areas of each operation:
Further information can be found in Section 6.3.1 of our technical report summary prepared by John T. Boyd Company, which is filed as Exhibit 96.3 to this Annual Report.
Our Resources
A “mineral resource” is defined by Subpart 1300 of Regulation S-K as a concentration or occurrence of material of economic interest in or on the Earth’s crust in such form, grade or quality, and quantity that there are reasonable prospects for economic extraction. Further, mineral resource is a reasonable estimate of mineralization, taking into account relevant factors such as cut-off grade, likely mining dimensions, location or continuity, that, with the assumed and justifiable technical and economic conditions, is likely to, in whole or in part, become economically extractable. Subpart 1300 of Regulation S-K divides resources between “measured mineral resources” and “indicated mineral resources” and “inferred mineral resources,” which are defined as follows:
The target drill-hole spacing utilized by John T. Boyd Company to estimate our measured, indicated and inferred resources are as follows:
51
The following tables set forth the mineral resource estimates, exclusive of mineral reserves, associated with our Kermit and Monahans facilities as of December 31, 2023, based on $30.00 per ton. Since the commissioning of our wet plants in 2018 through the end of 2023, the actual process yield for both plants is approximately 90%. In general, for every 100 tons of ROM material fed into the plant, 90 tons of saleable product is produced. It should be noted that these achieved process yields are slightly different than the overall process yields used to estimate the frac sand resources and reserves, which are based on the results of drill hole sample testing at each property.
Kermit Facilities
|
|
|
|
|
|
|
|
Estimated In-Place Frac Sand Tons |
|
|||||||||||
|
|
|
|
|
|
|
|
(in thousands) |
|
|||||||||||
Resource Category |
|
Acres |
|
|
Average Sand Thickness (ft) |
|
|
Owned |
|
|
Leased |
|
|
Total |
|
|||||
Measured |
|
|
165 |
|
|
|
|
|
|
2,750 |
|
|
|
16,636 |
|
|
|
19,386 |
|
|
Indicated |
|
|
460 |
|
|
|
|
|
|
563 |
|
|
|
75,515 |
|
|
|
76,078 |
|
|
Measured + Indicated |
|
|
625 |
|
|
|
|
|
|
3,313 |
|
|
|
92,151 |
|
|
|
95,464 |
|
|
Inferred |
|
|
800 |
|
|
|
|
|
|
— |
|
|
|
75,076 |
|
|
|
75,076 |
|
|
Total |
|
|
1,425 |
|
|
|
74 |
|
|
|
3,313 |
|
|
|
167,227 |
|
|
|
170,540 |
|
Monahans Facility
|
|
|
|
|
|
|
|
Estimated In-Place Frac Sand Tons |
|
|||||||||||
|
|
|
|
|
|
|
|
(in thousands) |
|
|||||||||||
Resource Category |
|
Acres |
|
|
Average Sand Thickness (ft) |
|
|
Owned |
|
|
Leased |
|
|
Total |
|
|||||
Measured |
|
|
487 |
|
|
|
|
|
|
— |
|
|
|
71,730 |
|
|
|
71,730 |
|
|
Indicated |
|
|
785 |
|
|
|
|
|
|
— |
|
|
|
102,755 |
|
|
|
102,755 |
|
|
Measured + Indicated |
|
|
1,272 |
|
|
|
|
|
|
— |
|
|
|
174,485 |
|
|
|
174,485 |
|
|
Inferred |
|
|
8,908 |
|
|
|
|
|
|
— |
|
|
|
1,094,030 |
|
|
|
1,094,030 |
|
|
Total |
|
|
10,180 |
|
|
|
57 |
|
|
|
— |
|
|
|
1,268,515 |
|
|
|
1,268,515 |
|
As of December 31, 2023, our mineral resources are estimated at 1.439 billion tons (170.5 million tons at the Kermit facilities and 1.269 billion tons at the Monahans facility). As of December 31, 2023, we leased a portion of the resources associated with our Kermit facilities and all of the resources associated with our Monahans facility.
Material Assumptions
Estimates of in-place frac sand resources for the Kermit and Monahans operations were prepared by performing the following tasks:
52
Further information can be found in Section 6.2.1 of our technical report summary prepared by John T. Boyd Company, which is filed as Exhibit 96.3 to this Annual Report.
Comparisons
Kermit Facilities
|
|
Summary of Reserves (in thousands) |
||||||||||||
|
|
December 31, 2023 |
|
|
December 31, 2022 |
|
|
Amount Change 2023 vs. 2022 |
|
|
Percentage Change |
|||
|
|
Amount |
|
|
Amount |
|
|
|
|
|
|
|||
Proven |
|
|
300,706 |
|
|
|
188,000 |
|
|
|
112,706 |
|
|
60% |
Probable |
|
|
36,852 |
|
|
|
4,831 |
|
|
|
32,021 |
|
|
663% |
Total |
|
|
337,558 |
|
|
|
192,831 |
|
|
|
144,727 |
|
|
75% |
|
|
Summary of Resources (in thousands) |
||||||||||||
|
|
December 31, 2023 |
|
|
December 31, 2022 |
|
|
Amount Change 2023 vs. 2022 |
|
|
Percentage Change |
|||
|
|
Amount |
|
|
Amount |
|
|
|
|
|
|
|||
Measured |
|
|
19,386 |
|
|
|
9,700 |
|
|
|
9,686 |
|
|
100% |
Indicated |
|
|
76,078 |
|
|
|
95,390 |
|
|
|
(19,312 |
) |
|
-20% |
Inferred |
|
|
75,076 |
|
|
|
293,290 |
|
|
|
(218,214 |
) |
|
-74% |
Total |
|
|
170,540 |
|
|
|
398,380 |
|
|
|
(227,840 |
) |
|
-57% |
When comparing the Kermit mines’ estimated frac sand reserves as of December 31, 2023, with those reported as of December 31, 2022, we note a net increase. This increase is a direct result of converting a significant portion of the operations’ frac sand resources to frac sand reserves in order to support the expanded operational capacity of the Kermit mines. Depletion through ordinary mining operations and inventory sales was also considered and, when combined with the added reserves, resulted in a net increase of approximately 144.7 million tons of additional frac sand reserves at the Kermit mines.
Monahans Facility
|
|
Summary of Reserves (in thousands) |
||||||||||||
|
|
December 31, 2023 |
|
|
December 31, 2022 |
|
|
Amount Change 2023 vs. 2022 |
|
|
Percentage Change |
|||
|
|
Amount |
|
|
Amount |
|
|
|
|
|
|
|||
Proven |
|
|
148,294 |
|
|
|
113,507 |
|
|
|
34,787 |
|
|
31% |
Probable |
|
|
2,191 |
|
|
|
51,098 |
|
|
|
(48,907 |
) |
|
-96% |
Total |
|
|
150,485 |
|
|
|
164,605 |
|
|
|
(14,120 |
) |
|
-9% |
|
|
Summary of Resources (in thousands) |
||||||||||||
|
|
December 31, 2023 |
|
|
December 31, 2022 |
|
|
Amount Change 2023 vs. 2022 |
|
|
Percentage Change |
|||
|
|
Amount |
|
|
Amount |
|
|
|
|
|
|
|||
Measured |
|
|
71,730 |
|
|
|
64,144 |
|
|
|
7,586 |
|
|
12% |
Indicated |
|
|
102,755 |
|
|
|
108,726 |
|
|
|
(5,971 |
) |
|
-5% |
Inferred |
|
|
1,094,030 |
|
|
|
1,093,869 |
|
|
|
161 |
|
|
0% |
Total |
|
|
1,268,515 |
|
|
|
1,266,739 |
|
|
|
1,776 |
|
|
0% |
53
When comparing the Monahans mine’s estimated frac sand reserves as of December 31, 2023, with those reported as of December 31, 2022, we note a net decrease. This decrease is the result of depletion through ordinary mining operations and inventory sales, as well as minor reserve boundary reassessments. Together, these changes resulted in a net decrease of approximately 14.1 million tons in the frac sand reserves of the Monahans mine.
Further information can be found in Section 6.3.5 of our technical report summary prepared by John T. Boyd Company, which is filed as Exhibit 96.3 to this Annual Report.
Our Lease and Royalty Arrangements
We lease a portion of the mineral reserves associated with our Kermit operations and all of the mineral reserves associated with our Monahans operations. In December 2017, we entered into a royalty agreement with Sealy Smith in connection with certain leased property at the Kermit facilities. The royalty agreement associated with the Kermit facilities terminated on the date of our IPO, pursuant to the terms of the agreement. The rights and access to the mineral reserves associated with our Monahans operations are secured under the Monahans Lease with the Sealy Smith. Under the Monahans Lease, we are committed to pay royalties on product sold from that facility and are required to pay a minimum royalty of $1.0 million for any lease year following our IPO. Our royalty payments are included in our cost of sales.
Subsequent to December 31, 2023, we entered into a pooling agreement with the General Land Office of Texas (“GLO”) that establishes a pooled unit consisting of land we own in fee own and land we lease at the Kermit property. The pooling agreement has a current effective blended royalty rate of 5.83%. This pooling agreement increases our operational flexibility by establishing a framework to efficiently mine across our fee owned lands and leased lands interchangeably.
Our Permits
We have obtained numerous federal, state and local permits required for operations at our Kermit and Monahans facilities. The Kermit and Monahans operations are predominantly regulated by the TCEQ with respect to environmental compliance. The predominant permitting requirement is an active NSR permit for air pollution control. Both of our operations have a current NSR permit which is renewable next in 2028. Other permits held by our operations include Stormwater, Above Ground Storage Tank, Aggregate Production Operation, and a septic permit. A Spill Prevention, Control, and Countermeasure plan is also active at both locations.
While resources invested in securing permits are significant, this cost has not had a material adverse effect on our results of operations or financial condition. We cannot be certain that existing environmental laws and regulations will not be reinterpreted or revised or that new environmental laws and regulations will not be adopted or become applicable to us. Revised or additional environmental requirements that result in increased compliance costs or additional operating restrictions could have a material adverse effect on our business.
Item 3. Legal Proceedings.
From time to time we may be involved in litigation relating to claims arising out of our operations in the normal course of business. The disclosure called for by this Part I, Item 3 regarding our legal proceedings is incorporated by reference herein from Part II, Item 8. Note 8 - Commitments and Contingencies - Litigation of the notes to the consolidated financial statements in this Annual Report.
Item 4. Mine Safety Disclosures.
Information concerning mine safety violations or other regulatory matters required by Section 1503(a) of the Dodd-Frank Wall Street Reform and Consumer Protection Act and Item 104 of Regulation S-K (17 C.F.R. Section 229.104) is included in Exhibit 95.1 to this Annual Report.
54
PART II
Item 5. Market for Registrant’s Common Equity, Related Stockholder Matters and Issuer Purchases of Equity Securities.
Market Information
Our Common Stock is listed on the New York Stock Exchange under the symbol "AESI."
Holders of Record
As of the close of business on February 21, 2024, there were 40 record holders of our Common Stock. A substantially greater number of holders of our Common Stock are “street name” or beneficial holders, whose shares of record are held by banks, brokers, and other financial institutions.
Dividend Practice
We commenced paying cash distributions in December 2021 and intend to continue to recommend to our Board that we regularly return capital to our stockholders in the future through a dividend framework that will be communicated to stockholders in the future. The declaration and payment of future dividends to holders of our Common Stock will be at the discretion of our Board and will depend upon many factors, including our financial condition, earnings, legal requirements, capital allocation strategy, restrictions in our debt agreements and other factors our Board deems relevant. Although we do not currently have plans to reduce or suspend our dividend, there is no assurance that we will pay any cash dividends on our Common Stock in the future.
Performance Graph
The information contained in this Performance Graph section shall not be deemed to be "soliciting material" or "filed" or incorporated by reference in future filings with the SEC, or subject to the liabilities of Section 18 of the Exchange Act, except to the extent that we specifically incorporate it by reference into a document filed under the Securities Act or the Exchange Act. The share price performance shown on the graph is not necessarily indicative of future price performance.
The graph below compares the cumulative total stockholder return on our Common Stock to the cumulative total return on the Russell 2000 index, VanEck Oil Services index, PHLX Oil Service index, Standard and Poor’s Energy index, and the Standard and Poor’s SmallCap 600 index, in each case assuming $100 was invested on March 8, 2023. We elected to include the VanEck Oil Services index, PHLX Oil Service index, and Standard and Poor’s Energy index because a number of companies in these indexes are included in the custom peer group used to determine relative total stockholder return performance share units that we have granted to employees.
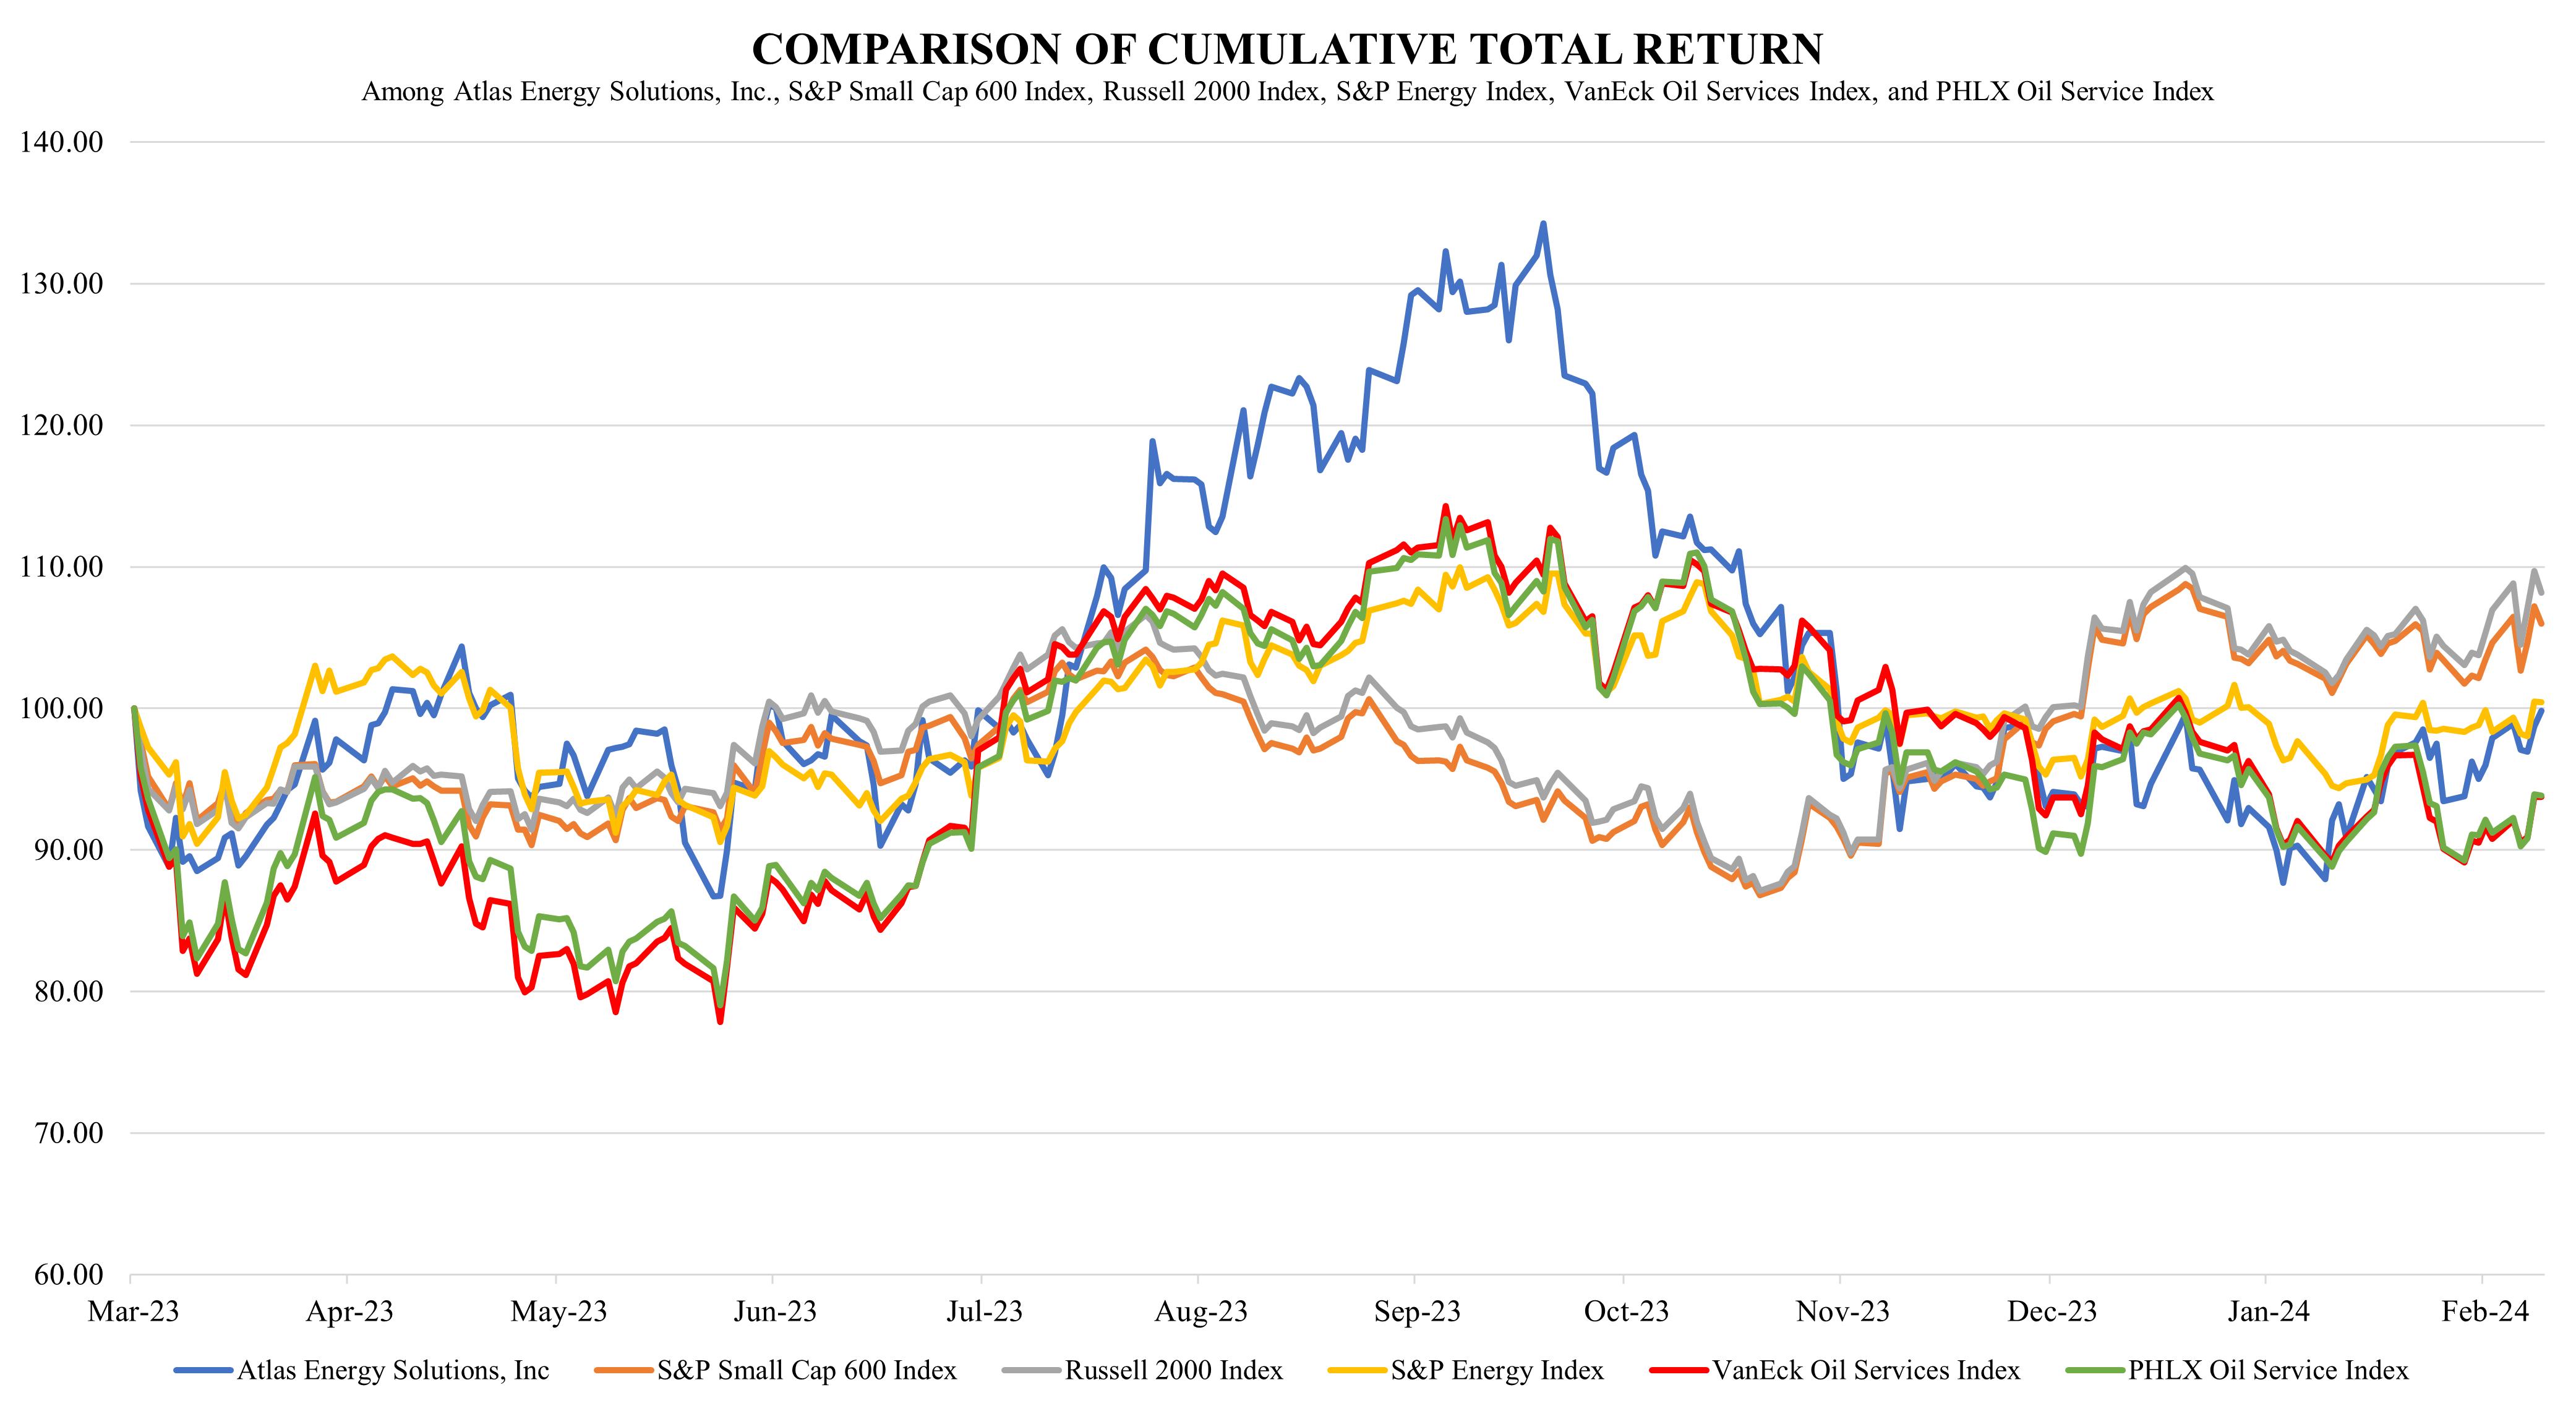
55
Use of Proceeds
On March 8, 2023, Old Atlas’s Registration Statement on Form S-1, as amended (File No. 333-269488), relating to the Company’s initial public offering of 18,000,000 shares of Old Atlas Class A Common Stock at a price to the public of $18.00 per share, was declared effective by the SEC. The IPO was completed on March 13, 2023. Goldman Sachs & Co. LLC, BofA Securities, Inc. and Piper Sandler & Co. acted as lead book-running managers for the IPO. RBC Capital Markets, LLC, Barclays Capital Inc. and Citigroup Global Markets Inc. acted as book-running managers. Raymond James & Associates, Inc., Johnson Rice & Company LLC, Stephens Inc., Capital One Securities, Inc., PEP Advisory LLC and Drexel Hamilton, LLC acted as co-managers for the IPO. The IPO generated net proceeds of approximately $291.2 million, after deducting $20.6 million of underwriting discounts and commissions, $5.9 million of current offering costs in 2023, and $6.3 million in offering costs paid in 2022 that were recorded to other long-term assets on the consolidated balance sheets as of December 31, 2022.
Old Atlas contributed all of the net proceeds from the IPO to Atlas Operating in exchange for Operating Units, and Atlas Operating further contributed the net proceeds to Atlas LLC. No payments were made to our directors, officers or their associates, to holders of 10% or more of any class of our equity securities or to our affiliates in connection with the issuance and sale of the securities registered. Atlas LLC has used approximately $183.7 million of the net proceeds from the IPO to fund construction of the Dune Express, and intends to use an additional approximately $104.2 million of the net proceeds from the IPO for further construction of the Dune Express. As of December 31, 2023, the Company has retained approximately $3.3 million of the net proceeds from the IPO to use for future general corporate purposes. No payments for any offering expenses were made directly or indirectly to (i) any of our officers or directors or their associates, (ii) any persons owning 10% or more of any class of our equity securities or (iii) any of our affiliates.
Item 6. [Reserved]
56
Item 7. Management’s Discussion and Analysis of Financial Condition and Results of Operations.
The following discussion and analysis of our financial condition and results of operations should be read together with Item 1, “Business,” and the Consolidated Financial Statements and the related notes in Item 8 of this Annual Report. For the purposes of this discussion, references to “Atlas Inc.” are to AESI Holdings Inc. (f/k/a Atlas Energy Solutions Inc.) for periods prior to the completion of the Up-C Simplification, and to Atlas Energy Solutions Inc. (f/k/a New Atlas HoldCo Inc.) for periods subsequent to the Up-C Simplification. References to the “Company,” “we,” “us,” “our” and like expressions are to Atlas Inc. together with its subsidiaries.
This discussion contains forward-looking statements as a result of many factors, including those set forth under the section titled “Cautionary Statement Regarding Forward-Looking Statements” and Item 1A. “Risk Factors,” and elsewhere in this Annual Report. These statements are based on current expectations and assumptions that are subject to risks and uncertainties. Actual results could differ materially from those discussed in or implied by forward-looking statements. Factors that could cause or contribute to these differences include those discussed below and elsewhere in this Annual Report, particularly in Item 1A. “Risk Factors.” We do not undertake any obligation to publicly update any forward-looking statements except as otherwise required by applicable law.
We use Adjusted EBITDA, Adjusted EBITDA Margin, Adjusted Free Cash Flow, Adjusted EBITDA less Capital Expenditures, Adjusted Free Cash Flow Margin, Adjusted EBITDA less Capital Expenditures Margin, Adjusted Free Cash Flow Conversion, Contribution Margin, Maintenance Capital Expenditures and Net Debt herein as non-GAAP measures of our financial performance. For further discussion of Contribution Margin, EBITDA, Adjusted EBITDA and Adjusted Free Cash Flow, see the section titled “Non-GAAP Financial Measures” in this Item 7 of this Annual Report. We define various terms to simplify the presentation of information in this Annual Report. All share amounts are presented in thousands.
Overview
We are a low-cost producer of high-quality, locally sourced 100 mesh and 40/70 sand used as a proppant during the well completion process. One hundred percent of Atlas LLC’s sand reserves are located in Winkler and Ward Counties, Texas, within the Permian Basin, and our operations consist of proppant production and processing facilities, including two facilities near Kermit, Texas and a third facility near Monahans, Texas. As of December 31, 2023, our Kermit and Monahans facilities have a total combined annual production capacity of 16.5 million tons.
We also operate a logistics platform that is designed to increase the efficiency, safety and sustainability of the oil and natural gas industry within the Permian Basin. This includes our fleet of fit-for-purpose trucks and trailers and will include the Dune Express, an overland conveyor infrastructure solution currently under construction.
Our Predecessor
The predecessor of Atlas Inc. consists of Atlas LLC and certain of its wholly-owned subsidiaries: Atlas Sand Employee Holding Company, LLC; Atlas Sand Employee Company, LLC; Atlas OLC Employee Company, LLC; Atlas Construction Employee Company, LLC; Fountainhead Logistics Employee Company, LLC; Atlas Sand Construction, LLC; OLC Kermit, LLC; OLC Monahans, LLC; and Fountainhead Logistics, LLC on a consolidated basis (all of which we refer to collectively as “Atlas Predecessor”). Historical periods for Atlas Predecessor are presented on a consolidated basis given the common control ownership. Unless otherwise indicated, the historical consolidated financial information included in this Annual Report presents the historical financial information of Atlas Predecessor. Historical consolidated financial information is not indicative of the results that may be expected in any future periods.
Recent Developments
Hi-Crush Acquisition
On February 26, 2024, Atlas entered into an Agreement and Plan of Merger (the “Merger Agreement”) with Hi-Crush, pursuant to which Atlas will acquire substantially all of Hi-Crush’s Permian Basin proppant production and North American logistics businesses and operations (the “Hi-Crush Transaction”).
Under the terms and conditions of the Merger Agreement, which has an economic effective time of 11:59 p.m. CT on February 29, 2024, the aggregate consideration to be paid to the Hi-Crush stockholders in the Hi-Crush Transaction will consist of (i) cash consideration of $150 million at the closing of the Hi-Crush Transaction (the “Closing”), (ii) 9.7 million shares of Atlas’s Common Stock, par value $0.01 per share, issued at Closing (the “Common Stock,” and such issuance, the “Stock Consideration”), and (iii) a secured PIK toggle seller note in an initial aggregate principal amount of $125 million with a final maturity date of January 31, 2026 (the “Seller Note”), in each case, subject to customary closing adjustments. Upon consummation of the Hi-Crush Transaction, the Hi-Crush stockholders will collectively own approximately 8.8% of the Company’s outstanding Common Stock. Both the cash consideration and the original principal amount of the Seller Note are subject to revision for customary closing adjustments.
57
The Merger Agreement and the Hi-Crush Transaction have been unanimously approved by a Special Committee of the Atlas board of directors composed of a majority of independent directors, as well as the boards of directors of both companies. The completion of the Hi-Crush Transaction is subject to the satisfaction or waiver of customary closing conditions, including Hi-Crush’s delivery of a written consent approving the Hi-Crush Transaction signed by Hi-Crush stockholders holding at least 95% of the voting power. The Hi-Crush Transaction is expected to close in the first quarter of 2024.
Corporate Developments
On March 13, 2023, Old Atlas completed its initial public offering of 18,000,000 shares of Old Atlas Class A Common Stock at a price of $18.00 per share. The IPO generated $324.0 million of gross proceeds and net proceeds of approximately $291.2 million, after deducting underwriter discounts and commissions and estimated offering costs. In connection with the IPO, pursuant to a master reorganization agreement dated March 8, 2023, by and among Old Atlas, ASMC, Atlas LLC, Holdings, Atlas Operating, Holdings II, ASMC II, and Atlas Sand Merger Sub, LLC, a Delaware limited liability company, Old Atlas and the parties thereto completed certain restructuring transactions. As a result of these restructuring transactions, Atlas Operating became the wholly-owned operating subsidiary of Old Atlas, Atlas LLC became a wholly-owned subsidiary of Atlas Operating, and Atlas LLC continued to own all of the Company’s operating assets.
On October 2, 2023, Old Atlas and the Company completed the Up-C Simplification as contemplated by the Master Reorganization Agreement in order to, among other things, reorganize under a new public holding company and eliminate Old Atlas’s “up-C” and dual-class stock structure. Pursuant to the Master Reorganization Agreement, (a) PubCo Merger Sub merged with and into Old Atlas, as a result of which (i) each share of Old Atlas Class A Common Stock then issued and outstanding was exchanged for one share of Common Stock of the Company, (ii) all of the shares of Old Atlas Class B Common Stock then issued and outstanding were surrendered and cancelled for no consideration and (iii) Old Atlas survived the PubCo Merger as a direct, wholly-owned subsidiary of the Company; and (b) Opco Merger Sub merged with and into Atlas Operating, as a result of which (i) each Operating Unit then issued and outstanding, other than those Operating Units held by Old Atlas, was exchanged for one share of Common Stock of the Company and (ii) Atlas Operating became a wholly-owned subsidiary of the Company.
After completion of the Up-C Simplification, the Company replaced Old Atlas as the publicly held entity and, through its subsidiaries, conducts all of the operations previously conducted by Old Atlas, and Old Atlas remains the managing member of Atlas Operating.
Operational Developments
We commenced or completed several significant operational developments over the course of 2023. First, we expanded our Kermit production capacity by adding a new facility with 5.5 million tons of annual production capacity, for a combined total production capacity of 16.5 million tons annually from all three of our facilities as of December 31, 2023.
We also expanded our logistics offering. As of February 27, 2024, we added 120 trucks and 323 trailers to our fit-for-purpose trucking fleet, which we expect to improve our productivity, as measured by tons per truck that can be delivered daily, compared to the throughput performance of traditional trucking assets.
Finally, we broke ground on construction of the Dune Express in March of 2023. As of December 31, 2023, 90% of equipment and materials and 80% of installation and services for construction of the Dune Express have been ordered and contracted. Additionally, we have cleared, graded and laid caliche on vast majority of the right-of-way and have taken delivery of approximately 150 conveyor belt sections, equivalent to approximately 57 miles of total conveyor belt and over 100 miles of fiberoptic cable. The Dune Express is expected to be in service during the fourth quarter of 2024.
Financial Developments
On July 31, 2023, Atlas LLC entered into the 2023 Term Loan Credit Agreement with Stonebriar, as administrative agent and initial lender, pursuant to which Stonebriar extended Atlas LLC a term loan credit facility comprised of a $180.0 million single advance term loan that was made on July 31, 2023, and commitments to provide up to $100.0 million of delayed draw term loans.
The Initial Term Loan is payable in eighty-four consecutive monthly installments and a final payment of the remaining outstanding principal balance at maturity. The Initial Term Loan has a final maturity date of August 1, 2030. The Initial Term Loan bears interest at a rate equal to 9.50% per annum.
Each delayed draw term loan under the 2023 Term Loan Credit Facility other than the term loan that may be incurred in connection with the closing of the Hi-Crush Transaction (“DDT Loans”) will be payable in equal monthly installments, with the monthly installments comprising 80% of the delayed draw term loan and a final payment of the remaining 20% of the outstanding principal balance due at maturity, unless earlier prepaid. The DDT Loans will bear interest at a rate equal to the applicable Term SOFR Rate as of each Delayed Draw Funding Date (each as defined in the 2023 Term Loan Credit Agreement) plus 5.95% per annum. All monthly installments with respect to the Initial Term Loan and the DDT Loans payable on or prior to January 1, 2025 will be interest only. See Note 7—Debt to the consolidated financial statements for more information.
58
In connection with the Hi-Crush Transaction in Q1 of 2024, Atlas LLC amended the 2023 ABL Credit Facility and the 2023 Term Loan Credit Facility. The 2023 ABL Credit Facility amendment, among other things and subject to certain conditions set forth therein, provides for an increase to the revolving credit commitment amount from $50.0 million to $125.0 million and an extension of the maturity date to February 26, 2029. The 2023 Term Loan Credit Facility amendment, among other things, provides for an incremental delayed draw term loan facility in the aggregate principal amount of up to $150.0 million at an interest rate expected to be approximately 10.5%. Furthermore, concurrently with the closing of the Hi-Crush Transaction, the Company will enter into the Seller Note. See Note 15—Subsequent Events to the consolidated financial statements for more information.
Recent Trends and Outlook
Drilling and completions activities for oil and gas are highly correlated to oil and gas prices. The price for West Texas Intermediate (“WTI”) crude oil averaged $77.61 per barrel (“Bbl”) in 2023, as compared to $94.33 per Bbl in 2022, representing a decrease of more than 15%. Global oil prices declined over the course of the year, reflecting a more balanced market, led by declining macroeconomic sentiment and decreased global oil demand, despite the ongoing geopolitical tensions related to the conflicts in both Europe and the Middle East. As a result, oilfield activity levels remain relatively muted, or marginally lower, as we exited the year. The Permian Basin drilling rig count declined by 45 rigs year-over-year, ending the period at 307 active rigs. Despite the slowdown in completions activity, we anticipate a tightening supply dynamic due to lower global oil supply from Middle East resulting from geopolitical tensions, which may lead to supply chain disruptions, and OPEC+ rational guardianship, which could lead to increased activity levels during 2024 at higher commodity price levels.
Notwithstanding the volatility in the oil and gas markets, there are two potential positive long-term trends developing in the market:
Despite some softness in current drilling and completions activity, the Permian Basin proppant market remains healthy. While the available Permian Basin proppant supply experienced marginal growth during the course of 2023, we believe the market remains balanced with potential to tighten up in 2024 with increased activity as demand for more Permian barrels is needed to balance the global oil markets.
In addition, the Permian Basin experienced a significant amount of consolidation among E&P companies in 2023. We believe our enhanced scale due to the recent addition of our new Kermit facility leaves us well-positioned to match the growing needs of our high-quality customer base, as E&P companies continue to scale up their operations.
How We Generate Revenue
We generate revenue by mining, processing and distributing proppant that our customers use in connection with their operations. We sell proppant to our customers under supply agreements or as spot sales at prevailing market rates, which is dependent upon the cost of producing proppant, the proppant volumes sold and the desired margin and prevailing market conditions.
Revenues also include charges for sand logistics services provided to our customers. Our logistics service revenue fluctuates based on several factors, including the volume of proppant transported, the distance between our facilities and our customers, and prevailing freight rates. Revenue is generally recognized as products are delivered in accordance with the contract.
Some of our contracts contain shortfall provisions that calculate agreed upon fees that are billed when the customer does not satisfy the minimum purchases over a period of time defined in each contract.
59
Costs of Conducting Our Business
We incur operating costs primarily from direct and indirect labor, freight charges, utility costs, fuel and maintenance costs and royalties. We incur labor costs associated with employees at our Kermit and Monahans facilities, which represent the most significant cost of converting proppant to finished product. Our Kermit and Monahans facilities undergo maintenance to minimize unscheduled downtime and ensure the ongoing quality of our proppant and ability to meet customer demands. We may incur variable utility costs in connection with the operation of our processing facilities, primarily natural gas and electricity, which are both susceptible to market fluctuations. We lease equipment in many areas of our operations, including our proppant production hauling equipment. We incur variable royalty expense and/or delay rentals related to our agreements with the owners of our reserves. In addition, other costs including overhead allocation, depreciation and depletion are capitalized as a component of inventory and are reflected in cost of sales when inventory is sold. Our logistics services incur operating costs primarily composed of variable freight charges from trucking companies' delivery of sand to customer wellsites, equipment leases, direct and indirect labor, fuel and maintenance costs and royalties.
How We Evaluate Our Operations
Non-GAAP Financial Measures
Adjusted EBITDA, Adjusted EBITDA Margin, Adjusted Free Cash Flow, Adjusted EBITDA less Capital Expenditures, Adjusted Free Cash Flow Margin, Adjusted EBITDA less Capital Expenditures Margin, Adjusted Free Cash Flow Conversion, Contribution Margin, Maintenance Capital Expenditures and Net Debt are non-GAAP supplemental financial measures used by our management and by external users of our financial statements such as investors, research analysts and others, in the case of Adjusted EBITDA, to assess our operating performance on a consistent basis across periods by removing the effects of development activities, provide views on capital resources available to organically fund growth projects and, in the case of Adjusted Free Cash Flow and Adjusted EBITDA less Capital Expenditures, assess the financial performance of our assets and their ability to sustain dividends or reinvest to organically fund growth projects over the long term without regard to financing methods, capital structure or historical cost basis.
We define Adjusted EBITDA as net income before depreciation, depletion and accretion, interest expense, income tax expense, stock and unit-based compensation, loss on extinguishment of debt, unrealized commodity derivative gain (loss), and non-recurring transaction costs. Management believes Adjusted EBITDA is useful because it allows them to more effectively evaluate our operating performance and compare the results of our operations from period to period and against our peers without regard to our financing methods or capital structure. We exclude the items listed above from net income in arriving at Adjusted EBITDA because these amounts can vary substantially from company to company within our industry depending upon accounting methods and book values of assets, capital structures and the method by which the assets were acquired.
We define Adjusted EBITDA Margin as Adjusted EBITDA divided by total sales.
We define Adjusted Free Cash Flow as Adjusted EBITDA less Maintenance Capital Expenditures. We define Adjusted EBITDA less Capital Expenditures as Adjusted EBITDA less net cash used in investing activities. We believe that Adjusted Free Cash
Flow and Adjusted EBITDA less Capital Expenditures are useful to investors as they provide measures of the ability of our business to generate cash.
We define Adjusted Free Cash Flow Margin as Adjusted Free Cash Flow divided by total sales.
We define Adjusted EBITDA less Capital Expenditures Margin as Adjusted EBITDA less Capital Expenditures divided by total sales.
We define Adjusted Free Cash Flow Conversion as Adjusted Free Cash Flow divided by Adjusted EBITDA.
We define Contribution Margin as gross profit plus depreciation, depletion and accretion expense.
We define Maintenance Capital Expenditures as capital expenditures excluding growth capital expenditures.
We define Net Debt as total debt, net of discount and deferred financing costs, plus finance right-of-use lease liabilities, less cash and cash equivalents.
Adjusted EBITDA, Adjusted EBITDA Margin, Adjusted Free Cash Flow, Adjusted EBITDA less Capital Expenditures, Adjusted Free Cash Flow Margin, Adjusted EBITDA less Capital Expenditures Margin, Adjusted Free Cash Flow Conversion, Contribution Margin, Maintenance Capital Expenditures and Net Debt do not represent and should not be considered alternatives to, or more meaningful than, net income, income from operations, net cash provided by operating activities or any other measure of financial performance presented in accordance with GAAP as measures of our financial performance. Adjusted EBITDA, Adjusted Free Cash Flow, and Adjusted EBITDA less Capital Expenditures have important limitations as analytical tools because they exclude some but not all items that affect net income, the most directly comparable GAAP financial measure. Our computation of Adjusted EBITDA, Adjusted EBITDA Margin, Adjusted Free Cash Flow, Adjusted Free Cash Flow Margin, Adjusted EBITDA less Capital Expenditures, Adjusted EBITDA less Capital Expenditures Margin, Adjusted Free Cash Flow Conversion, Contribution Margin, Maintenance Capital Expenditures and Net Debt may differ from computations of similarly titled measures of other companies.
60
The following table presents a reconciliation of Adjusted EBITDA, Adjusted EBITDA Margin, Adjusted Free Cash Flow, Adjusted EBITDA less Capital Expenditures, Adjusted Free Cash Flow Margin, Adjusted EBITDA less Capital Expenditures Margin, Adjusted Free Cash Flow Conversion, Contribution Margin, Maintenance Capital Expenditures and Net Debt to the most directly comparable GAAP financial measure for the periods indicated.
|
|
|
For the Year Ended |
|
|||||||||
|
|
|
December 31, |
|
|||||||||
|
|
|
2023 |
|
|
2022 |
|
|
2021 |
|
|||
|
|
|
(In thousands) |
|
|||||||||
Net income (1) |
|
|
$ |
226,493 |
|
|
$ |
217,006 |
|
|
$ |
4,258 |
|
Depreciation, depletion and accretion expense |
|
|
|
41,634 |
|
|
|
28,617 |
|
|
|
24,604 |
|
Interest expense |
|
|
|
17,452 |
|
|
|
15,803 |
|
|
|
30,290 |
|
Income tax expense |
|
|
|
31,378 |
|
|
|
1,856 |
|
|
|
831 |
|
EBITDA |
|
|
$ |
316,957 |
|
|
$ |
263,282 |
|
|
$ |
59,983 |
|
Stock and unit-based compensation |
|
|
|
7,409 |
|
|
|
678 |
|
|
|
129 |
|
Loss on extinguishment of debt |
|
|
|
— |
|
|
|
— |
|
|
|
11,922 |
|
Unrealized commodity derivative (gain) loss |
|
|
|
— |
|
|
|
66 |
|
|
|
(66 |
) |
Non-recurring transaction costs |
|
|
|
5,289 |
|
|
|
— |
|
|
|
— |
|
Adjusted EBITDA |
|
|
$ |
329,655 |
|
|
$ |
264,026 |
|
|
$ |
71,968 |
|
Maintenance Capital Expenditures |
|
|
$ |
38,524 |
|
|
$ |
35,473 |
|
|
$ |
7,715 |
|
Adjusted Free Cash Flow |
|
|
$ |
291,131 |
|
|
$ |
228,553 |
|
|
$ |
64,253 |
|
|
|
|
For the Year Ended |
|
|||||||||
|
|
|
December 31, |
|
|||||||||
|
|
|
2023 |
|
|
2022 |
|
|
2021 |
|
|||
|
|
|
(In thousands) |
|
|||||||||
Net income (1) |
|
|
$ |
226,493 |
|
|
$ |
217,006 |
|
|
$ |
4,258 |
|
Depreciation, depletion and accretion expense |
|
|
|
41,634 |
|
|
|
28,617 |
|
|
|
24,604 |
|
Interest expense |
|
|
|
17,452 |
|
|
|
15,803 |
|
|
|
30,290 |
|
Income tax expense |
|
|
|
31,378 |
|
|
|
1,856 |
|
|
|
831 |
|
EBITDA |
|
|
$ |
316,957 |
|
|
$ |
263,282 |
|
|
$ |
59,983 |
|
Stock and unit-based compensation expense |
|
|
|
7,409 |
|
|
|
678 |
|
|
|
129 |
|
Loss on extinguishment of debt |
|
|
|
— |
|
|
|
— |
|
|
|
11,922 |
|
Unrealized commodity derivative (gain) loss |
|
|
|
— |
|
|
|
66 |
|
|
|
(66 |
) |
Non-recurring transaction costs |
|
|
|
5,289 |
|
|
|
— |
|
|
|
— |
|
Adjusted EBITDA |
|
|
$ |
329,655 |
|
|
$ |
264,026 |
|
|
$ |
71,968 |
|
Capital expenditures |
|
|
$ |
365,486 |
|
|
$ |
89,592 |
|
|
$ |
19,371 |
|
Adjusted EBITDA less Capital Expenditures |
|
|
$ |
(35,831 |
) |
|
$ |
174,434 |
|
|
$ |
52,597 |
|
61
|
|
|
|
For the Year Ended |
|
|||||||||
|
|
|
|
December 31, |
|
|||||||||
|
|
|
|
2023 |
|
|
2022 |
|
|
2021 |
|
|||
|
|
|
|
(In thousands) |
|
|||||||||
Net cash provided by operating activities |
|
|
|
$ |
299,027 |
|
|
$ |
206,012 |
|
|
$ |
21,356 |
|
Repayment of paid-in-kind interest borrowings |
|
|
|
|
— |
|
|
|
— |
|
|
|
22,233 |
|
Current income tax expense (benefit)(2) |
|
|
|
|
2,177 |
|
|
|
1,858 |
|
|
|
471 |
|
Change in operating assets and liabilities |
|
|
|
|
6,947 |
|
|
|
41,774 |
|
|
|
8,622 |
|
Cash interest expense(2) |
|
|
|
|
16,354 |
|
|
|
14,904 |
|
|
|
19,173 |
|
Maintenance Capital Expenditures(2) |
|
|
|
|
(38,524 |
) |
|
|
(35,473 |
) |
|
|
(7,715 |
) |
Non-recurring transaction costs |
|
|
|
|
5,289 |
|
|
|
— |
|
|
|
— |
|
Other |
|
|
|
|
(139 |
) |
|
|
(522 |
) |
|
|
113 |
|
Adjusted Free Cash Flow |
|
|
|
$ |
291,131 |
|
|
$ |
228,553 |
|
|
$ |
64,253 |
|
|
|
|
|
|
|
|
|
|
|
|
|
|||
|
|
|
|
For the Year Ended |
|
|||||||||
|
|
|
|
December 31, |
|
|||||||||
|
|
|
|
2023 |
|
|
2022 |
|
|
2021 |
|
|||
|
|
|
|
(In thousands, except percentages) |
|
|||||||||
Net cash provided by operating activities |
|
|
|
$ |
299,027 |
|
|
$ |
206,012 |
|
|
$ |
21,356 |
|
Repayment of paid-in-kind interest borrowings |
|
|
|
|
— |
|
|
|
— |
|
|
|
22,233 |
|
Current income tax expense (benefit)(2) |
|
|
|
|
2,177 |
|
|
|
1,858 |
|
|
|
471 |
|
Change in operating assets and liabilities |
|
|
|
|
6,947 |
|
|
|
41,774 |
|
|
|
8,622 |
|
Cash interest expense(2) |
|
|
|
|
16,354 |
|
|
|
14,904 |
|
|
|
19,173 |
|
Capital expenditures |
|
|
|
|
(365,486 |
) |
|
|
(89,592 |
) |
|
|
(19,371 |
) |
Non-recurring transaction costs |
|
|
|
|
5,289 |
|
|
|
— |
|
|
|
— |
|
Other |
|
|
|
|
(139 |
) |
|
|
(522 |
) |
|
|
113 |
|
Adjusted EBITDA less Capital Expenditures |
|
|
|
$ |
(35,831 |
) |
|
$ |
174,434 |
|
|
$ |
52,597 |
|
Adjusted EBITDA Margin |
|
|
|
|
53.7 |
% |
|
|
54.7 |
% |
|
|
41.7 |
% |
Adjusted EBITDA less Capital Expenditure Margin |
|
|
|
|
(5.8 |
)% |
|
|
36.1 |
% |
|
|
30.5 |
% |
Adjusted Free Cash Flow Margin |
|
|
|
|
47.4 |
% |
|
|
47.3 |
% |
|
|
37.3 |
% |
Adjusted Free Cash Flow Conversion |
|
|
|
|
88.3 |
% |
|
|
86.6 |
% |
|
|
89.3 |
% |
|
|
For the Year Ended |
|
|||||||||
|
|
December 31, |
|
|||||||||
|
|
2023 |
|
|
2022 |
|
|
2021 |
|
|||
|
|
(In thousands) |
|
|||||||||
Gross Profit |
|
$ |
313,766 |
|
|
$ |
256,308 |
|
|
$ |
64,067 |
|
Depreciation, depletion and accretion expense |
|
|
39,798 |
|
|
|
27,498 |
|
|
|
23,681 |
|
Contribution Margin |
|
$ |
353,564 |
|
|
$ |
283,806 |
|
|
$ |
87,748 |
|
(1) Atlas Energy Solutions Inc. is a corporation and is subject to U.S. federal income tax. Atlas LLC has either been treated as a disregarded entity or a partnership for income tax purposes and, therefore, was not subject to U.S. federal income tax at an entity level during the periods presented. As a result, the consolidated net income in our historical financial statements does not reflect the tax expense we would have incurred if we had been subject to U.S. federal income tax at an entity level during such periods.
(2) A reconciliation of the adjustment of these items used to calculate Adjusted Free Cash Flow to the Consolidated Financial Statements is included below.
62
|
|
|
For the Year Ended |
|
|||||||||
|
|
|
December 31, |
|
|||||||||
|
|
|
2023 |
|
|
2022 |
|
|
2021 |
|
|||
|
|
(In thousands) |
|
||||||||||
Current tax expense reconciliation: |
|
|
|
|
|
|
|
|
|
|
|||
Income tax expense |
|
|
$ |
31,378 |
|
|
$ |
1,856 |
|
|
$ |
831 |
|
Less: deferred tax expense |
|
|
|
(29,201 |
) |
|
|
2 |
|
|
|
(360 |
) |
Current income tax expense (benefit) |
|
|
$ |
2,177 |
|
|
$ |
1,858 |
|
|
$ |
471 |
|
Cash interest expense reconciliation: |
|
|
|
|
|
|
|
|
|
|
|||
Interest expense, net, excluding loss on extinguishment of debt |
|
|
$ |
7,689 |
|
|
$ |
15,760 |
|
|
$ |
30,276 |
|
Less: Interest paid-in-kind through issuance of additional term loans |
|
|
|
— |
|
|
|
— |
|
|
|
(3,039 |
) |
Less: Amortization of debt discount |
|
|
|
(761 |
) |
|
|
(457 |
) |
|
|
(7,320 |
) |
Less: Amortization of deferred financing costs |
|
|
|
(337 |
) |
|
|
(442 |
) |
|
|
(739 |
) |
Less: Interest income |
|
|
|
9,763 |
|
|
|
43 |
|
|
|
14 |
|
Less: Other |
|
|
|
— |
|
|
|
— |
|
|
|
(19 |
) |
Cash interest expense |
|
|
$ |
16,354 |
|
|
$ |
14,904 |
|
|
$ |
19,173 |
|
Maintenance Capital Expenditures, accrual basis reconciliation: |
|
|
|
|
|
|
|
|
|
|
|||
Purchases of property, plant and equipment |
|
|
$ |
365,486 |
|
|
$ |
89,592 |
|
|
$ |
19,371 |
|
Changes in operating assets and liabilities associated with investing activities(3) |
|
|
|
66,132 |
|
|
|
20,747 |
|
|
|
2,362 |
|
Less: Growth capital expenditures and capital lease additions |
|
|
|
(393,094 |
) |
|
|
(74,866 |
) |
|
|
(14,018 |
) |
Maintenance Capital Expenditures, accrual basis |
|
|
$ |
38,524 |
|
|
$ |
35,473 |
|
|
$ |
7,715 |
|
|
|
For the Year Ended |
|
|||||||||
|
|
December 31, |
|
|||||||||
|
|
2023 |
|
|
2022 |
|
|
2021 |
|
|||
|
|
(In thousands) |
|
|||||||||
Total Debt |
|
$ |
172,820 |
|
|
$ |
147,174 |
|
|
$ |
175,275 |
|
Discount and deferred financing costs |
|
|
7,180 |
|
|
|
1,821 |
|
|
|
2,264 |
|
Finance right-of-use lease liabilities(4) |
|
|
422 |
|
|
|
20,155 |
|
|
|
— |
|
Capital lease liabilities(4) |
|
|
— |
|
|
|
— |
|
|
|
635 |
|
Cash and cash equivalents |
|
|
210,174 |
|
|
|
82,010 |
|
|
|
40,401 |
|
Net Debt |
|
$ |
(29,752 |
) |
|
$ |
87,140 |
|
|
$ |
137,773 |
|
(3) Positive working capital changes reflect capital expenditures in the current period that will be paid in a future period. Negative working capital changes reflect capital expenditures incurred in a prior period but paid during the period presented.
(4) On January 1, 2022, the Company adopted ASU 2016-02, Leases (Topic 842), which resulted in the recognition of $0.6 million of finance right-of-use lease liabilities, previously recognized as capital lease liabilities. Information prior to January 1, 2022 has not been restated and continues to be reported under the accounting standards in effect for the period (Accounting Standards Codification (“ASC”) Topic 840).
Factors Affecting the Comparability of Our Results of Operations
Long-Term Incentive Plan
In order to incentivize management members, in March 2023, our Board adopted the LTIP for the benefit of employees, directors and consultants of the Company and its affiliates. The LTIP provides for the grant of all or any of the following types of awards: (1) incentive stock options qualified as such under U.S. federal income tax laws; (2) stock options that do not qualify as incentive stock options; (3) stock appreciation rights; (4) restricted stock awards; (5) restricted stock units (“RSUs”); (6) bonus stock; (7) dividend equivalents; (8) other stock-based awards; (9) cash awards; and (10) substitute awards. As such, our historical financial data may not present an accurate indication of what our actual results would have been if we had implemented the LTIP program prior to the periods presented.
63
Public Company Expenses
As a result of the IPO, we incurred direct, incremental selling, general and administrative expenses as a result of being a publicly traded company, including, but not limited to, costs associated with hiring new personnel, implementation of compensation programs that are competitive with our public company peer group, including stock-based compensation, preparing quarterly reports to stockholders, tax return preparation, independent and internal auditor fees, investor relations activities, registrar and transfer agent fees, incremental director and officer liability insurance costs and independent director compensation. These direct, incremental selling, general and administrative expenses are not included in our results of operations prior to the IPO.
Income Taxes
Atlas Inc. is a corporation subject to U.S. federal, state and local income taxes. Although Atlas Predecessor is subject to margin tax in the State of Texas (at less than 1% of modified pre-tax earnings), it is and historically has been treated as a pass-through entity for U.S. federal, state and local income tax purposes, and as such generally is and was not subject to U.S. federal, state or local income taxes. Rather, the tax liability with respect to the taxable income of Atlas Predecessor is and was passed through to its owners. Accordingly, the financial data attributable to Atlas Predecessor contains no provision for U.S. federal income taxes or income taxes in any state or locality (other than margin tax in the State of Texas). Atlas Inc. is subject to U.S. federal, state and local taxes at a blended statutory rate of approximately 22%.
We account for income taxes under the asset and liability method. Under this method, deferred tax assets and liabilities are recognized for the estimated future tax consequences attributable to differences between the financial statement carrying amounts of existing assets and liabilities and their respective tax bases. Deferred tax assets and liabilities are measured using enacted tax rates in effect for the year in which those temporary differences are expected to be recovered or settled pursuant to the provisions of ASC 740, Income Taxes. The effect on deferred tax assets and liabilities of a change in tax rate is recognized in earnings in the period that includes the enactment date. Valuation allowances are established when necessary to reduce deferred tax assets to the amounts more likely than not to be realized.
On March 13, 2023 (the closing date of the IPO), a corresponding deferred tax liability of approximately $27.5 million associated with the differences between the tax and book basis of the investment in Atlas LLC was recorded. The offset of the deferred tax liability was recorded to additional paid-in capital.
On October 2, 2023, the date on which the Company completed the Up-C Simplification, a corresponding deferred tax liability of approximately $62.7 million was recorded associated with the exchange of the redeemable noncontrolling interest in Old Atlas for shares of the Company's Common Stock. The offset of the deferred tax liability was recorded to additional paid-in capital.
Results of Operations
|
|
For the Year Ended |
|
|||||||||
|
|
December 31, |
|
|||||||||
|
|
2023 |
|
|
2022 |
|
|
2021 |
|
|||
|
|
(In thousands) |
|
|||||||||
Product sales |
|
$ |
468,119 |
|
|
$ |
408,446 |
|
|
$ |
142,519 |
|
Service sales |
|
|
145,841 |
|
|
|
74,278 |
|
|
|
29,885 |
|
Total sales |
|
|
613,960 |
|
|
|
482,724 |
|
|
|
172,404 |
|
Cost of sales (excluding depreciation, depletion and accretion expense) |
|
|
260,396 |
|
|
|
198,918 |
|
|
|
84,656 |
|
Depreciation, depletion and accretion expense |
|
|
39,798 |
|
|
|
27,498 |
|
|
|
23,681 |
|
Gross profit |
|
|
313,766 |
|
|
|
256,308 |
|
|
|
64,067 |
|
Operating expenses: |
|
|
|
|
|
|
|
|
|
|||
Selling, general and administrative expense (including stock and unit-based compensation expense of $7,409, $678, and $129, respectively.) |
|
|
48,636 |
|
|
|
24,317 |
|
|
|
17,071 |
|
Operating income |
|
|
265,130 |
|
|
|
231,991 |
|
|
|
46,996 |
|
Interest expense, net |
|
|
(7,689 |
) |
|
|
(15,760 |
) |
|
|
(42,198 |
) |
Other income |
|
|
430 |
|
|
|
2,631 |
|
|
|
291 |
|
Income before income taxes |
|
|
257,871 |
|
|
|
218,862 |
|
|
|
5,089 |
|
Income tax expense |
|
|
31,378 |
|
|
|
1,856 |
|
|
|
831 |
|
Net income |
|
$ |
226,493 |
|
|
$ |
217,006 |
|
|
$ |
4,258 |
|
64
Year Ended December 31, 2023 Compared To Year Ended December 31, 2022
Product sales. Product sales increased by $59.7 million to $468.1 million for the year ended December 31, 2023, as compared to $408.4 million for the year ended December 31, 2022. An increase in proppant prices between the periods contributed to a $27.9 million positive impact and an increase in sales volume contributed a $31.8 million positive impact.
Service sales. Services sales, which includes freight for last-mile logistics services, increased by $71.5 million to $145.8 million for the year ended December 31, 2023, as compared to $74.3 million for the year ended December 31, 2022. The increase in logistics revenue was due to higher sales volumes shipped to last-mile logistics customers.
Cost of sales (excluding depreciation, depletion and accretion expense). Cost of sales (excluding depreciation, depletion and accretion expense) increased by $61.5 million to $260.4 million for the year ended December 31, 2023, as compared to $198.9 million for the year ended December 31, 2022.
Cost of sales (excluding depreciation, depletion and accretion) related to product sales increased by $1.0 million to $131.8 million for the year ended December 31, 2023, as compared to $130.8 million for the year ended December 31, 2022, due to higher sales volumes, which increased maintenance expense and mining costs.
Cost of sales (excluding depreciation, depletion and accretion expense) related to services increased by $60.5 million to $128.6 million for the year ended December 31, 2023, as compared to $68.1 million for the year ended December 31, 2022, due to higher sales volumes shipped to last-mile logistics customers during the period.
Depreciation, depletion and accretion expense. Depreciation, depletion and accretion expense increased by $12.3 million to $39.8 million for the year ended December 31, 2023, as compared to $27.5 million for the year ended December 31, 2022. The increase in depreciation, depletion and accretion expense was due to increased units of production depletion due to higher proppant production and additional depreciable assets placed into service when compared to the prior period.
Selling, general and administrative expense. Selling, general and administrative expense increased by $24.3 million to $48.6 million for the year ended December 31, 2023, as compared to $24.3 million for the year ended December 31, 2022. The increase was primarily due to an increase of $10.7 million of employee costs, including an increase of $6.7 million of stock- and unit-based compensation expense, $8.3 million of travel, sales and other corporate expenses associated with increased opportunities to conduct commercial business development efforts, incremental costs incurred in conjunction with our transition to a publicly traded company, and broadening sales efforts due to our substantial growth in the logistics space, and $5.3 million for non-recurring transaction costs related to the Up-C Simplification and the refinancing of the 2023 Term Loan Credit Facility during the year ended December 31, 2023.
Our selling, general and administrative expense includes the non-cash expense for stock- and unit-based compensation expense for equity awards granted to our employees. For the year ended December 31, 2023, unit-based compensation expense was $0.3 million and stock-based compensation expense was $7.1 million, as compared to $0.7 million of unit-based compensation expense and no stock-based compensation expense for the year ended December 31, 2022.
Interest expense, net. Interest expense, net decreased by $8.1 million to $7.7 million for the year ended December 31, 2023, as compared to $15.8 million for the year ended December 31, 2022. The decrease was driven by an increase in interest income of $9.8 million related to interest earned on net IPO proceeds.
Income tax expense. Income tax expense increased by $29.5 million to $31.4 million for the year ended December 31, 2023, as compared to $1.9 million for the year ended December 31, 2022. The increase was primarily due to Atlas Inc. incurring U.S. federal income taxes subsequent to our IPO-related reorganization in March of 2023.
Year Ended December 31, 2022 Compared To Year Ended December 31, 2021
Product sales. Product sales increased by $265.9 million to $408.4 million for the year ended December 31, 2022, as compared to $142.5 million for the year ended December 31, 2021. An increase in proppant prices between the periods contributed to a $233.1 million positive impact, while an increase in sales volume contributed a $32.8 million positive impact.
Service sales. Services sales, which includes freight for last-mile logistics services, increased by $44.4 million to $74.3 million for the year ended December 31, 2022, as compared to $29.9 million for the year ended December 31, 2021. The increase in logistics revenue was due to higher sales volumes shipped to last-mile logistics customers.
Cost of sales (excluding depreciation, depletion and accretion expense). Cost of sales (excluding depreciation, depletion and accretion expense) increased by $114.2 million to $198.9 million for the year ended December 31, 2022, as compared to $84.7 million for the year ended December 31, 2021.
Cost of sales (excluding depreciation, depletion and accretion) related to product sales increased by $73.0 million to $130.8 million for the year ended December 31, 2022, as compared to $57.8 million for the year ended December 31, 2021, due to higher sales volumes, which increased costs for utilities, maintenance, royalties and transition costs related to purchase of dredge equipment, requiring temporary usage of traditional mining rental equipment.
65
Cost of sales (excluding depreciation, depletion and accretion expense) related to services increased by $41.2 million to $68.1 million for the year ended December 31, 2022, as compared to $26.9 million for the year ended December 31, 2021, due to higher sales volumes shipped to last-mile logistics customers during the period.
Depreciation, depletion and accretion expense. Depreciation, depletion and accretion expense increased by $3.8 million to $27.5 million for the year ended December 31, 2022, as compared to $23.7 million for the year ended December 31, 2021. The increase in depreciation, depletion and accretion expense was due to increased units of production depletion due to higher sand production and additional depreciable assets placed into service when compared to the prior period.
Selling, general and administrative expense. Selling, general and administrative expense increased by $7.2 million to $24.3 million for the year ended December 31, 2022, as compared to $17.1 million for the year ended December 31, 2021. The increase is primarily due to an increase of $5.1 million of employee costs, including an increase of $0.6 million of unit-based compensation expense, and $2.1 million of travel, sales and other corporate expenses associated with increased opportunities to conduct commercial business development efforts in person during the year ended December 31, 2022.
Our selling, general and administrative expenses include the non-cash expense for unit-based compensation for equity awards granted to our employees. For the year ended December 31, 2022, unit-based compensation expense was $0.7 million, as compared to $0.1 million of unit-based compensation expense for the year ended December 31, 2021.
Interest expense, net. Interest expense, net decreased by $26.4 million to $15.8 million for the year ended December 31, 2022, as compared to $42.2 million for the year ended December 31, 2021. The decrease is primarily due to the recognition of a loss on extinguishment of debt of $16.4 million resulting from the recognition of unamortized debt discount and deferred financing costs of $11.9 million and a make-whole premium of $4.5 million paid upon redemption of the 2018 Term Loan Credit Facility during the year ended December 31, 2021. This decrease was partially offset by the recognition of gain on extinguishment of debt of $4.5 million due to the forgiveness of an SBA Paycheck Protection Program Loan and the related accrued interest expense during the year ended December 31, 2021. The remaining decrease is due to the outstanding 2021 Term Loan Credit Facility, which accrued $14.0 million of interest expense and $0.7 million of amortization of debt discount and deferred financing costs during the year ended December 31, 2022, as compared to the 2018 Term Loan Credit Facility and 2021 Term Loan Facility, which accrued $22.0 million of interest expense and $7.7 million of amortization of debt discount and deferred financing costs during the year ended December 31, 2021.
Income tax expense. Income tax expense increased by $1.1 million to $1.9 million for the year ended December 31, 2022, as compared to $0.8 million for the year ended December 31, 2021. The increase is primarily due to increased revenues, which increased our liability related to Texas franchise taxes.
Liquidity and Capital Resources
Overview
Historically, our primary sources of liquidity to date have been capital contributions from our owners, cash flows from operations, and borrowings under our 2018 Term Loan Credit Facility, which was refinanced by our 2021 Term Loan Credit Facility, and our previous asset-based loan credit facility, the 2018 ABL Credit Facility. Going forward, we expect our primary sources of liquidity to be cash flows from operations, the net proceeds retained from the IPO, availability under our 2023 ABL Credit Facility, borrowings under our 2023 Term Loan Credit Facility or any other credit facility we enter into in the future and proceeds from any future issuances of debt or equity securities. We expect our primary use of capital will be used for the financing of the Hi-Crush Transaction, payment of any distributions and dividends to our stockholders and for investing in our business, specifically for construction of the Dune Express, and acquisition of fit-for-purpose equipment for our trucking fleet used in our logistics platform. In addition, we have routine facility upgrades and additional ancillary capital expenditures associated with, among other things, contractual obligations and working capital obligations.
As of December 31, 2023, we had working capital, defined as current assets less current liabilities, of $226.1 million, $73.9 million of availability under the 2023 ABL Credit Facility, and $100.0 million of DDT Loans under the 2023 Term Loan Credit Facility. Our cash and cash equivalents totaled $210.2 million.
66
Cash Flow
The following table summarizes our cash flow for the periods indicated:
|
|
For the Year Ended |
|
|||||||||
|
|
December 31 |
|
|||||||||
|
|
2023 |
|
|
2022 |
|
|
2021 |
|
|||
|
|
(In thousands) |
|
|||||||||
Consolidated Statement of Cash Flow Data: |
|
|
|
|
|
|
|
|
|
|||
Net cash provided by operating activities |
|
$ |
299,027 |
|
|
$ |
206,012 |
|
|
$ |
21,356 |
|
Net cash used in investing activities |
|
|
(365,486 |
) |
|
|
(89,592 |
) |
|
|
(19,371 |
) |
Net cash provided by (used in) financing activities |
|
|
194,623 |
|
|
|
(74,811 |
) |
|
|
2,344 |
|
Net increase in cash |
|
$ |
128,164 |
|
|
$ |
41,609 |
|
|
$ |
4,329 |
|
Year Ended December 31, 2023 Compared To The Year Ended December 31, 2022
Net Cash Provided by Operating Activities. Net cash provided by operating activities was $299.0 million and $206.0 million for the years ended December 31, 2023 and 2022, respectively. The increase was attributable to increased revenues of $131.2 million, offset by a $61.5 million increase in cost of sales (excluding depreciation, depletion and accretion expense) and a $34.8 million increase in cash from changes in working capital primarily attributable to a decrease in our accounts receivable balance from December 31, 2022 to December 31, 2023.
Net Cash Used in Investing Activities. Net cash used in investing activities was $365.5 million and $89.6 million for the years ended December 31, 2023 and 2022, respectively. The increase was due to an increase in capital spending in connection with the Dune Express, plant capacity expansion at our Kermit location, and logistics assets during the year ended December 31, 2023, when compared to the year ended December 31, 2022.
Net Cash Provided by (Used in) Financing Activities. Net cash provided by financing activities was $194.6 million and net cash used in financing activities was $74.8 million for the years ended December 31, 2023 and 2022, respectively. The increase is primarily due to cash inflows of $303.4 million from net IPO proceeds during the year ended December 31, 2023. This was offset by an increase of cash outflows of $32.1 million of dividends and distributions during the year ended December 31, 2023 compared to the year ended December 31, 2022.
Year Ended December 31, 2022 Compared To The Year Ended December 31, 2021
Net Cash Provided by Operating Activities. Net cash provided by operating activities was $206.0 million and $21.4 million for the years ended December 31, 2022 and 2021, respectively. The increase was attributable to increased revenues of $310.3 million offset by a $114.3 million increase in cost of sales (excluding depreciation, depletion and accretion expense).
Net Cash Used in Investing Activities. Net cash used in investing activities was $89.6 million and $19.4 million for the years ended December 31, 2022 and 2021, respectively. The increase was due to an increase in capital spending in connection with the plant capacity expansion at our Kermit location, Dune Express and logistics assets during the year ended December 31, 2022, when compared to the year ended December 31, 2021.
Net Cash Provided by (Used in) Financing Activities. Net cash used in financing activities was $74.8 million year ended December 31, 2022. Net cash provided by financing activities was $2.3 million for the year ended December 31, 2021. The change was due to a decrease of $178.2 million of proceeds from term loan borrowings related to the funding of the 2021 Term Loan Credit Facility, a decrease of $148.8 million of payments on term loan borrowings and debt prepayment and extinguishment costs related to the repayment of the 2018 Term Loan Credit Facility, an increase of $35.0 million for member distributions, and a decrease in proceeds from equity issuances of $12.6 million during the year ended December 31, 2022, compared to the year ended December 31, 2021.
Capital Requirements
Our primary growth and technology initiatives include continued construction of the Dune Express and acquisition of fit-for-purpose equipment for our trucking fleet. Outside of our growth and technology initiatives, our business is not presently capital intensive in nature and only requires the maintenance of our Kermit and Monahans facilities. In addition to capital expenditures, we have certain contractual long-term capital requirements associated with our lease, royalty payments and debt. See Note 6 - Leases, Note 7 - Debt and Note 8 - Commitments and Contingencies of the consolidated financial statements included elsewhere in this Annual Report. Our current level of maintenance capital expenditures is expected to remain within our cash on hand and internally generated cash flow.
67
We expect to use the remaining net proceeds from the IPO to fund construction of the Dune Express over the next approximately 12 months. We intend to fund our other capital requirements through our primary sources of liquidity, which include cash on hand and cash flows from operations and, if needed, availability under our 2023 ABL Credit Facility and borrowings under our 2023 Term Loan Credit Facility.
At any time that our Board declares a dividend to holders of our Common Stock, we currently expect such dividend to be paid from cash provided by operating activities. We do not expect to borrow funds to finance dividends on our Common Stock. The timing and amount of any future dividends will be subject to the discretion of our Board from time to time.
Debt Agreements
2023 Term Loan Credit Facility
On July 31, 2023, Atlas LLC entered into the 2023 Term Loan Credit Agreement with Stonebriar, as administrative agent and initial lender, pursuant to which Stonebriar extended Atlas LLC a term loan credit facility comprised of a $180.0 million single advance term loan that was made on July 31, 2023 and commitments to provide up to $100.0 million of DDT Loans. The Initial Term Loan is payable in eighty-four consecutive monthly installments and a final payment of the remaining outstanding principal balance at maturity. The Initial Term Loan has a final maturity date of August 1, 2030 (the “Maturity Date”). The Initial Term Loan bears interest at a rate equal to 9.50% per annum.
Each DDT Loan under the 2023 Term Loan Credit Facility will be payable in equal monthly installments, with the monthly installments comprising 80% of the DDT Loan and a final payment of the remaining 20% of the outstanding principal balance due at maturity, unless earlier prepaid. The DDT Loans will bear interest at a rate equal to the applicable Term SOFR Rate (as defined in the 2023 Term Loan Credit Agreement) plus 5.95% per annum. All monthly installments with respect to the Initial Term Loan and the DDT Loans payable on or prior to January 1, 2025 will be interest only.
At any time prior to the Maturity Date, Atlas LLC may redeem loans outstanding under the 2023 Term Loan Credit Facility, in whole or in part, at a price equal to 100% of the Prepayment Amount (as defined in the 2023 Term Loan Credit Agreement) plus a prepayment fee. The prepayment fee is 8% of the Prepayment Amount for any prepayment that occurs on or prior to December 31, 2024, 4% of the Prepayment Amount for any prepayment that occurs after December 31, 2024 but on or prior to December 31, 2025, 3% of the Prepayment Amount for any prepayment that occurs after December 31, 2025 but on or prior to December 31, 2026 and 2% of the Prepayment Amount for any prepayment that occurs thereafter. Upon the maturity of the 2023 Term Loan Credit Facility, the entire unpaid principal amount of the loans outstanding thereunder, together with interest, fees and other amounts payable in connection with the facility, will be immediately due and payable without further notice or demand.
Dividends and distributions to equity holders are permitted to be made pursuant to certain limited exceptions and baskets described in the 2023 Term Loan Credit Agreement and otherwise generally subject to certain restrictions set forth in the 2023 Term Loan Credit Agreement, including the requirements that (a) no Event of Default (as defined under the 2023 Term Loan Credit Agreement) has occurred and is continuing and (b) Atlas LLC maintains at least $30.0 million of Liquidity (as defined under the 2023 Term Loan Credit Agreement) pro forma for the Restricted Payment (as defined under the 2023 Term Loan Credit Agreement).
The 2023 Term Loan Credit Facility includes certain non-financial covenants, including but not limited to restrictions on incurring additional debt and certain distributions. The 2023 Term Loan Credit Facility is subject to a maximum 4.0 to 1.0 Leverage Ratio (as defined in the 2023 Term Loan Credit Agreement) financial covenant. Such financial covenant is tested as of the last day of each fiscal quarter.
Proceeds from the 2023 Term Loan Credit Facility were used to repay outstanding indebtedness under our previous 2021 Term Loan Credit Facility with Stonebriar, to repay obligations outstanding under certain equipment lease arrangements with Stonebriar and for general corporate purposes.
The 2023 Term Loan Credit Facility is unconditionally guaranteed, jointly and severally, by Atlas LLC and its subsidiaries and secured by substantially all of the assets of Atlas LLC and its subsidiaries. The 2023 Term Loan Credit Facility is unconditionally guaranteed on an unsecured basis by Atlas Inc.
2023 ABL Credit Facility
On February 22, 2023, Atlas LLC, certain of its subsidiaries, as guarantors, Bank of America, N.A., as agent, and certain financial institutions party thereto as lenders (the “ABL Lenders”) entered into the 2023 ABL Credit Agreement pursuant to which the ABL Lenders provide revolving credit financing to the Company in an aggregate principal amount of up to $75.0 million, with Availability (as defined in the 2023 ABL Credit Agreement) thereunder subject to a “Borrowing Base” as described in the 2023 ABL Credit Agreement. The 2023 ABL Credit Facility includes a letter of credit sub-facility, which permits issuances of letters of credit up to an aggregate amount of $25.0 million. The scheduled maturity date of the 2023 ABL Credit Facility is February 22, 2028; provided that the 2023 ABL Credit Facility will mature on June 30, 2027 if any amount of the 2023 Term Loan Credit Facility that has a maturity date less than 91 days prior to February 22, 2028 is outstanding on June 30, 2027.
68
Borrowings under the 2023 ABL Credit Facility bear interest, at the Company’s option, at either a base rate or Term Secured Overnight Financing Rate (“SOFR”), as applicable, plus an applicable margin based on average availability as set forth in the 2023 ABL Credit Agreement. Term SOFR loans bear interest at Term SOFR for the applicable interest period plus an applicable margin, which ranges from 1.50% to 2.00% per annum based on average availability as set forth in the 2023 ABL Credit Agreement. Base rate loans bear interest at the applicable base rate, plus an applicable margin, which ranges from 0.50% to 1.00% per annum based on average availability as set forth in the 2023 ABL Credit Agreement. In addition to paying interest on outstanding principal under the 2023 ABL Credit Facility, the Company is required to pay a commitment fee which ranges from 0.375% per annum to 0.500% per annum with respect to the unutilized commitments under the 2023 ABL Credit Facility, based on the average utilization of the 2023 ABL Credit Facility. The Company is also required to pay customary letter of credit fees, to the extent that one or more letter of credit is outstanding.
Under the 2023 ABL Credit Agreement, Atlas LLC is permitted to make payments of dividends and distributions pursuant to certain limited exceptions and baskets set forth therein and otherwise generally subject to certain restrictions, including that (i) no Event of Default (as defined under the 2023 ABL Credit Agreement) has occurred and is continuing, and (ii) no loans and no more than $7.5 million in letters of credit that have not been cash collateralized are outstanding, and liquidity exceeds $30.0 million at all times during the 30 days prior to the date of the dividend or distribution; provided that if any loans are outstanding or outstanding letters of credit exceed $7.5 million and no Event of Default has occurred and is continuing, then Atlas LLC is permitted to make payments of dividends and distributions if, (i) Availability (as defined under the 2023 ABL Credit Agreement) is higher than the greater of (a) $12 million and (b) 20% of the pro forma Borrowing Base then in effect and during the 30 days prior to the date of the dividend or distribution as if such dividend or distribution had been made at the beginning of such period, or if (ii) (a) Availability is higher than the greater of (x) $9 million and (y) 15% of the pro forma Borrowing Base then in effect and during the 30 days prior to the date of the dividend or distributions as if such dividend or distribution had been made at the beginning of such period and (b) the Fixed Charge Coverage Ratio (as defined under the 2023 ABL Credit Agreement), as calculated on a pro forma basis, is greater than 1.00 to 1.00, as provided under the 2023 ABL Credit Agreement. Additionally, Atlas LLC may make additional payments of dividends and distributions in qualified equity interests and may make Permitted Tax Distributions (as defined under the 2023 ABL Credit Agreement).
The 2023 ABL Credit Facility is unconditionally guaranteed, jointly and severally, by Atlas LLC and its subsidiaries and secured by substantially all of the assets of Atlas LLC and its subsidiaries.
2021 Term Loan Credit Facility
Prior to entering into the 2023 Term Loan Credit Facility, the Company had borrowings and accrued interest of $133.4 million under the 2021 Term Loan Credit Facility. On July 31, 2023, the Company entered into the 2023 Term Loan Credit Facility. Proceeds from the 2023 Term Loan Credit Facility were used to repay $133.4 million of 2021 Term Loan Credit Facility principal and accrued interest, repay $42.8 million of finance lease liabilities as well as acquire $39.5 million of finance lease assets associated with certain equipment lease arrangements with Stonebriar.
2018 ABL Credit Facility
Prior to entering into the 2023 ABL Credit Facility, the Company maintained a revolving credit facility with a borrowing capacity of up to $50.0 million. On February 22, 2023, the Company terminated the 2018 ABL Credit Facility. The Company did not have borrowings under the credit facility at termination.
Off Balance Sheet Arrangements
We currently have no material off-balance sheet arrangements.
Critical Accounting Policies and Estimates
The preparation of financial statements requires the use of judgments and estimates. Our critical accounting policies are described below to provide a better understanding of how we develop our assumptions and judgments about future events and related estimates and how they can impact our financial statements. A critical accounting estimate is one that requires our most difficult, subjective or complex estimates and assessments and is fundamental to our results of operations.
We base our estimates on historical experience and on various other assumptions we believe to be reasonable according to the current facts and circumstances, the results of which form the basis for making judgments about the carrying values of assets and liabilities that are not readily apparent from other sources. A summary of our significant accounting policies is included in Note 2 - Summary of Significant Accounting Policies to the Consolidated Financial Statements in Item 8. “Financial Statements and Supplementary Data” of this Annual Report.
We prepare our consolidated financial statements in conformity with GAAP, which require us to make estimates and assumptions about future events that affect the amounts reported in the consolidated financial statements and accompanying footnotes. Actual results could differ from those estimates. We believe that the following discussion addresses our most critical accounting estimates, which require management’s most subjective and complex judgments.
69
Property, Plant and Equipment, Including Depreciation and Depletion
In order to calculate depreciation of our fixed assets, other than plant facilities and mine development costs, we use the best estimated useful lives at the time the asset is placed into service.
Mining property and development costs, including plant facilities directly associated with mining properties, are amortized using the units of production method on estimated measures of tons of in-place reserves. The impact to reserve estimates is recognized on a prospective basis. Drilling and related costs are capitalized for deposits where proven and probable reserves exist. These activities are directed at obtaining additional information on the deposit or converting non-reserve minerals to proven and probable reserves, with the benefit being realized over a period greater than one year. At a minimum, we will assess the useful lives and residual values of all long-lived assets on an annual basis to determine if adjustments are required. The actual reserve life may differ from the assumptions we have made about the estimated reserve life.
We review property, plant and equipment for impairment annually or whenever events or changes in circumstances indicate that the carrying value of such assets may not be recoverable. If such a review should indicate that the carrying amount of long-lived assets is not recoverable, the Company will reduce the carrying amount of such assets to fair value.
Emerging Growth Company Status
Under the JOBS Act, we meet the definition of an “emerging growth company,” which allows us to have an extended transition period for complying with new or revised accounting standards pursuant to Section 107(b) of the JOBS Act. We have elected to take advantage of all of the reduced reporting requirements and exemptions, including the longer phase-in periods for the adoption of new or revised financial accounting standards under Section 107 of the JOBS Act, until we are no longer an emerging growth company.
Our election to use the phase-in periods permitted by this election may make it difficult to compare our financial statements to those of non-emerging growth companies and other emerging growth companies that have opted out of the longer phase-in periods under Section 107 of the JOBS Act and that will comply with new or revised financial accounting standards. If we were to subsequently elect instead to comply with these public company effective dates, such election would be irrevocable pursuant to Section 107 of the JOBS Act.
Recent Accounting Pronouncements
See Note 2 - Summary of Significant Accounting Policies in the notes to our consolidated financial statements for further discussion regarding recently issued accounting standards.
Item 7A. Quantitative and Qualitative Disclosures About Market Risk.
Commodity Price Risks
The market for our services is indirectly exposed to fluctuations in the price of crude oil and natural gas, to the extent such fluctuations impact drilling and completion activity levels and thus impact the activity levels of our customers in the exploration and production and oilfield services industries. We do not currently intend to hedge our indirect exposure to commodity price risk.
Our natural gas purchases expose us to commodity price risk. Our facility operations require natural gas consumption for equipment used in the manufacturing of proppant. Pricing for natural gas has been volatile and unpredictable for several years, and this volatility is expected to continue in the future. The cost we pay for our natural gas depends on many factors outside of our control, such as the strength of the global economy and global supply and demand for the commodities we produce. To reduce the impact of fluctuations in natural gas prices on our operational costs, we periodically enter into commodity derivative contracts with respect to certain of our forecasted natural gas usage through various transactions that reduce the impact of price volatility. For the years ended December 31, 2023 and 2022, we did not have derivatives. In the future, we will consider entering into such transactions to reduce the impact of commodity price volatility on our cash flow from operations.
Interest Rate Risks
We are subject to interest rate risk on a portion of our long-term debt under the 2023 ABL Credit Facility. The amounts owed under our 2023 ABL Credit Facility use SOFR as a benchmark for establishing the rate at which interest accrues. We do not currently have any borrowings under our 2023 ABL Credit Facility and do not currently have or intend to enter into any derivative arrangements to protect against fluctuations in interest rates applicable to our outstanding indebtedness under our 2023 ABL Credit Facility.
Assuming no change in the amount of debt outstanding, a 100 basis point increase in the average interest rate under these borrowings would have no impact to our interest expense related to our variable rate debt, as we do not currently have any borrowings under our 2023 ABL Credit Facility.
70
Market Risks
The demand, pricing and terms for proppant and last-mile services provided by us are largely dependent upon the level of drilling activity in the oil and natural gas industry in the Permian Basin. These activity levels are influenced by numerous factors over which we have no control, including, but not limited to: the supply of and demand for oil and natural gas; the level of prices, and expectations about future prices of oil and natural gas; the cost of exploring for, developing, producing and delivering oil and natural gas; the expected rates of declining current production; the discovery rates of new oil and natural gas reserves; available rail and other transportation capacity; weather conditions; domestic and worldwide economic conditions; political instability in oil-producing countries; environmental regulations; technical advances affecting energy consumption; the price and availability of alternative fuels; the ability of oil and natural gas companies to raise equity capital and debt financing; and merger and divestiture activity among oil and natural gas companies.
The level of U.S. oil and natural gas drilling is volatile. Expected trends in oil and natural gas production activities may not materialize and demand for our services may not reflect the level of activity in the industry. Any prolonged and substantial reduction in oil and natural gas prices would likely affect oil and natural gas production levels and therefore affect demand for our services. A material decline in oil and natural gas prices or Permian Basin activity levels could have an adverse effect on our business, financial condition, results of operations and cash flows.
Credit Risks
We are subject to risks of loss resulting from nonpayment or nonperformance by our customers. We examine the creditworthiness of third-party customers to whom we extend credit and manage our exposure to credit risk through credit analysis, credit approval, credit limits and monitoring procedures, and for certain transactions, we may request letters of credit, prepayments or guarantees, although collateral is generally not required. For the year ended December 31, 2023, we had 33 customers, of which six were investment grade. For the year ended December 31, 2022, we had 39 customers, of which ten were investment grade.
Inflation Risks
Inflationary factors such as increases in the cost of our products and overhead costs may adversely affect our results of operations. Although we do not believe that inflation has had a material impact on our financial position or results of operations to date, a high rate of inflation in the future may have an adverse effect on our ability to maintain current levels of gross margin and selling, general and administrative expenses as a percentage of net revenue if the selling prices of our products do not increase with these increased costs.
71
Item 8. Financial Statements and Supplementary Data.
The following Consolidated Financial Statements are filed as part of this Annual Report:
Atlas Energy Solutions Inc.
F-1
REPORT OF INDEPENDENT REGISTERED PUBLIC ACCOUNTING FIRM
To the Shareholders and the Board of Directors of Atlas Energy Solutions Inc.
Opinion on the Financial Statements
We have audited the accompanying consolidated balance sheets of Atlas Energy Solutions Inc. (the Company) as of December 31, 2023 and 2022, the related consolidated statements of operations, stockholders’ equity and cash flows for each of the three years in the period ended December 31, 2023 and the related notes (collectively referred to as the “consolidated financial statements”). In our opinion, the consolidated financial statements present fairly, in all material respects, the financial position of the Company at December 31, 2023 and 2022, and the results of its operations and its cash flows for each of the three years in the period ended December 31, 2023, in conformity with U.S. generally accepted accounting principles.
Basis for Opinion
These financial statements are the responsibility of the Company’s management. Our responsibility is to express an opinion on the Company’s financial statements based on our audits. We are a public accounting firm registered with the Public Company Accounting Oversight Board (United States) (PCAOB) and are required to be independent with respect to the Company in accordance with the U.S. federal securities laws and the applicable rules and regulations of the Securities and Exchange Commission and the PCAOB.
We conducted our audits in accordance with the standards of the PCAOB. Those standards require that we plan and perform the audit to obtain reasonable assurance about whether the financial statements are free of material misstatement, whether due to error or fraud. The Company is not required to have, nor were we engaged to perform, an audit of its internal control over financial reporting. As part of our audits we are required to obtain an understanding of internal control over financial reporting but not for the purpose of expressing an opinion on the effectiveness of the Company’s internal control over financial reporting. Accordingly, we express no such opinion.
Our audits included performing procedures to assess the risks of material misstatement of the financial statements, whether due to error or fraud, and performing procedures that respond to those risks. Such procedures included examining, on a test basis, evidence regarding the amounts and disclosures in the financial statements. Our audits also included evaluating the accounting principles used and significant estimates made by management, as well as evaluating the overall presentation of the financial statements. We believe that our audits provide a reasonable basis for our opinion.
/s/
We have served as the Company’s auditor since 2017.
February 27, 2024
F-2
Atlas Energy Solutions Inc.
Consolidated Balance Sheets
(In thousands, except share data)
|
|
December 31, |
|
|
December 31, |
|
||
|
|
2023 |
|
|
2022 |
|
||
|
|
|
|
|
|
|
||
Assets |
|
|
|
|
|
|
||
Current assets: |
|
|
|
|
|
|
||
Cash and cash equivalents |
|
$ |
|
|
$ |
|
||
Accounts receivable |
|
|
|
|
|
|
||
Accounts receivable - related parties |
|
|
|
|
|
|
||
Inventories |
|
|
|
|
|
|
||
Spare part inventories |
|
|
|
|
|
|
||
Prepaid expenses and other current assets |
|
|
|
|
|
|
||
Total current assets |
|
|
|
|
|
|
||
Property, plant and equipment, net |
|
|
|
|
|
|
||
Finance lease right-of-use assets |
|
|
|
|
|
|
||
Operating lease right-of-use assets |
|
|
|
|
|
|
||
Other long-term assets |
|
|
|
|
|
|
||
Total assets |
|
$ |
|
|
$ |
|
||
Liabilities, redeemable noncontrolling interest, and stockholders' and members' equity |
|
|
|
|
|
|
||
Current liabilities: |
|
|
|
|
|
|
||
Accounts payable |
|
$ |
|
|
$ |
|
||
Accounts payable - related parties |
|
|
|
|
|
|
||
Accrued liabilities |
|
|
|
|
|
|
||
Current portion of long-term debt |
|
|
|
|
|
|
||
Other current liabilities |
|
|
|
|
|
|
||
Total current liabilities |
|
|
|
|
|
|
||
Long-term debt, net of discount and deferred financing costs |
|
|
|
|
|
|
||
Deferred tax liabilities |
|
|
|
|
|
|
||
Other long-term liabilities |
|
|
|
|
|
|
||
Total liabilities |
|
|
|
|
|
|
||
|
|
|
|
|
|
|||
Redeemable noncontrolling interest |
|
|
|
|
|
|
||
Stockholders’ / members’ equity: |
|
|
|
|
|
|
||
Members' equity |
|
|
|
|
|
|
||
Preferred stock, $ |
|
|
|
|
|
|
||
Old Atlas Class A Common Stock, $ |
|
|
|
|
|
|
||
Old Atlas Class B Common Stock, $ |
|
|
|
|
|
|
||
New Atlas Common Stock, $ |
|
|
|
|
|
|
||
Additional paid-in-capital |
|
|
|
|
|
|
||
Accumulated deficit |
|
|
( |
) |
|
|
|
|
Total stockholders' and members' equity |
|
|
|
|
|
|
||
Total liabilities, redeemable noncontrolling interest and stockholders’ and members’ equity |
|
$ |
|
|
$ |
|
||
The accompanying notes are an integral part of these consolidated financial statements.
F-3
Atlas Energy Solutions Inc.
Consolidated Statements of Operations
(In thousands, except per share data)
|
|
Year Ended December 31, |
|
|||||||||
|
|
2023 |
|
|
2022 |
|
|
2021 |
|
|||
Product sales |
|
$ |
|
|
$ |
|
|
$ |
|
|||
Service sales |
|
|
|
|
|
|
|
|
|
|||
Total sales |
|
|
|
|
|
|
|
|
|
|||
Cost of sales (excluding depreciation, depletion and accretion expense) |
|
|
|
|
|
|
|
|
|
|||
Depreciation, depletion and accretion expense |
|
|
|
|
|
|
|
|
|
|||
Gross profit |
|
|
|
|
|
|
|
|
|
|||
Selling, general and administrative expense (including stock and unit-based compensation expense of $ |
|
|
|
|
|
|
|
|
|
|||
Operating income |
|
|
|
|
|
|
|
|
|
|||
Interest expense, net |
|
|
( |
) |
|
|
( |
) |
|
|
( |
) |
Other income |
|
|
|
|
|
|
|
|
|
|||
Income before income taxes |
|
|
|
|
|
|
|
|
|
|||
Income tax expense |
|
|
|
|
|
|
|
|
|
|||
Net income |
|
$ |
|
|
$ |
|
|
$ |
|
|||
Less: Pre-IPO net income attributable to Atlas Sand Company, LLC |
|
|
|
|
|
|
|
|
|
|||
Less: Net income attributable to redeemable noncontrolling interest |
|
|
|
|
|
|
|
|
|
|||
Net income attributable to Atlas Energy Solutions, Inc. |
|
$ |
|
|
|
|
|
|
|
|||
|
|
|
|
|
|
|
|
|
|
|||
Net income per common share |
|
|
|
|
|
|
|
|
|
|||
Basic |
|
$ |
|
|
|
|
|
|
|
|||
Diluted |
|
$ |
|
|
|
|
|
|
|
|||
Weighted average common shares outstanding |
|
|
|
|
|
|
|
|
|
|||
Basic |
|
|
|
|
|
|
|
|
|
|||
Diluted |
|
|
|
|
|
|
|
|
|
|||
The accompanying notes are an integral part of these consolidated financial statements.
F-4
Atlas Energy Solutions Inc.
Consolidated Statements of Stockholders' and Members' Equity and Redeemable Noncontrolling Interest
(in thousands, except per share data)
|
|
Redeemable |
|
|
Members' |
|
|
Old Atlas |
|
|
Old Atlas |
|
|
New Atlas |
|
|
|
|
|
|
|
|
Stockholders' |
|
||||||||||||||||||||
|
|
Noncontrolling |
|
|
Equity |
|
|
Class A |
|
|
Class B |
|
|
Common Stock |
|
|
Additional |
|
|
Accumulated |
|
|
and Members' |
|
||||||||||||||||||||
|
|
Interest |
|
|
Value |
|
|
Shares |
|
|
Value |
|
|
Shares |
|
|
Value |
|
|
Shares |
|
|
Value |
|
|
Paid-In-Capital |
|
|
Deficit |
|
|
Equity |
|
|||||||||||
Balance at December 31, 2020 |
|
$ |
— |
|
|
$ |
|
|
|
— |
|
|
$ |
— |
|
|
|
— |
|
|
$ |
— |
|
|
|
— |
|
|
$ |
— |
|
|
$ |
— |
|
|
$ |
— |
|
|
$ |
|
||
Issuance of class A units |
|
|
— |
|
|
|
|
|
|
— |
|
|
|
— |
|
|
|
— |
|
|
|
— |
|
|
|
— |
|
|
|
— |
|
|
|
— |
|
|
|
— |
|
|
|
|
||
Issuance of class C units |
|
|
— |
|
|
|
|
|
|
— |
|
|
|
— |
|
|
|
— |
|
|
|
— |
|
|
|
— |
|
|
|
— |
|
|
|
— |
|
|
|
— |
|
|
|
|
||
Member distributions |
|
|
— |
|
|
|
( |
) |
|
|
— |
|
|
|
— |
|
|
|
— |
|
|
|
— |
|
|
|
— |
|
|
|
— |
|
|
|
— |
|
|
|
— |
|
|
|
( |
) |
Unit-based compensation expense |
|
|
— |
|
|
|
|
|
|
— |
|
|
|
— |
|
|
|
— |
|
|
|
— |
|
|
|
— |
|
|
|
— |
|
|
|
— |
|
|
|
— |
|
|
|
|
||
Net income |
|
|
— |
|
|
|
|
|
|
— |
|
|
|
— |
|
|
|
— |
|
|
|
— |
|
|
|
— |
|
|
|
— |
|
|
|
— |
|
|
|
— |
|
|
|
|
||
Balance at December 31, 2021 |
|
$ |
— |
|
|
$ |
|
|
|
— |
|
|
$ |
— |
|
|
|
— |
|
|
$ |
— |
|
|
|
— |
|
|
$ |
— |
|
|
$ |
— |
|
|
$ |
— |
|
|
$ |
|
||
Member distributions |
|
|
— |
|
|
|
( |
) |
|
|
— |
|
|
|
— |
|
|
|
— |
|
|
|
— |
|
|
|
— |
|
|
|
— |
|
|
|
— |
|
|
|
— |
|
|
|
( |
) |
Unit-based compensation expense |
|
|
— |
|
|
|
|
|
|
— |
|
|
|
— |
|
|
|
— |
|
|
|
— |
|
|
|
— |
|
|
|
— |
|
|
|
— |
|
|
|
— |
|
|
|
|
||
Net income |
|
|
— |
|
|
|
|
|
|
— |
|
|
|
— |
|
|
|
— |
|
|
|
— |
|
|
|
— |
|
|
|
— |
|
|
|
— |
|
|
|
— |
|
|
|
|
||
Balance at December 31, 2022 |
|
$ |
— |
|
|
$ |
|
|
|
— |
|
|
$ |
— |
|
|
|
— |
|
|
$ |
— |
|
|
|
— |
|
|
$ |
— |
|
|
$ |
— |
|
|
$ |
— |
|
|
$ |
|
||
Member distributions |
|
|
— |
|
|
|
( |
) |
|
|
— |
|
|
|
— |
|
|
|
— |
|
|
|
— |
|
|
|
— |
|
|
|
— |
|
|
|
— |
|
|
|
— |
|
|
|
( |
) |
Net income prior |
|
|
— |
|
|
|
|
|
|
— |
|
|
|
— |
|
|
|
— |
|
|
|
— |
|
|
|
— |
|
|
|
— |
|
|
|
— |
|
|
|
— |
|
|
|
|
||
Effect of Reorganization and reclassification to redeemable noncontrolling interest (Note 1) |
|
|
|
|
|
( |
) |
|
|
|
|
|
|
|
|
|
|
|
|
|
|
— |
|
|
|
— |
|
|
|
( |
) |
|
|
— |
|
|
|
( |
) |
|||||
Issuance of Common Stock in |
|
|
— |
|
|
|
— |
|
|
|
|
|
|
|
|
|
— |
|
|
|
— |
|
|
|
— |
|
|
|
— |
|
|
|
|
|
|
— |
|
|
|
|
||||
Deferred tax liability arising |
|
|
— |
|
|
|
— |
|
|
|
— |
|
|
|
— |
|
|
|
— |
|
|
|
— |
|
|
|
— |
|
|
|
— |
|
|
|
( |
) |
|
|
— |
|
|
|
( |
) |
Deferred tax liability arising from Up-C Simplification |
|
|
— |
|
|
|
— |
|
|
|
— |
|
|
|
— |
|
|
|
— |
|
|
|
— |
|
|
|
— |
|
|
|
— |
|
|
|
( |
) |
|
|
— |
|
|
|
( |
) |
Stock-based compensation |
|
|
— |
|
|
|
— |
|
|
|
— |
|
|
|
— |
|
|
|
— |
|
|
|
— |
|
|
|
— |
|
|
|
— |
|
|
|
|
|
|
— |
|
|
|
|
||
Net income after IPO |
|
|
|
|
|
— |
|
|
|
— |
|
|
|
— |
|
|
|
— |
|
|
|
— |
|
|
|
— |
|
|
|
— |
|
|
|
— |
|
|
|
|
|
|
|
|||
$ |
|
|
( |
) |
|
|
— |
|
|
|
— |
|
|
|
— |
|
|
|
— |
|
|
|
— |
|
|
|
— |
|
|
|
— |
|
|
|
( |
) |
|
|
( |
) |
|
|
( |
) |
Dividend equivalent rights ($ |
|
|
— |
|
|
|
— |
|
|
|
— |
|
|
|
— |
|
|
|
— |
|
|
|
— |
|
|
|
— |
|
|
|
— |
|
|
|
( |
) |
|
|
( |
) |
|
|
( |
) |
Other distributions to redeemable non-controlling interest unitholders |
|
|
( |
) |
|
|
— |
|
|
|
— |
|
|
|
— |
|
|
|
— |
|
|
|
— |
|
|
|
— |
|
|
|
— |
|
|
|
— |
|
|
|
— |
|
|
|
— |
|
Redemption of operating units of Atlas Sand Operating, LLC for Old Atlas Class A Common Stock |
|
|
( |
) |
|
|
— |
|
|
|
|
|
|
|
|
|
( |
) |
|
|
( |
) |
|
|
— |
|
|
|
— |
|
|
|
|
|
|
— |
|
|
|
|
||||
Deferred tax liability arising |
|
|
— |
|
|
|
— |
|
|
|
— |
|
|
|
— |
|
|
|
— |
|
|
|
— |
|
|
|
— |
|
|
|
— |
|
|
|
( |
) |
|
|
— |
|
|
|
( |
) |
Issuance of Common Stock upon vesting of RSUs, net of shares withheld for income taxes |
|
|
— |
|
|
|
— |
|
|
|
|
|
|
— |
|
|
|
— |
|
|
|
— |
|
|
|
— |
|
|
|
— |
|
|
|
— |
|
|
|
— |
|
|
|
— |
|
|
Adjustment of redeemable noncontrolling interest to redemption amount |
|
|
|
|
|
— |
|
|
|
— |
|
|
|
— |
|
|
|
— |
|
|
|
— |
|
|
|
— |
|
|
|
— |
|
|
|
( |
) |
|
|
( |
) |
|
|
( |
) |
|
Effects of Up-C Simplification |
|
|
( |
) |
|
|
— |
|
|
|
( |
) |
|
|
( |
) |
|
|
( |
) |
|
|
( |
) |
|
|
|
|
|
|
|
|
|
|
|
|
|
|
|
|||||
Balance at December 31, 2023 |
|
$ |
|
|
$ |
|
|
|
— |
|
|
$ |
— |
|
|
|
— |
|
|
$ |
— |
|
|
|
|
|
$ |
|
|
$ |
|
|
$ |
( |
) |
|
$ |
|
||||||
The accompanying notes are an integral part of these consolidated financial statements.
F-5
Atlas Energy Solutions Inc.
Consolidated Statements of Cash Flows
(In thousands)
|
|
Year Ended December 31, |
|
|||||||||
|
|
2023 |
|
|
2022 |
|
|
2021 |
|
|||
Operating activities: |
|
|
|
|
|
|
|
|
|
|||
Net income |
|
$ |
|
|
$ |
|
|
$ |
|
|||
Adjustments to reconcile net income to net cash provided by operating activities: |
|
|
|
|
|
|
|
|
|
|||
Depreciation, depletion and accretion expense |
|
|
|
|
|
|
|
|
|
|||
Loss on extinguishment of debt |
|
|
|
|
|
|
|
|
|
|||
Amortization of debt discount |
|
|
|
|
|
|
|
|
|
|||
Amortization of deferred financing costs |
|
|
|
|
|
|
|
|
|
|||
Stock and unit-based compensation |
|
|
|
|
|
|
|
|
|
|||
Deferred income tax |
|
|
|
|
|
( |
) |
|
|
|
||
Interest paid-in-kind through issuance of additional term loans |
|
|
|
|
|
|
|
|
|
|||
Repayment of paid-in-kind interest borrowings |
|
|
|
|
|
|
|
|
( |
) |
||
Commodity derivatives gain |
|
|
|
|
|
( |
) |
|
|
( |
) |
|
Settlements on commodity derivatives |
|
|
|
|
|
|
|
|
|
|||
Other |
|
|
|
|
|
|
|
|
( |
) |
||
Changes in operating assets and liabilities: |
|
|
|
|
|
|
|
|
|
|||
Accounts receivable |
|
|
|
|
|
( |
) |
|
|
( |
) |
|
Accounts receivable - related party |
|
|
|
|
|
( |
) |
|
|
( |
) |
|
Inventories |
|
|
( |
) |
|
|
( |
) |
|
|
( |
) |
Spare part inventories |
|
|
( |
) |
|
|
( |
) |
|
|
( |
) |
Prepaid expenses and other current assets |
|
|
( |
) |
|
|
( |
) |
|
|
( |
) |
Other long-term assets |
|
|
( |
) |
|
|
( |
) |
|
|
( |
) |
Accounts payable |
|
|
|
|
|
|
|
|
|
|||
Accounts payable - related parties |
|
|
|
|
|
( |
) |
|
|
|
||
Deferred revenue |
|
|
|
|
|
( |
) |
|
|
|
||
Accrued liabilities and other liabilities |
|
|
|
|
|
|
|
|
|
|||
Net cash provided by operating activities |
|
|
|
|
|
|
|
|
|
|||
Investing activities: |
|
|
|
|
|
|
|
|
|
|||
Purchases of property, plant and equipment |
|
|
( |
) |
|
|
( |
) |
|
|
( |
) |
Net cash used in investing activities |
|
|
( |
) |
|
|
( |
) |
|
|
( |
) |
Financing Activities: |
|
|
|
|
|
|
|
|
|
|||
Proceeds from equity issuances |
|
|
|
|
|
|
|
|
|
|||
Net proceeds from IPO |
|
|
|
|
|
|
|
|
|
|||
Payment of offering costs |
|
|
( |
) |
|
|
|
|
|
|
||
Member distributions prior to IPO |
|
|
( |
) |
|
|
( |
) |
|
|
( |
) |
Proceeds from term loan borrowings |
|
|
|
|
|
|
|
|
|
|||
Principal payments on term loan borrowings |
|
|
( |
) |
|
|
( |
) |
|
|
( |
) |
Prepayment fee on 2021 Term Loan Credit Facility |
|
|
( |
) |
|
|
|
|
|
|
||
Debt extinguishment cost |
|
|
|
|
|
|
|
|
( |
) |
||
Issuance costs associated with debt financing |
|
|
( |
) |
|
|
( |
) |
|
|
( |
) |
Payments under finance and capital leases |
|
|
( |
) |
|
|
( |
) |
|
|
( |
) |
Dividends and distributions |
|
|
( |
) |
|
|
|
|
|
|
||
Net cash provided by (used in) financing activities |
|
|
|
|
|
( |
) |
|
|
|
||
Net increase in cash and cash equivalents |
|
|
|
|
|
|
|
|
|
|||
Cash and cash equivalents, beginning of period |
|
|
|
|
|
|
|
|
|
|||
Cash and cash equivalents, end of period |
|
$ |
|
|
$ |
|
|
$ |
|
|||
Supplemental cash flow information |
|
|
|
|
|
|
|
|
|
|||
Cash paid during the period for: |
|
|
|
|
|
|
|
|
|
|||
Interest |
|
$ |
|
|
$ |
|
|
$ |
|
|||
Taxes |
|
$ |
|
|
$ |
|
|
$ |
|
|||
Supplemental disclosure of non-cash investing activities: |
|
|
|
|
|
|
|
|
|
|||
Property, plant and equipment in accounts payable and accrued liabilities |
|
$ |
|
|
$ |
|
|
$ |
|
|||
Asset retirement obligations incurred |
|
$ |
|
|
$ |
|
|
$ |
|
|||
Redeemable noncontrolling interest cumulative adjustment to redemption value |
|
$ |
|
|
$ |
|
|
$ |
|
|||
Finance lease assets acquired through debt |
|
$ |
|
|
$ |
|
|
$ |
|
|||
Finance lease liabilities converted to debt |
|
$ |
|
|
$ |
|
|
$ |
|
|||
The accompanying notes are an integral part of these consolidated financial statements.
F-6
Atlas Energy Solutions Inc.
Notes to Consolidated Financial Statements
Note 1 – Business and Organization
Atlas Energy Solutions Inc. (f/k/a New Atlas HoldCo. Inc.) (“New Atlas” and together with its subsidiaries “we,” “us,” “our,” or the “Company”) was formed on June 28, 2023, pursuant to the laws of the State of Delaware, and is the successor to AESI Holdings Inc. (f/k/a Atlas Energy Solutions Inc.) (“Old Atlas”), a Delaware corporation. New Atlas is a holding corporation and the ultimate parent company of Atlas Sand Company, LLC (“Atlas LLC”), a Delaware limited liability company formed on April 20, 2017. Atlas LLC is a producer of high-quality, locally sourced 100 mesh and 40/70 sand used as a proppant during the well completion process. Proppant is necessary to facilitate the recovery of hydrocarbons from oil and natural gas wells. One hundred percent of Atlas LLC’s sand reserves are located in Winkler and Ward Counties, Texas, within the Permian Basin and operations consist of proppant production and processing facilities, including two facilities near Kermit, Texas and a third facility near Monahans, Texas.
We are currently building a logistics platform with the goal of increasing the efficiency, safety and sustainability of the oil and natural gas industry within the Permian Basin. This will include the Dune Express, an overland conveyor infrastructure solution currently under construction, coupled with our growing fleet of fit-for-purpose trucks and trailers.
We sell products and services primarily to oil and natural gas exploration and production companies and oilfield services companies primarily under supply agreements and also through spot sales on the open market.
Initial Public Offering
On March 13, 2023, Old Atlas completed its initial public offering (the “IPO”) of
Reorganization
Pursuant to a master reorganization agreement dated March 8, 2023, by and among Old Atlas, Atlas Sand Management Company, LLC, a Texas limited liability company (“ASMC”), Atlas LLC, Atlas Sand Holdings, LLC, a Delaware limited liability company (“Holdings”), Atlas Sand Operating, LLC, a Delaware limited liability company (“Atlas Operating”), Atlas Sand Holdings II, LLC, a Delaware limited liability company (“Holdings II”), Atlas Sand Management Company II, LLC, a Delaware limited liability company (“ASMC II”), and Atlas Sand Merger Sub, LLC, a Delaware limited liability company (“Merger Sub”), Old Atlas and the parties thereto completed certain restructuring transactions (the “Reorganization”) in connection with the IPO. As part of the Reorganization:
F-7
As a result of the Reorganization, (i) Old Atlas’s sole material asset consisted, and still consists, of Operating Units, (ii) Atlas Operating’s sole material asset consisted, and still consists, of 100% of the membership interests in Atlas LLC and (iii) Atlas LLC owned, and still owns, all of the Company’s operating assets. Old Atlas is the managing member of Atlas Operating and is responsible for all operational, management and administrative decisions relating to Atlas LLC’s business and consolidates the financial results of Atlas LLC and its subsidiaries.
As a result of the IPO and Reorganization:
On March 13, 2023, the date on which the Company closed the IPO, a corresponding deferred tax liability of approximately $
On September 13, 2023, we distributed the Operating Units and shares of Old Atlas Common Stock previously held by the HoldCos to the Legacy Owners in accordance with the distribution provisions of each respective HoldCo operating agreement. Immediately following the distribution, the Legacy Owners held shares of Old Atlas Class A Common Stock or Old Atlas Class B Common Stock (and corresponding Operating Units) directly.
Up-C Simplification
On October 2, 2023, Old Atlas and the Company completed the previously announced Up-C Simplification (as defined below) contemplated by the Master Reorganization Agreement (the “Master Reorganization Agreement”), dated as of July 31, 2023, by and among the Company, Old Atlas, Atlas Operating, AESI Merger Sub Inc., a Delaware corporation (“PubCo Merger Sub”), Atlas Operating Merger Sub, LLC, a Delaware limited liability company (“Opco Merger Sub” and, together with PubCo Merger Sub, the “Merger Subs”), and Holdings, in order to, among other things, reorganize under a new public holding company (the “Up-C Simplification”).
Pursuant to the Master Reorganization Agreement, (a) PubCo Merger Sub merged with and into Old Atlas (the “PubCo Merger”), as a result of which (i) each share of Old Atlas Class A Common Stock then issued and outstanding was exchanged for one share of Common Stock of New Atlas, par value $
In connection with the Up-C Simplification:
F-8
After completion of the Up-C Simplification, New Atlas replaced Old Atlas as the publicly held entity and, through its subsidiaries, conducts all of the operations previously conducted by Old Atlas, and Old Atlas remains the managing member of Atlas Operating.
The foregoing description is not complete and is qualified in its entirety by reference to the Master Reorganization Agreement, a copy of which is filed as Exhibit 2.2 to this Annual Report on Form 10-K (this “Annual Report”).
The Up-C Simplification was a common control transaction; therefore, the redeemable noncontrolling interest was acquired as an equity transaction. The redeemable noncontrolling interest was adjusted to the maximum redemption amount based on the 10-day volume-weighted average closing price of shares of Old Atlas Class A Common Stock at the redemption date. The carrying amount of the redeemable noncontrolling interest was reclassified to reflect the change in the Company’s ownership interest with an offsetting entry to additional paid-in capital. On October 2, 2023, the date the Up-C Simplification was completed, a corresponding deferred tax liability of approximately $
Note 2—Summary of Significant Accounting Policies
Basis of Presentation
The accompanying consolidated financial statements (the “Financial Statements”) have been prepared in accordance with generally accepted accounting principles in the United States of America (“GAAP”) and SEC requirements. All adjustments necessary for a fair presentation of the Financial Statements have been included. Such adjustments are of a normal, recurring nature. These consolidated financial statements include the accounts of New Atlas, Old Atlas, Atlas Operating, Atlas LLC, and Atlas LLC’s wholly-owned subsidiaries: Atlas Sand Employee Company, LLC; Atlas OLC Employee Company, LLC; Atlas Construction Employee Company, LLC; Atlas Sand Employee Holding Company, LLC; Fountainhead Logistics Employee Company, LLC; Atlas Sand Construction, LLC; OLC Kermit, LLC; OLC Monahans, LLC; Fountainhead Logistics, LLC; Fountainhead Transportation Services, LLC; and Fountainhead Equipment Leasing, LLC.
Reorganization
As discussed in Note 1 - Business and Organization, as a result of our IPO and the Reorganization and prior to the Up-C Simplification, Old Atlas became the managing member of Atlas Operating and consolidated entities in which it had a controlling financial interest through the end of the reporting period. The Reorganization was considered a transaction between entities under common control. As a result, the financial statements for periods prior to the IPO and the Reorganization have been adjusted to combine the previously separate entities for presentation purposes. However, Old Atlas and Atlas Operating had no operations or assets and liabilities prior to our IPO. As such, for periods prior to the completion of our IPO, the consolidated financial statements represent the historical financial position and results of operations of Atlas LLC and its subsidiaries. For periods after the completion of our IPO through the end of the reporting period, the financial position and results of operations include those of Old Atlas and New Atlas.
F-9
Up-C Simplification
As discussed in Note 1 - Business and Organization, as a result of the Up-C Simplification, New Atlas replaced Old Atlas as the publicly held entity and, through its subsidiaries, conducts all of the operations previously conducted by Old Atlas, and Old Atlas remains the managing member of Atlas Operating. The Up-C Simplification was considered an acquisition of noncontrolling interest transaction between entities under common control. As such, the consolidated financial position and results of operations of the Company are included in the consolidated financial statements of New Atlas on the same basis as previously presented except for the acquisition of noncontrolling interest which was accounted for as an equity transaction.
Consolidation
The Financial Statements include the accounts of the Company and wholly-owned subsidiaries. All intercompany transactions and accounts have been eliminated in consolidation.
Use of Estimates
The preparation of Consolidated Financial Statements in conformity with GAAP requires management to make estimates and assumptions that affect the reported amounts of assets and liabilities and the related disclosure of contingent assets and liabilities at the date of the Consolidated Financial Statements and the reported amounts of revenues and expenses during the reporting period. Significant estimates used in the preparation of these financial statements include, but are not limited to: the proppant reserves and their impact on calculating the depletion expense under the units-of-production method; the depreciation and amortization associated with property, plant and equipment; stock-based and unit-based compensation; asset retirement obligations; and certain liabilities. The Company bases its estimates on historical experience and on various assumptions that are believed to be reasonable under the circumstances. Actual results could differ from those estimates.
Cash and Cash Equivalents
Cash and cash equivalents consist of all highly liquid investments that are readily convertible into cash and have original maturities of three months or less when purchased. As of December 31, 2023, we have deposits of $
Concentrations of Credit Risk
Throughout 2023 and 2022, the Company has maintained cash balances on deposit and time deposits with financial institutions in excess of federally insured amounts; however, all these financial institutions hold an investment-grade rating by one or more major rating agencies.
For the year ended December 31, 2023, two customers comprised
Accounts Receivable and Allowance for Credit Losses
Accounts receivable are recorded at cost when earned and represent claims against third parties that will be settled in cash. These receivables generally do not bear interest. The carrying value of our receivables, net of allowance for credit losses, represents the estimated collectable amount. If events or changes in circumstances indicate specific receivable balances may be impaired, further consideration is given to our ability to collect those balances and the allowance is adjusted accordingly. We perform credit evaluations of new customers, and sometimes require deposits and prepayments, to mitigate credit risk. When it is probable that all or part of an outstanding balance will not be collected, we establish an allowance for credit losses. The Company recognized $
On January 1, 2023, we adopted Accounting Standards Update (“ASU”) 2016-13, Financial Instruments - Credit Losses (Topic 326) - Measurement of Credit Losses on Financial Instruments, which replaced the prior incurred loss impairment model with an expected credit loss impairment model for financial instruments, including accounts receivable. The adoption of ASU 2016-13 did not result in a material cumulative-effect adjustment to retained earnings on January 1, 2023.
F-10
We are exposed to credit losses primarily through sales of products and services. We analyze accounts receivable on an individual customer and overall basis through review of historical collection experience and current aging status of our customer accounts. We also consider the financial condition and economic environment of our customers in evaluating the need for an allowance. As of December 31, 2023, we had
As of December 31, 2023, four customers represented
Accounts Receivable—Related Parties
These amounts represent reimbursement of vendor payments from related parties and outstanding billings with a customer.
Inventories
Inventories include raw sand stockpiles, in-process product, and finished product available for shipment. Inventories are valued at the lower of cost or net realizable value. Cost is determined using a weighted average cost method. Production costs include direct excavation costs, production personnel and benefits costs, processing costs, rental equipment costs, other costs directly attributable to plant operations, depreciation, and depletion.
Spare Part Inventories
Spare part inventories include critical spares, materials and supplies. Spare part inventories are valued at the lower of cost or net realizable value. Cost is determined using a weighted average cost method. For both years ended December 31, 2023 and 2022, there was $
Prepaid Expenses and Other Current Assets
Prepaid expenses consist primarily of prepaid federal tax payments, prepaid software fees, prepaid rent, delay rental payments on leased land, insurance, trade show fees and sales events. These expenses are recognized over the contract period as events occur or when the future benefit is realized. As of December 31, 2023 and 2022, prepaid expenses were $
Property, Plant and Equipment, Including Depreciation and Depletion
Property, plant and equipment are recorded at cost and depreciated over their estimated useful lives using either the straight-line method or the units of production method. Construction in progress is comprised of assets which have not been placed into service and is not depreciated until the related assets or improvements are ready to be placed into service.
Interest incurred during the construction of plant facilities was capitalized. Capitalized interest was recorded within plant facilities associated with productive, depletable properties, until the plant facilities were placed into service, and is being amortized using the units of production method. The Company did
Costs of improvements that extend economic life or improve service potential are capitalized and depreciated over the remaining useful life of the asset, with routine repairs and maintenance expensed as incurred.
Fixed assets are carried at historical cost.
Plant facilities and equipment |
|
|
Furniture and office equipment |
|
|
Computer and network equipment |
|
|
Buildings and leasehold improvements |
|
|
Logistic equipment |
|
Mine development project costs are capitalized once the deposit is classified as a proven and probable reserve. Mine development costs include engineering, mineralogical studies, drilling and other related costs to develop the mine and remove the overburden to initially expose the mineral and allow for the construction of an access way. Exploration costs are expensed as incurred and classified as exploration expense.
F-11
Mining property and development costs are amortized using the units of production method on estimated recoverable tonnage, which equals estimated proven and probable reserves. The impact to reserve estimates is recognized on a prospective basis. Drilling and related costs are capitalized for deposits where proven and probable reserves exist. These activities are directed at obtaining additional information on the deposit or converting non-reserve minerals to proven and probable reserves, with the benefit being realized over a period greater than one year.
Impairment or Disposal of Property, Plant and Mine Development
The Company periodically evaluates whether current events or circumstances indicate that the carrying value of our property, plant and equipment assets may not be recoverable. If circumstances indicate that the carrying value may not be recoverable, the Company estimates future undiscounted net cash flows using estimates, including but not limited to estimates of proven and probable sand reserves, estimated future sales prices (considering historical and current prices, price trends and related factors), operating costs and anticipated capital expenditures. If the undiscounted cash flows are less than the carrying value of the assets, the Company recognizes an impairment loss equal to the amount by which the carrying value exceeds the fair value of the assets.
The recoverability of the carrying value of the Company’s mining property and development costs are dependent upon the successful development and commercial production of the Company’s mineral deposit and the related processing facilities. The Company’s evaluation of mineral properties for potential impairment primarily includes evaluating changes in the mineral reserves, or the underlying estimates and assumptions, including estimated production costs. Assessing the economic feasibility requires certain estimates including the prices of products to be produced and processing recovery rates, as well as operating and capital costs.
Deferred Offering Costs
Deferred offering costs consisted primarily of accounting, legal, and other fees related to our IPO. The deferred offering costs were offset against the proceeds from the offering. See Note 1 – Business and Organization - Initial Public Offering section for more details. As of December 31, 2023 and 2022, the Company had
Asset Retirement Obligations
In accordance with ASC 410-20, Asset Retirement Obligations, the Company records a liability for asset retirement obligations at the fair value of the estimated costs to retire a tangible long-lived asset at the time the liability is incurred, when there is a legal obligation to incur costs to retire the asset and when a reasonable estimate of the fair value of the obligation can be made. The Company has asset retirement obligations with respect to certain assets due to various contractual obligations to clean and/or dispose of those assets at the time they are retired.
A liability for the fair value of an asset retirement obligation, with a corresponding increase to the carrying value of related long-lived assets, is recognized at the time of an obligating event. The asset is depreciated using the straight-line method, and the discounted liability is increased through accretion over the expected timing of settlement.
The estimated liability is based on third-party estimates of costs to abandon, including estimated economic lives and external estimates as to the cost to bring the land to a state required by the lease agreements. The Company utilized a discounted rate reflecting management’s best estimate of the credit-adjusted risk-free rate. Revisions to the liability could occur due to changes in the estimated costs, changes in the economic life or if federal or state regulators enact new requirements regarding the abandonment. Accretion expense, which was $
Changes in the asset retirement obligations are as follows (in thousands):
|
|
For the Year Ended |
|
|||||
|
|
December 31, |
|
|||||
|
|
2023 |
|
|
2022 |
|
||
Beginning Balance |
|
$ |
|
|
$ |
|
||
Additions to liabilities |
|
|
|
|
|
|
||
Accretion expense |
|
|
|
|
|
|||
Ending Balance |
|
$ |
|
|
$ |
|
||
F-12
Deferred Debt Discount and Financing Costs
We defer costs directly associated with acquiring third-party financing, primarily loan origination costs and related professional expenses. Debt issuance costs associated with the 2023 Term Loan Credit Facility (as defined below under Note 6- Leases), the 2021 Term Loan Credit Facility (as defined below under Note 7- Debt), and the 2018 Term Loan Credit Facility (as defined below under Note 7- Debt) are deferred and amortized using the effective interest rate method over the life of the associated third-party debt financing. Deferred financing costs associated with the 2023 ABL Credit Facility (as defined below under Note 7- Debt) and the 2018 ABL Credit Facility (as defined below under Note 7- Debt) are amortized on a straight-line basis over the life of the agreement. Deferred financing costs are reflected as a direct deduction from the carrying amount of the related debt obligation on the Company’s consolidated balance sheets. Interest expense associated with the amortization of deferred financing costs was $
Our debt discounts are reflected as a direct reduction from the carrying amount of the debt obligation on the Company’s consolidated balance sheets. Such costs are amortized to interest expense using the effective interest method. The Company recognized $
Fair Value of Financial Instruments
Fair value is defined as the exchange price that would be received for an asset or paid to transfer a liability (an exit price) in the principal or most advantageous market for the asset or liability in an orderly transaction between market participants on the measurement date. Fair value is estimated by applying the following hierarchy, which prioritizes the inputs used to measure fair value into three levels and bases the categorization within the hierarchy upon the lowest level of input that is available and significant to the fair value measurement:
Level 1—Quoted prices in active markets for identical assets or liabilities.
Level 2—Observable inputs other than quoted prices in active markets for identical assets and liabilities, quoted prices for identical or similar assets or liabilities in inactive markets or other inputs that are observable or can be corroborated by observable market data for substantially the full term of the assets or liabilities.
Level 3—Inputs that are generally unobservable and typically reflect management’s estimate of assumptions that market participants would use in pricing the asset or liability.
The amounts reported in the balance sheets as current assets or liabilities, including cash and cash equivalents, accounts receivable, spare parts inventories, inventories, prepaid expenses and other current assets, accounts payable, accrued liabilities and deferred revenues approximate fair value due to the short-term maturities of these instruments. The Company’s policy is to recognize transfers between levels at the end of the period. This disclosure does not impact the Company’s financial position, results of operations or cash flows.
|
|
At December 31, 2023 |
|
|
At December 31, 2022 |
|
|
|
||||||||||
|
|
Carrying Value |
|
|
Fair Value |
|
|
Carrying Value |
|
|
Fair Value |
|
|
Valuation Technique |
||||
Financial liabilities |
|
|
|
|
|
|
|
|
|
|
|
|
|
|
||||
Outstanding principal amount of the 2021 Term Loan Credit Facility |
|
$ |
|
|
$ |
|
|
$ |
|
|
$ |
|
|
Level 2 – Market Approach |
||||
Outstanding principal amount of the 2023 Term Loan Credit Facility |
|
$ |
|
|
$ |
|
|
$ |
|
|
$ |
|
|
Level 2 – Market Approach |
||||
F-13
Leases
The Company leases office space, equipment, and vehicles under non-cancellable agreements. The Company’s leases may include options to extend or renew at the Company’s discretion. The measurement of the lease term includes options to extend or renew when it is reasonably certain the Company will exercise those options. Lease assets and liabilities are recognized at the commencement date based on the present value of minimum lease payments over the lease term. To determine the present value of future minimum lease payments, the Company uses the implicit rate when readily determinable; however, certain leases do not provide an implicit rate. Therefore, to determine the present value of minimum lease payments, the Company uses the incremental borrowing rate based on the information available at the commencement date of the lease. The Company’s finance lease agreements typically include an interest rate that is used to determine the present value of future lease payments. Short-term operating leases with an initial term of 12 months or less are not recorded on our balance sheet. Minimum lease payments are expensed on a straight-line basis over the lease term, including reasonably certain renewal options.
The Company periodically evaluates whether current events or circumstances indicate that the carrying value of our right-of-use assets exceeds fair value. If such a review should indicate that the carrying amount of right-of-use asset is not recoverable, the Company will reduce the carrying amount of such assets to fair value.
Environmental Costs and Other Contingencies
The Company recognizes liabilities for environmental and other contingencies when there is an exposure that indicates it is both probable that a liability has been incurred and the amount of loss can be reasonably estimated. Where the most likely outcome of a contingency can be reasonably estimated, the Company accrues a liability for that amount. Where the most likely outcome cannot be estimated a range of potential losses is established and, if no one amount in that range is more likely than any other, the amount at the low end of that range is accrued.
The Company records liabilities for environmental contingencies at the undiscounted amounts on the consolidated balance sheets as accrued liabilities and other liabilities when environmental assessments indicate that remediation efforts are probable, and costs can be reasonably estimated. Estimates of the liabilities are based on currently available facts and presently enacted laws and regulations, taking into consideration the likely effects of other societal and economic factors. These estimates are subject to revision in future periods based on actual costs or new circumstances. The Company capitalizes costs that benefit future periods and recognizes a current period charge in operations and maintenance expenses when clean-up efforts do not benefit future periods.
The Company evaluates potential recoveries of amounts from third parties, including insurance coverage, separately from the liability. Recovery is evaluated based on the solvency of the third party, among other factors. When recovery is assured, the Company records and reports an asset separately from the associated liability on the consolidated balance sheets.
Management is not aware of any environmental or other contingencies that would have a material effect on the consolidated financial statements for the years ended December 31, 2023, 2022 and 2021.
Revenues
Under ASC Topic 606-Revenue from Contracts with Customers (“ASC 606”), revenue recognition is based on the transfer of control, or the customer’s ability to benefit from the services and products in an amount that reflects the consideration expected to be received in exchange for those services and products. In recognizing revenue for products and services, the transaction price is determined from sales orders or contracts with customers.
The Company generates revenues from the sale of product that customers purchase for use in the oil and gas industry. Revenues are derived from product sold to customers under supply agreements, whose terms can extend for over one year, and from spot sales through individual purchase orders executed at prevailing market rates. The Company’s product revenues are primarily a function of the price per ton realized and the volumes sold. Pricing structures under the supply agreements are, in certain cases, subject to certain contractual adjustments and consist of a combination of negotiated pricing and fixed pricing. These arrangements may undergo periodic negotiations regarding pricing and volume requirements, which may occur in volatile market conditions.
The Company generates service revenue by providing transportation, storage solutions and contract labor services to companies in the oil and gas industry. Transportation services typically consist of transporting product from the plant facilities to the wellsite. The amounts invoiced reflect the transportation services rendered. The amounts invoiced for storage solutions and contract labor services reflect the amount of time these services were utilized in the billing period. Transportation, storage solutions and contract labor services are contracted through work orders executed under established pricing terms.
The Company recognizes revenue for product at a point in time following the transfer of control and satisfaction of the performance obligation of such items to the customer, under ASC 606, which typically occurs upon customer pick-up at the facilities. The Company recognizes revenue for services when services are rendered to the customer and the performance obligation is satisfied. The Company’s standard collection terms are generally 30 days, with certain customer payment terms extending up to 60 days.
F-14
Certain of the Company’s contracts contain shortfall provisions that calculate agreed upon fees that are billed when the customer does not meet the minimum purchases over a period of time defined in each contract and when collectability is reasonably certain. As the Company does not have the ability to predict customers’ orders over the period, there are constraints around the ability to recognize the variability in consideration related to this condition. The Company did
All of the Company’s revenue is generated in Texas and New Mexico. Revenue is disaggregated by product and service sales, no further disaggregation of revenue information is provided.
The Company has elected to use the ASC 606 practical expedients, pursuant to which it has excluded disclosures of transaction prices allocated to remaining performance obligations and when it expects to recognize such revenue. The remaining performance obligations are primarily comprised of unfulfilled contracts to deliver product, most of which hold a remaining duration of less than one year, and of which ultimate transaction prices will be allocated entirely to the unfulfilled contracts. The Company’s transaction prices under these contracts may be impacted by market conditions and potential contract negotiations, which have not yet been determined, and are therefore variable in nature.
The Company occasionally receives prepayments from customers for future deliveries of product. These prepayments represent consideration that is unconditional for which the Company has yet to transfer title to the product. Amounts received from customers in advance of product deliveries are recorded as contract liabilities referred to as deferred revenues and are recognized as revenue upon delivery of the product. The Company did
Unit-Based Compensation
The Company awards incentive units to members of management, consultants and employees as incentive compensation. The Company accounts for these awards under the measurement and recognition provisions of Accounting Standards Codification (“ASC”) 718, Compensation - Stock Compensation. The Company accounts for unit-based compensation by amortizing the fair value of the units, which is determined at the grant date, over the applicable vesting period for each tranche of the award using a graded vesting methodology.
The Company accounts for forfeitures as they occur and reverses any previously recognized unit-based compensation expense for the unvested portion of the awards that were forfeited. Unit-based compensation expense is recognized as selling, general and administrative expense on the Company’s consolidated statements of operations.
Stock-Based Compensation
We account for stock-based compensation, including grants of incentive units, restricted stock awards, time-based restricted stock units and performance share units, under the measurement and recognition provisions of Accounting Standards Codification (“ASC”) 718, Compensation – Stock Compensation (“ASC 718”). We account for stock and unit-based compensation by amortizing the fair value of the stock or units, which is determined at the grant date, on a straight-line basis unless the tranche method is required.
We account for forfeitures as they occur and reverse any previously recognized stock or unit-based compensation expense for the unvested portion of the awards that were forfeited. The number of forfeited shares shall again be available for purposes of awards under the LTIP. Stock-based compensation expense is recognized as selling, general and administrative expense on the Company’s consolidated statements of operations.
Earnings Per Share
We use the treasury stock method to determine the potential dilutive effect of outstanding restricted stock units and performance share units. We evaluated the potential dilutive effect of Old Atlas Class B Common Stock using the “if-converted” method, noting conversion of Old Atlas Class B Common Stock to Old Atlas Class A Common Stock would not have a dilutive impact to earnings per share. Each share of Old Atlas Class B Common Stock was issued in conjunction with and only as a consequence of the issuance by Atlas Operating of an Operating Unit to a securityholder other than Old Atlas. Old Atlas was a holding company the only assets of which were equity interests in Atlas Operating. Prior to the Up-C Simplification, the earnings of Atlas Operating per unit were attributable to Old Atlas and the other Legacy Owners, as the holders of the outstanding Operating Units. Because each holder of Operating Units other than Old Atlas also held one share of Old Atlas Class B Common Stock, and because Old Atlas consolidated the results of operations of Atlas Operating, the earnings per Operating Unit attributable to the Legacy Owners for the period prior to the Up-C Simplification were derivatively attributable to the corresponding shares of Old Atlas Class B Common Stock held by such Legacy Owners. For that reason, when a Legacy Owner determined to exercise its Redemption Right (as defined below in Note 9 - Stockholders' Equity) and exchange an Operating Unit (and corresponding share of Old Atlas Class B Common Stock), for a share of Old Atlas Class A Common Stock, there was not a dilutive impact to the earnings per share of the Old Atlas Class A Common Stock.
F-15
In connection with the Up-C Simplification, each Operating Unit issued and outstanding immediately prior to the effective time of the Mergers (the “Effective Time”), other than Operating Units held by Old Atlas, was exchanged for one share of New Atlas Common Stock, the holders of such Operating Units became stockholders of New Atlas, and all of the Old Atlas Class B Common Stock issued and outstanding immediately prior to the Effective Time was surrendered and cancelled for no consideration. This exchange did not have a dilutive impact on the fourth quarter 2023 earnings per share.
The presentation of earnings per share for the periods prior to the IPO is not meaningful and only earnings per share for periods subsequent to the IPO are presented herein. See Note 12 – Earnings Per Share for additional information.
Redeemable Noncontrolling Interest
Prior to the Up-C Simplification, discussed in Note 1- Business and Organization, we accounted for the Legacy Owners’ historical
Cost of Sales, Excluding Depreciation, Depletion and Accretion Expense
Cost of sales, excluding depreciation, depletion and accretion expense, related to product sales primarily consists of the cost to produce product, including direct and indirect labor, employee housing costs, excavation costs, rental equipment, maintenance expense, utilities, natural gas and royalty expense. Product related costs were $
Cost of sales, excluding depreciation, depletion and accretion expense, related to service sales primarily consists of direct and indirect labor, transportation costs and rental equipment. Service-related costs were $
Selling, General and Administrative Expense
Selling, general and administrative expense primarily consists of non-production personnel wages and benefits, insurance expense, travel and entertainment, advertising expense, professional fees, rent expense for the Company’s corporate office and office supplies, among other expenses to support the business.
Defined Contribution Plans
The Company has defined contribution plans covering substantially all employees who meet certain service and eligibility requirements. The Company’s matching contribution to defined contribution plans was approximately $
Income Taxes
For the purposes of this discussion, references to “Atlas Inc.” are to Old Atlas for reporting periods prior to the completion of the Up-C Simplification (the “Closing”), and to New Atlas following the Closing. Atlas Inc. is a corporation and it is subject to U.S. federal, state and local income taxes. The financial statement implications related to deferred tax liabilities of the Reorganization and Up-C Simplification referenced in Note 1 - Business and Organization and the tax impact of the Company’s status as a taxable corporation subject to U.S. federal, state and local income taxes have been reflected in the accompanying Financial Statements.
The Company, under ASC 740–Income Taxes (“ASC 740”), uses the asset and liability method of accounting for income taxes. Under the asset and liability method, deferred tax assets and liabilities are recognized for future tax consequences attributable to differences between the financial statement carrying amounts of existing assets and liabilities and their respective tax bases. Deferred tax assets and liabilities are measured using enacted tax rates in effect for the year in which those temporary differences are expected to be recovered or settled. The effect of a change in tax rate on deferred tax assets and liabilities is recognized in earnings in the period that includes the enactment date. A valuation allowance will be provided for deferred tax assets if it is more likely than not the deferred tax assets will not be realized.
F-16
Atlas LLC, the Company’s predecessor, was organized as a limited liability company. As a limited liability company, Atlas LLC has either been treated as a disregarded entity or a partnership for income tax purposes and, therefore, is not subject to U.S. federal income tax. Rather, the U.S. federal income tax liability with respect to the taxable income of our predecessor was passed through to its owners.
ASC 740 prescribes a recognition threshold and a measurement attribute for the financial statement recognition and measurement of tax positions taken or expected to be taken in a tax return. The Company evaluates the uncertainty in tax positions taken or expected to be taken in the course of preparing the consolidated financial statements to determine whether the tax positions are more likely than not of being sustained by the applicable tax authority. However, the conclusions regarding the evaluation are subject to review and may change based on factors including, but not limited to, ongoing analysis of tax laws, regulations, and interpretations thereof. As of December 31, 2023, and December 31, 2022, the Company did
Segments
The Company operates as one operating segment. Operating segments are defined as components of an enterprise for which separate financial information is evaluated regularly by the chief operating decision maker (“CODM”). The Company’s CODM was collectively its Chairman of the Board and Chief Executive Officer, and President and Chief Financial Officer.
The CODM evaluates the Company’s financial information and performance on a consolidated basis for purposes of making operating decisions and allocating resources. The Company operates with centralized functions and delivers most of its products and services in a similar way to all customers.
Recently Issued Accounting Pronouncements
Financial Instruments – In June 2016, the FASB issued ASU 2016-13, Financial Instruments—Credit Losses (Topic 326), which amended the guidance on the impairment of financial instruments. The standard added an impairment model, referred to as current expected credit loss, which is based on expected losses rather than incurred losses. The standard applies to most debt instruments, trade receivables, lease receivables, reinsurance receivables, financial guarantees and loan commitments. Under the guidance, companies are required to disclose credit quality indicators disaggregated by year of origination for a five-year period. In May 2019, ASU 2016-13 was subsequently amended by ASU 2019-04, Codification Improvements to Topic 326, Financial Instruments—Credit Losses, ASU 2019-05, Financial Instruments—Credit Losses (Topic 326): Targeted Transition Relief. The new guidance became effective for fiscal years beginning after December 15, 2022. We adopted ASU 2016-13 on January 1, 2023. ASU 2016-13 was applied using a modified retrospective approach, with a cumulative-effect adjustment to the opening balance of retained earnings as of the adoption date. We analyzed trade accounts receivable on an individual customer and overall basis through review of historical collection experience and current aging status of our customer accounts. We also consider the financial condition and economic environment of our customers in evaluating the need for an allowance. There was no material cumulative impact of adoption in the opening balance of retained earnings as of January 1, 2023. See - Accounts Receivable and Allowance for Credit Losses discussed within this Note.
Leases - On January 1, 2022, the Company adopted ASU 2016-02, Leases (Topic 842), as amended by other ASUs issued since February 2016, using the modified retrospective transition method applied at the effective date of the standard. By electing this optional transition method, information prior to January 1, 2022 has not been restated and continues to be reported under the accounting standards in effect for the period (ASC Topic 840). The Company elected the package of practical expedients permitted under the transition guidance within the new standard, including the option to carry forward the historical lease classifications and assessment of initial direct costs, account for lease and non-lease components as a single lease, and to not include leases with an initial term of less than 12 months in the lease assets and liabilities. Refer to Note 6- Leases for additional information.
Recently Issued Accounting Pronouncements Not Yet Effective
Income Taxes- In December 2023, the FASB issued ASU 2023-09, Income Taxes (Topic 740): Improvements to Income Tax Disclosures. The standard requires disaggregated information about a reporting entity's effective tax rate reconciliation as well as information on income taxes paid. The standard is intended to benefit investors by providing more detailed income tax disclosures that would be useful in making capital allocation decisions and applies to all entities subject to income taxes. The new standard is effective for annual periods beginning after December 15, 2024. The Company is currently evaluating the impact of the consolidated financial statements.
F-17
Segments- In November 2023, the Financial Accounting Standard Board, or FASB, issued ASU No. 2023-07, "Segment Reporting (Topic 280): Improvements to Reportable Segment Disclosures" to improve reportable segment disclosure requirements, primarily through enhanced disclosures about significant segment expenses and information used to assess segment performance. The ASU is effective for fiscal years beginning after December 15, 2023 on a retrospective basis, and for interim periods within fiscal years beginning after December 15, 2024. Early adoption is permitted. The Company is currently evaluating the impact that the adoption of this standard will have on its consolidated financial statements and related disclosures.
Disclosure Improvements- In October 2023, the FASB issued ASU 2023-06: Disclosure Improvements- Codification Amendments in Response to the SEC’s Disclosure Update and Simplification Initiative, which amends U.S. GAAP to reflect updates and simplifications to certain disclosure requirements referred to FASB by the SEC. The targeted amendments incorporate 14 of the 27 disclosures referred by the SEC into Codification. Some of the amendments represent clarifications to, or technical corrections of, the current requirements. ASU 2023-06 could move certain disclosures from the nonfinancial portions of SEC filings to the financial statement notes. Each amendment in ASU 2023-06 will only become effective if the SEC removes the related disclosure or presentation requirement from its existing regulation by June 30, 2027. No amendments were effective at December 31, 2023. The Company is currently evaluating the impact of the consolidated financial statements.
Note 3—Inventories
Inventories consisted of the following (in thousands):
|
|
|
|
|
|
|
||
|
|
For the Year Ended |
|
|||||
|
|
December 31, |
|
|||||
|
|
2023 |
|
|
2022 |
|
||
Raw materials |
|
$ |
|
|
$ |
|
||
Work-in-process |
|
|
|
|
|
|
||
Finished goods |
|
|
|
|
|
|
||
Inventories |
|
$ |
|
|
$ |
|
||
For the years ended December 31, 2023 and 2022,
Note 4—Property, Plant and Equipment, Net
Property, plant and equipment, net, consisted of the following (in thousands):
|
|
|
|
|
|
|
||
|
|
For the Year Ended |
|
|||||
|
|
December 31, |
|
|||||
|
|
2023 |
|
|
2022 |
|
||
Plant facilities associated with productive, depletable properties |
|
$ |
|
|
$ |
|
||
Plant equipment |
|
|
|
|
|
|
||
Land |
|
|
|
|
|
|
||
Furniture and office equipment |
|
|
|
|
|
|
||
Computer and network equipment |
|
|
|
|
|
|
||
Buildings and leasehold improvements |
|
|
|
|
|
|
||
Logistics equipment |
|
|
|
|
|
|
||
Construction in progress |
|
|
|
|
|
|
||
Property, plant and equipment |
|
|
|
|
|
|
||
Less: Accumulated depreciation and depletion |
|
|
( |
) |
|
|
( |
) |
Property, plant and equipment, net |
|
$ |
|
|
$ |
|
||
Depreciation expense recognized in depreciation, depletion and accretion expense was $
F-18
Note 5—Accrued Liabilities
Accrued liabilities consisted of the following (in thousands):
|
|
For the Year Ended |
|
|||||
|
|
December 31, |
|
|||||
|
|
2023 |
|
|
2022 |
|
||
Accrued capital expenditures |
|
$ |
|
|
$ |
|
||
Accrued personnel costs |
|
|
|
|
|
|
||
Accrued production costs |
|
|
|
|
|
|
||
Accrued royalties |
|
|
|
|
|
|
||
Professional services |
|
|
|
|
|
|
||
Sales and use tax payable |
|
|
|
|
|
|
||
Other |
|
|
|
|
|
|
||
Total accrued liabilities |
|
$ |
|
|
$ |
|
||
Note 6—Leases
The Company has operating and finance leases primarily for office space, equipment, and vehicles. The terms and conditions for these leases vary by the type of underlying asset.
The adoption of ASC Topic 842 resulted in the recognition of finance lease right-of-use assets, operating lease right-of-use assets, and lease liabilities for finance and operating leases. As of January 1, 2022, the adoption of the new standard resulted in the recognition of finance lease right-of-use assets of $
Certain leases include variable lease payments for items such as property taxes, insurance, maintenance, and other operating expenses associated with leased assets. Payments that vary based on an index or rate are included in the measurement of lease assets and liabilities at the rate as of the commencement date. All other variable lease payments are excluded from the measurement of lease assets and liabilities, and are recognized in the period in which the obligation for those payments is incurred.
The components of lease cost were as follows (in thousands):
|
|
For the Year Ended |
|
|||||
|
|
December 31, |
|
|||||
|
|
2023 |
|
|
2022 |
|
||
Finance lease cost: |
|
|
|
|
|
|
||
Amortization of right-of-use assets |
|
$ |
|
|
$ |
|
||
Interest on lease liabilities |
|
|
|
|
|
|
||
Operating lease cost |
|
|
|
|
|
|
||
Variable lease cost |
|
|
|
|
|
|
||
Short-term lease cost |
|
|
|
|
|
|
||
Total lease cost |
|
$ |
|
|
$ |
|
||
Supplemental cash flow and other information related to leases were as follows (in thousands):
|
|
For the Year Ended |
|
|||||
|
|
December 31, |
|
|||||
|
|
2023 |
|
|
2022 |
|
||
Cash paid for amounts included in the measurement of lease liabilities: |
|
|
|
|
|
|
||
Operating cash outflows from operating leases |
|
$ |
|
|
$ |
|
||
Operating cash outflows from finance leases |
|
$ |
|
|
$ |
|
||
Financing cash outflows from finance leases |
|
$ |
|
|
$ |
|
||
Right-of-use assets obtained in exchange for new lease liabilities: |
|
|
|
|
|
|
||
Operating leases |
|
$ |
|
|
$ |
|
||
Finance leases |
|
$ |
|
|
$ |
|
||
F-19
During the year ended December 31, 2022, the Company modified an agreement which related to certain operating right-of-use assets of $
Lease terms and discount rates were as follows:
|
|
For the Year Ended |
|
|||||
|
|
December 31, |
|
|||||
|
|
2023 |
|
|
2022 |
|
||
Weighted-average remaining lease term: |
|
|
|
|
|
|
||
Operating leases |
|
|
|
|
||||
Finance leases |
|
|
|
|
||||
Weighted-average discount rate: |
|
|
|
|
|
|
||
Operating leases |
|
|
% |
|
|
% |
||
Finance leases |
|
|
% |
|
|
% |
||
Future minimum lease commitments as of December 31, 2023, are as follows (in thousands):
|
|
Finance |
|
|
Operating |
|
||
2024 |
|
$ |
|
|
$ |
|
||
2025 |
|
|
|
|
|
|
||
2026 |
|
|
|
|
|
|
||
2027 |
|
|
|
|
|
|
||
2028 |
|
|
|
|
|
|
||
Thereafter |
|
|
|
|
|
|
||
Total lease payments |
|
|
|
|
|
|
||
Less imputed interest |
|
|
|
|
|
|
||
Total |
|
$ |
|
|
$ |
|
||
Supplemental balance sheet information related to our leases were as follows (in thousands):
|
|
|
|
|
|
|
|
||
|
|
|
|
|
|
|
|
||
|
Classification |
|
December 31, 2023 |
|
|
December 31, 2022 |
|
||
Operating Leases |
|
|
|
|
|
|
|
||
Current operating lease liabilities |
|
$ |
|
|
$ |
|
|||
Noncurrent operating lease liabilities |
|
$ |
|
|
$ |
|
|||
Finance Leases |
|
|
|
|
|
|
|
||
Current finance lease liabilities |
|
$ |
|
|
$ |
|
|||
Noncurrent finance lease liabilities |
|
$ |
|
|
$ |
|
|||
On July 31, 2023, Atlas LLC entered into a credit agreement (the “2023 Term Loan Credit Agreement”) with Stonebriar Commercial Finance LLC (“Stonebriar”), as administrative agent and initial lender, pursuant to which Stonebriar extended Atlas LLC a term loan credit facility comprising a $
On July 28, 2022, Atlas LLC entered into a master lease agreement with Stonebriar for the right, but not the obligation, to fund up to $
F-20
On May 16, 2022, Atlas LLC entered into a master lease agreement with Stonebriar for the right, but not the obligation, to fund up to $
As of December 31, 2023, we had no additional leases that have not yet commenced. Certain transportation and logistics leases discussed here are a component of the purchase commitments discussed in Note 8 - Commitments and Contingencies.
Note 7—Debt
Debt consists of the following (in thousands):
|
|
|
|
|
|
|
||
|
|
For the Year Ended |
|
|||||
|
|
December 31, |
|
|||||
|
|
2023 |
|
|
2022 |
|
||
Term Loan Credit Facility |
|
$ |
|
|
$ |
|
||
Less: Debt discount, net of accumulated amortization of $ |
|
|
( |
) |
|
|
( |
) |
Less: Deferred financing fees, net of accumulated amortization of $ |
|
|
( |
) |
|
|
( |
) |
Less: Current portion (a) |
|
|
|
|
|
( |
) |
|
Long-term debt |
|
$ |
|
|
$ |
|
||
(a) The current portion of long-term debt reflects payments based on the terms of the 2023 Term Loan Credit Facility and the 2021 Term Loan Credit Facility as of December 31, 2023 and December 31, 2022, respectively. |
|
|||||||
2023 Term Loan Credit Facility
On July 31, 2023, Atlas LLC entered into the 2023 Term Loan Credit Agreement.
The Initial Term Loan is payable in eighty-four consecutive monthly installments and a final payment of the remaining outstanding principal balance at maturity. The Initial Term Loan has a final maturity date of
Each delayed draw term loan (the “DDT Loans”) under the 2023 Term Loan Credit Facility will be payable in equal monthly installments, with the monthly installments comprising
At any time prior to the Maturity Date, Atlas LLC may redeem loans outstanding under the 2023 Term Loan Credit Facility, in whole or in part, at a price equal to
Dividends and distributions to equity holders are permitted to be made pursuant to certain limited exceptions and baskets described in the 2023 Term Loan Credit Agreement and otherwise generally subject to certain restrictions set forth in the 2023 Term Loan Credit Agreement, including the requirements that (a) no Event of Default (as defined under the 2023 Term Loan Credit Agreement) has occurred and is continuing and (b) Atlas LLC maintains at least $
The 2023 Term Loan Credit Facility includes certain non-financial covenants, including but not limited to restrictions on incurring additional debt and certain distributions. The 2023 Term Loan Credit Facility is subject to a maximum
F-21
Proceeds from the 2023 Term Loan Credit Facility were used to repay outstanding indebtedness under our previous 2021 Term Loan Credit Facility with Stonebriar, to repay obligations outstanding under certain equipment lease arrangements with Stonebriar and for general corporate purposes. As of December 31, 2023, the Company was in compliance with the covenants of the 2023 Term Loan Credit Facility.
The 2023 Term Loan Credit Facility is unconditionally guaranteed, jointly and severally, by Atlas LLC and its subsidiaries and secured by substantially all of the assets of Atlas LLC and its subsidiaries. The 2023 Term Loan Credit Facility is unconditionally guaranteed on an unsecured basis by Atlas Energy Solutions Inc.
2023 ABL Credit Facility
On February 22, 2023, Atlas LLC, certain of its subsidiaries, as guarantors, Bank of America, N.A., as agent, and certain financial institutions party thereto as lenders (the “2023 ABL Lenders”) entered into a Loan, Security and Guaranty Agreement (the “2023 ABL Credit Agreement”) pursuant to which the 2023 ABL Lenders provide revolving credit financing to Atlas LLC in an aggregate principal amount of up to $
Atlas LLC may also request swingline loans under the 2023 ABL Credit Agreement in an aggregate principal amount not to exceed $
Borrowings under the 2023 ABL Credit Facility bear interest, at Atlas LLC’s option, at either a base rate or Term SOFR, as applicable, plus an applicable margin based on average availability as set forth in the 2023 ABL Credit Agreement. Term SOFR loans bear interest at Term SOFR for the applicable interest period plus an applicable margin, which ranges from
The Borrowing Base was initially set at $
The 2023 ABL Credit Facility requires that if Availability is less than the greater of (i)
Under the 2023 ABL Credit Agreement, Atlas LLC is permitted to make payments of dividends and distributions pursuant to certain limited exceptions and baskets set forth therein and otherwise generally subject to certain restrictions described therein, including that (i) no Event of Default (as defined under the 2023 ABL Credit Agreement) has occurred and is continuing, and (ii) no loans and no more than $
F-22
The 2023 ABL Credit Facility contains certain customary representations and warranties, affirmative and negative covenants, and events of default. As of December 31, 2023, the Company was in compliance with the covenants under the 2023 ABL Credit Facility.
The 2023 ABL Credit Facility is unconditionally guaranteed, jointly and severally, by Atlas LLC and its subsidiaries and secured by substantially all of the assets of Atlas LLC and its subsidiaries.
2021 Term Loan Credit Facility
On October 20, 2021, Atlas LLC entered into a credit facility with Stonebriar (the “2021 Term Loan Credit Facility”). The loans outstanding under the 2021 Term Loan Credit Facility bore interest at a rate of
At any time prior to the October 1, 2027, maturity date, Atlas LLC could redeem the 2021 Term Loan Credit Facility, in whole or in part, at a price equal to
Proceeds from the 2021 Term Loan Credit Facility were used exclusively for general corporate purposes, which included the repayment of outstanding indebtedness under the 2018 Term Loan Credit Facility, and to make permitted distributions. As of December 31, 2022, the Atlas LLC was in compliance with the covenants of the 2021 Term Loan Credit Facility.
The 2021 Term Loan Credit Facility was unconditionally guaranteed, jointly and severally, by Atlas LLC and certain of its subsidiaries and secured by substantially all of the assets of Atlas LLC and certain of its subsidiaries, excluding: OLC Kermit, LLC, OLC Monahans, LLC and Atlas OLC Employee Company, LLC.
On February 22, 2023, Atlas LLC and Stonebriar agreed to amend the 2021 Term Loan Credit Facility to, among other things, permit Atlas LLC to enter into the 2023 ABL Credit Facility with the 2023 ABL Lenders and to update certain related terms.
F-23
Repayment of the 2021 Term Loan Credit Facility
On July 31, 2023, Atlas LLC entered into the 2023 Term Loan Credit Agreement with Stonebriar, proceeds from which were used to repay $
2018 Asset-Based Loan Credit Facility
On December 14, 2018, Atlas LLC entered into the 2018 ABL Credit Facility that provided revolving credit financing with a borrowing capacity of up to $
The 2018 ABL Credit Facility included a letter of credit which permitted issuances of letters of credit up to an aggregate amount of $
Atlas LLC could also request swingline loans under the agreement in an aggregate principal amount not to exceed $
Obligations under the 2018 ABL Credit Facility were secured by a first-priority lien on substantially all assets of Atlas LLC, until September 9, 2019, when the lenders and Atlas LLC entered into a split collateral intercreditor agreement, at which time the 2018 ABL Credit Facility became secured by a first-priority lien on inventory and accounts receivable held by Atlas LLC and its subsidiaries, and a second-priority lien on the remaining assets of Atlas LLC.
Initially, the borrowing base was set at $
Borrowings under the 2018 ABL Credit Facility bore interest, at Atlas LLC’s option, at either a base rate or London Interbank Offered Rate (“LIBOR”), as applicable, plus an applicable margin that ranges based on average excess availability. LIBOR loans bore interest at LIBOR plus an applicable margin, which ranged from
The 2018 ABL Credit Facility required that if the “availability,” as defined in the credit agreement governing the 2018 ABL Credit Facility (the “2018 ABL Credit Agreement”), was less than the greater of (i) 12.50% of the maximum credit and (ii) $
F-24
The 2018 ABL Credit Facility contained certain customary representations and warranties, affirmative covenants, and events of default, including, among other things, payment defaults, breach of representations and warranties, covenant defaults, cross-defaults and cross-acceleration to certain indebtedness, certain events of bankruptcy, certain events of abandonment, certain events under the Employee Retirement Income Security Act of 1974, as amended, material judgments, actual or asserted failure of any guaranty or security document supporting the 2018 ABL Credit Facility to be in full force and effect and change of control. If such an event of default had occurred, the lenders under the 2018 ABL Credit Facility would have been entitled to take various actions, including the acceleration of amounts due under the 2018 ABL Credit Facility and all actions permitted to be taken by a secured creditor. As of December 31, 2022, Atlas LLC was in compliance with the covenants of the 2018 ABL Credit Facility.
Limited Waiver and First Amendment to the 2018 ABL Credit Facility
On June 4, 2019, Atlas LLC and the lenders under the 2018 ABL Credit Facility entered into the First Amendment to the 2018 ABL Credit Facility (the “Limited Waiver and First Amendment”), which extended the due date for taking certain actions with regard to two wholly-owned subsidiaries of Atlas LLC, OLC Kermit, LLC and OLC Monahans, LLC, and allowed the making of limited investments into those subsidiaries. In addition, the lender agreed to waive any defaults or events of default that may have resulted from Atlas LLC’s acquisition of the two subsidiaries. The Limited Waiver and First Amendment was extended on each of August 31, 2019, December 31, 2019, and June 30, 2020.
Second Amendment to the 2018 ABL Credit Facility
On October 22, 2019, Atlas LLC and the lenders under the 2018 ABL Credit Facility agreed to further amend certain terms of the 2018 ABL Credit Facility to allow Atlas LLC to enter into insurance premium financing arrangements in the ordinary course of business.
Third Amendment to the 2018 ABL Credit Facility
On April 13, 2020, Atlas LLC and the lenders under the 2018 ABL Credit Facility agreed to further amend certain terms of the 2018 ABL Credit Facility allowing Atlas LLC, in the event the Qualified Small Business Administration Loan (“Qualified SBA Loan”) was not forgiven, or failed to qualify for forgiveness, in accordance with the terms of the Coronavirus Aid, Relief, and Economic Security Act (“CARES ACT”), to establish reserves up to the amount of the Qualified SBA Loan that was not forgiven or failed to qualify for forgiveness.
Fourth Amendment to the 2018 ABL Credit Facility
On March 23, 2021, Atlas LLC and the lenders under the 2018 ABL Credit Facility agreed to further amend certain terms of the 2018 ABL Credit Facility, including expanding the list of assets available for the calculation of available credit (the “Fourth Amendment to the 2018 ABL Credit Facility”). Subsequent to the execution of the Fourth Amendment to the 2018 ABL Credit Facility, the 2018 ABL Credit Facility was limited to the lessor of (i) the aggregate commitment and (ii) the sum of (a)
Fifth Amendment to the 2018 ABL Credit Facility
On October 20, 2021, Atlas LLC and the lender under the 2018 ABL Credit Facility agreed to further amend certain terms of the 2018 ABL Credit Facility, to, among other things, allow Atlas LLC to enter into the 2021 Term Loan Credit Facility to repay all borrowings outstanding under the 2018 Term Loan Credit Facility and to conform certain covenants under the 2018 ABL Credit Facility to the 2021 Term Loan Credit Facility.
Termination of the 2018 Asset-Based Loan Credit Facility
On February 22, 2023, Atlas LLC terminated the 2018 ABL Credit Facility. Atlas LLC had no borrowings under the 2018 ABL Credit Facility at the time of its termination. In connection with the termination, we charged the remaining balance of the deferred financing cost of $
F-25
2018 Term Loan Credit Facility
On January 30, 2018, the Atlas LLC entered into a credit facility with BlackGold SPV I LP (the “2018 Term Loan Credit Facility”) that provided debt financing in an aggregate principal amount of $
Obligations under the 2018 Term Loan Credit Facility were secured by a second-priority lien on substantially all assets of Atlas LLC, until September 9, 2019, when the lenders and Atlas LLC entered into the split collateral intercreditor agreement, at which time the 2018 Term Loan Credit Facility became secured by a second-priority lien on inventory and accounts receivable held by Atlas LLC and its subsidiaries, and a first-priority lien on the remaining assets of Atlas LLC. In addition, Atlas LLC’s subsidiaries had guaranteed Atlas LLC’s obligations under the 2018 Term Loan Credit Facility and had granted to the lender security interests in substantially all respective assets.
Borrowings under the 2018 Term Loan Credit Facility bore interest equal to the lesser of (1) the applicable interest rate, which was set at either
The 2018 Term Loan Credit Facility had a maturity date of
The 2018 Term Loan Credit Facility contained customary representations and warranties and customary affirmative and negative covenants, including limits or restrictions on Atlas LLC’s ability to incur liens, incur indebtedness, make certain restricted payments, merge or consolidate and dispose of assets. In addition, it contained customary events of default that entitled the lenders to cause any or all of Atlas LLC’s indebtedness under the 2018 Term Loan Credit Facility to become immediately due and payable. The events of default (some of which were subject to applicable grace or cure periods) included, among other things, nonpayment defaults, covenant defaults, cross-defaults to other material indebtedness, bankruptcy and insolvency defaults and material judgment defaults.
First Amendment to the 2018 Term Loan Credit Facility
On April 3, 2019, Atlas LLC and the lender under the 2018 Term Loan Credit Facility entered into the First Amendment to the 2018 Term Loan Credit Facility, which provided for borrowings of an additional $
In connection with the First Amendment to the 2018 Term Loan Credit Facility, additional warrants were delivered for up to
December 31, 2023 and 2022.
On June 20, 2019, Atlas LLC borrowed $
F-26
Limited Waiver and Second Amendment to the 2018 Term Loan Credit Facility
On June 4, 2019, Atlas LLC and the lender under the 2018 Term Loan Credit Facility entered into the Second Amendment to the 2018 Term Loan Credit Facility (the “Limited Waiver and Second Amendment”). The Limited Waiver and Second Amendment extended the due date for taking certain actions with regard to two wholly-owned subsidiaries of Atlas LLC, OLC Kermit, LLC and OLC Monahans, LLC, and allowed the making of limited investments into those subsidiaries. In addition, pursuant to the Limited Waiver and Second Amendment, the lender agreed to waive any defaults or events of default that may have resulted from Atlas LLC’s acquisition of the two subsidiaries. The Limited Waiver and Second Amendment was extended on each of August 31, 2019, December 31, 2019, June 30, 2020, and August 29, 2020.
Third Amendment to the 2018 Term Loan Credit Facility
On October 22, 2019, Atlas LLC and the lender under the 2018 Term Loan Credit Facility further agreed to amend certain terms of the 2018 Term Loan Credit Facility to allow Atlas LLC to enter into insurance premium financing arrangements in the ordinary course of business.
Fourth Amendment to the 2018 Term Loan Credit Facility
On April 13, 2020, Atlas LLC and the lender under the 2018 Term Loan Credit Facility further agreed to amend certain terms of the 2018 Term Loan Credit Facility to allow Atlas LLC to receive the Qualified Small Business Administration Loan in an amount not to exceed $
Extinguishment of the 2018 Term Loan Credit Facility
On October 25, 2021, Atlas LLC repaid all borrowings outstanding under the 2018 Term Loan Credit Facility, in connection with entering into a new 2021 Term Loan Credit Facility with Stonebriar. Atlas LLC paid a total of $
See Note 15 - Subsequent Events, for additional disclosure on debt agreements entered into subsequent to year end.
Debt Obligations
The following table sets forth future principal payment obligations as of December 31, 2023, based on the terms of the 2023 Term Loan Credit Facility (in thousands).
|
|
|
|
|
2024 |
|
$ |
|
|
2025 |
|
|
|
|
2026 |
|
|
|
|
2027 |
|
|
|
|
2028 |
|
|
|
|
Thereafter |
|
|
|
|
Total |
|
$ |
|
|
Note 8—Commitments and Contingencies
Royalty Agreements
Atlas LLC entered into a royalty agreement associated with its leased property at the Kermit facilities and a mining agreement associated with its leased property at the Monahans facility, in each case, with The Sealy & Smith Foundation, a related party. The royalty agreement associated with the Kermit facilities terminated on the date of our IPO, pursuant to the terms of the agreement. Under the mining agreement associated with the Monahans facility, we are committed to pay royalties on product sold from that facility and are required to pay a minimum royalties of $
Standby Letters of Credit
On February 22, 2023, the 2018 ABL Credit Facility was terminated and our standby letters of credit were transferred to our 2023 ABL Credit Facility. For the years ended December 31, 2023 and 2022, we had $
F-27
Lease Obligations
As of December 31, 2023, the Company’s estimated future minimum lease payments under long-term operating and finance lease agreements are associated with the Company’s adoption of ASC 842 and relate to lease payment maturities. The Company’s leases include office space, equipment and vehicles. See Note 6 - Leases, for additional disclosure on the Company’s estimated future minimum lease payments.
Purchase Commitments
On March 23, 2022, we entered into an agreement to purchase transportation and logistics equipment in the amount of $
Litigation
We are involved in various legal and administrative proceedings that arise from time to time in the ordinary course of doing business. Some of these proceedings may result in fines, penalties or judgments being assessed against us, which may adversely affect our financial results. In addition, from time to time, we are involved in various disputes, which may or may not be settled prior to legal proceedings being instituted and which may result in losses in excess of accrued liabilities, if any, relating to such unresolved disputes. Expenses related to litigation reduce operating income. We do not believe that the outcome of any of these proceedings or disputes would have a significant adverse effect on our financial position, long-term results of operations or cash flows. It is possible, however, that charges related to these matters could be significant to our results of operations or cash flows in any single accounting period. Management is not aware of any legal, environmental or other commitments and contingencies that would have a material effect on the Financial Statements.
Note 9— Stockholders Equity
Common Stock
Holders of shares of New Atlas Common Stock are entitled to
The Company is authorized to issue
Old Atlas Class A Common Stock
Holders of shares of Old Atlas Class A Common Stock were entitled to
Old Atlas Class B Common Stock
Holders of shares of Old Atlas Class B Common Stock were entitled to
F-28
Up-C Simplification
On October 2, 2023, Old Atlas and New Atlas completed the Up-C Simplification contemplated by the Master Reorganization Agreement.
Pursuant to the Master Reorganization Agreement, (a) PubCo Merger Sub merged with and into Old Atlas, as a result of which (i) each share of Old Atlas Class A Common Stock then issued and outstanding was exchanged for one share of New Atlas Common Stock, (ii) all of the Old Atlas Class B Common Stock then issued and outstanding was surrendered and cancelled for no consideration and (iii) Old Atlas survived the PubCo Merger as a direct, wholly-owned subsidiary of New Atlas; and (b) Opco Merger Sub merged with and into Atlas Operating, as a result of which (i) each Operating Unit then issued and outstanding, other than those Operating Units held by Old Atlas, was exchanged for one share of New Atlas Common Stock and (ii) Atlas Operating became a wholly-owned subsidiary of New Atlas.
After completion of the Up-C Simplification, New Atlas replaced Old Atlas as the publicly held entity and, through its subsidiaries, conducts all of the operations previously conducted by Old Atlas, and Old Atlas remains the managing member of Atlas Operating. See Note 1 – Business and Organization for more information.
Dividends and Distributions
In April 2023, Atlas Operating approved a distribution to its unitholders, Old Atlas and Holdings, in the aggregate amount of $
In May 2023, Atlas Operating approved and paid a distribution of $
On July 31, 2023, Atlas Operating approved and paid a distribution of $
In September 2023, Atlas Operating approved a distribution to its unitholders, Old Atlas and Holdings, in the aggregate amount of $
On October 30, 2023, the Company declared a dividend of $
On February 8, 2024, the Company decared a dividend. See Note 15 – Subsequent Events for additional information.
Note 10 – Redeemable Noncontrolling Interest
The redeemable noncontrolling interest represents the Legacy Owners’ historical
The Legacy Owners’ historical
F-29
In connection with the Up-C Simplification, each Operating Unit issued and outstanding immediately prior to the Effective Time, other than Operating Units held by Old Atlas, was exchanged for one share of New Atlas Common Stock, and the holders of such Operating Units became stockholders of New Atlas, and all of the Old Atlas Class B Common Stock issued and outstanding immediately prior to the Effective Time were surrendered and cancelled for no consideration. The Up-C Simplification was a common control transaction; therefore, the redeemable noncontrolling interest was acquired as an equity transaction. The redeemable noncontrolling interest was adjusted to the maximum redemption amount based on the 10-day volume-weighted average closing price of shares of Old Atlas Class A Common Stock at the redemption date. The carrying amount of the redeemable noncontrolling interest was reclassified to reflect the change in the Company’s ownership interest with an offsetting entry to additional paid-in capital.
From the date of the IPO through the date of the Up-C Simplification, we recorded adjustments to the value of the redeemable noncontrolling interest. Refer to the table below for the balance as of December 31, 2023:
|
|
Redeemable |
|
|
|
|
Noncontrolling Interest |
|
|
Balance at March 13, 2023 (1) |
|
$ |
|
|
Net income attribution post-IPO |
|
|
|
|
$ |
|
|
( |
) |
Other distributions to redeemable non-controlling interest unitholders |
|
|
( |
) |
Redemption of operating units of Atlas Operating for Old Atlas Class A Common Stock |
|
|
( |
) |
Adjustment of redeemable noncontrolling interest to redemption amount (2) |
|
|
|
|
Effects of Up-C Simplification |
|
|
( |
) |
Balance at December 31, 2023 |
|
$ |
|
|
(1)
Note 11 – Stock-Based and Unit-Based Compensation
Atlas Energy Solutions Inc. Long Term Incentive Plan
On March 8, 2023, we adopted the LTIP for the benefit of employees, directors and consultants of the Company and its affiliates. The LTIP provides for the grant of all or any of the following types of awards: (1) incentive stock options qualified as such under U.S. federal income tax laws; (2) stock options that do not qualify as incentive stock options; (3) stock appreciation rights; (4) restricted stock awards; (5) RSUs; (6) bonus stock; (7) dividend equivalents; (8) other stock-based awards; (9) cash awards; and (10) substitute awards. The shares to be delivered under the LTIP may be made available from (i) authorized but unissued shares, (ii) shares held as treasury stock or (iii) previously issued shares reacquired by us, including shares purchased on the open market.
In connection with the closing of the Up-C Simplification, New Atlas assumed the LTIP as well as the outstanding awards granted under the LTIP, including all awards of RSUs and performance share units, in each case, whether or not vested, that were then outstanding under the LTIP, and each (i) RSU grant notice and RSU agreement and (ii) performance share unit grant notice and performance share unit agreement, in each case, evidencing then-outstanding awards under the LTIP.
In connection with the assumption of the LTIP, the Company also assumed the remaining share reserves available for issuance under the LTIP, subject to applicable adjustments to relate to the New Atlas Common Stock. Subject to adjustment in accordance with the terms of the LTIP,
F-30
Restricted Stock Units
RSUs represent the right to receive shares of New Atlas Common Stock at the end of the vesting period in an amount equal to the number of RSUs that vest. RSUs granted to employees vest in three equal installments starting on the first anniversary of the date of grant, and RSUs granted to directors vest on the one-year anniversary of the date of grant, in each case, so long as the award recipient remains continuously employed or continues to provide services to the Board, as applicable. The RSUs are subject to restrictions on transfer and are generally subject to a risk of forfeiture if the award recipient ceases providing services to the Company prior to the date the award vests. If the participant’s employment with or service to the Company is terminated for cause or without good reason prior to the vesting of all of the RSUs, and unless such termination is a “Qualifying Termination” or due to a “Change in Control” as defined in the applicable RSU agreement, any unvested RSUs will generally terminate automatically and be forfeited without further notice and at no cost to the Company. In the event the Company declares and pays a dividend in respect of its outstanding shares of New Atlas Common Stock and, on the record date for such dividend, the participant holds RSUs that have not been settled, we will record the amount of such dividend in a bookkeeping account and pay to the participant an amount in cash equal to the cash dividends the participant would have received if the participant was the holder of record, as of such record date, of a number of shares of New Atlas Common Stock equal to the number of RSUs held by the participant that had not been settled as of such record date, such payment to be made on or within 60 days following the date on which such RSUs vest. The stock-based compensation expense of such RSUs was determined using the closing prices on grant date. We account for forfeitures as they occur. We recognized stock-based compensation related to RSUs of $
|
|
Number of Units |
|
|
Weighted Average |
|
||
Non-vested at December 31, 2022 |
|
|
|
|
$ |
|
||
Granted |
|
|
|
|
$ |
|
||
Vested |
|
|
( |
) |
|
$ |
|
|
Forfeited |
|
|
|
|
$ |
|
||
Non-vested at December 31, 2023 |
|
|
|
|
$ |
|
||
There was approximately $
Performance Share Units
Performance share units (“PSUs”) represent the right to receive one share of New Atlas Common Stock multiplied by the number of PSUs that become earned, and the number of PSUs that may vest range from
|
|
Number of Units |
|
|
Weighted Average |
|
||
Non-vested at December 31, 2022 |
|
|
|
|
$ |
|
||
Granted |
|
|
|
|
$ |
|
||
Vested |
|
|
( |
) |
|
$ |
|
|
Forfeited |
|
|
( |
) |
|
$ |
|
|
Non-vested at December 31, 2023 |
|
|
|
|
$ |
|
||
F-31
There was approximately $
Atlas LLC Incentive Plan and ASMC Incentive Plan
Prior to the IPO closing date, the Company recognized unit-based compensation expense for awards granted under two long-term incentive plans, the Atlas Sand Management Company, LLC Long-Term Incentive Plan (the “ASMC Plan”) and the Atlas Sand Company, LLC Long-Term Incentive Plan (the “ASCo Plan”). The ASMC Plan was adopted on September 15, 2017, by ASMC for officers, employees, directors, managers and consultants of ASMC (the “ASMC Participants”). The ASCo Plan was adopted by Atlas LLC on December 15, 2017, for officers, employees, directors, managers, consultants or other advisors of Atlas LLC (the “ASCo Participants”).
On May 28, 2018, Atlas LLC adopted the Atlas Sand Company, LLC Amended and Restated Long-Term Incentive Plan that reduced the authorized available awards to be issued under the ASCo Plan from
The Company has applied the guidance of FASB Interpretation 44, which establishes an accounting model whereby equity awards granted by a parent company to employees of a subsidiary are recognized in the financial statements of the subsidiary.
A summary of Atlas LLC’s Class P unit activity is as follows:
|
|
Number of Class |
|
|
Weighted Average |
|
||
Non-vested at December 31, 2021 |
|
|
|
|
$ |
|
||
Granted |
|
|
|
|
$ |
|
||
Vested |
|
|
( |
) |
|
$ |
|
|
Forfeited |
|
|
|
|
|
|
||
Non-vested at December 31, 2022 |
|
|
|
|
$ |
|
||
Granted |
|
|
|
|
|
|
||
Vested |
|
|
( |
) |
|
$ |
|
|
Forfeited |
|
|
|
|
|
|
||
Non-vested at December 31, 2023 |
|
|
|
|
|
|
||
We account for each tranche of the unit awards as compensatory awards in accordance with ASC 718, and as such, compensation expense is recognized over the service condition vesting period based on the grant date fair values using a graded vesting methodology. To determine grant date fair value, we valued these unit awards utilizing a Monte Carlo option pricing model, to take into consideration the probability of a market condition being met. This methodology involves making assumptions for the expected time to liquidity, volatility and risk-free rate.
We estimated expected volatility based on a 50/50 blend of historical and implied volatility. The risk-free interest rate is based on the yield on U.S. government bonds for a period commensurate with the expected term. The expected term is based on time to the expected exit date as of the valuation date based on the probability weighted average of exit scenario terms. We applied a discount to reflect the lack of marketability due to the absence of an active market for the units. Further, we assumed no expected dividend yield.
We recognized $
We recognized $
As of December 31, 2023, there were
F-32
Note 12 – Earnings per Share
Basic earnings per share (“EPS”) measures the performance of an entity over the reporting period. Diluted earnings per share measures the performance of an entity over the reporting period while giving effect to all potentially dilutive shares of common stock that were outstanding during the period. The Company uses the treasury stock method to determine the potential dilutive effect of vesting of its outstanding RSUs and PSUs. The Company does not use the two-class method as the Old Atlas Class B Common Stock, the unvested RSUs, and PSU awards are nonparticipating securities. During 2023, the issuance of Old Atlas Class A Common Stock in exchange for Operating Units held by the Legacy Owners (and their corresponding shares of Old Atlas Class B Common Stock) did not have a dilutive effect on EPS and was not recognized in dilutive earnings per share calculations.
As a result of the Up-C Simplification, the Company’s previous dual class structure was eliminated and the Company now trades under a single class of common stock. Please see Note 2 - Summary of Significant Accounting Policies -Earnings Per Share for more information.
There were
For the year ended December 31, 2023, the Company’s EPS calculation includes only its share of net income for the period subsequent to the IPO, and omits income prior to the IPO. In addition, the basic weighted average shares outstanding calculation is based on the actual days during which the shares were outstanding from the closing date of our IPO through December 31, 2023.
The following table reflects the allocation of net income to common stockholders and EPS computations for the period indicated based on a weighted average number of shares of common stock outstanding for the period (in thousands, except per share data):
|
|
|
For the Year Ended |
|
|
|
|
|
December 31, |
|
|
|
|
|
2023 |
|
|
Numerator: |
|
|
|
|
|
Net income |
|
|
$ |
|
|
Less: Pre-IPO net income attributable to Atlas Sand Company, LLC |
|
|
|
|
|
Less: Net income attributable to redeemable noncontrolling interest |
|
|
|
|
|
Net income attributable to Atlas Energy Solutions Inc. |
|
|
$ |
|
|
Denominator: |
|
|
|
|
|
Basic weighted average shares outstanding |
|
|
|
|
|
Dilutive potential of restricted stock units |
|
|
|
|
|
Dilutive potential of performance share units |
|
|
|
|
|
Diluted weighted average shares outstanding (1) |
|
|
$ |
|
|
|
|
|
|
|
|
Basic EPS attributable to holders of New Atlas Common Stock |
|
|
$ |
|
|
Diluted EPS attributable to holders of New Atlas Common Stock (1) |
|
|
$ |
|
|
(1) Shares of Old Atlas Class A Common Stock issued in exchange for Operating Units did not have a dilutive effect on EPS and were not included in the EPS calculation. |
|
||||
|
|
||||
The basic and diluted EPS for the year ended December 31, 2023, represents only the period from the IPO date to December 31, 2023, which represents the period wherein the Company had outstanding common stock.
Note 13—Income Taxes
The Company’s predecessor, Atlas LLC, was a limited liability company that elected to be treated as a partnership for income tax purposes and, therefore, was not subject to U.S. federal income tax. Rather, the U.S. federal income tax liability with respect to the taxable income of Atlas LLC is passed through to its owners. However, Atlas LLC’s operations located in Texas are subject to an entity-level tax. Texas imposes a franchise tax, commonly referred to as the Texas margin tax, which is considered an income tax, at a rate of
F-33
On October 2, 2023, the Company completed the Up-C Simplification. The tax implications of the Up-C Simplification have been reflected in the accompanying Financial Statements. On October 2, 2023, a corresponding deferred tax liability of approximately $
For the years ending December 31, 2023, 2022, and 2021, the effective combined U.S. federal and state income tax rate was
The components of the income tax provision are as follows (in thousands):
|
|
For the Year Ended |
|
|||||||||
|
|
December 31, |
|
|||||||||
|
|
2023 |
|
|
2022 |
|
|
2021 |
|
|||
Current income tax provision: |
|
|
|
|
|
|
|
|
|
|||
Federal |
|
$ |
|
|
$ |
|
|
$ |
|
|||
State |
|
|
|
|
|
|
|
|
|
|||
Total current income tax provision |
|
$ |
|
|
$ |
|
|
$ |
|
|||
Deferred income tax provision: |
|
|
|
|
|
|
|
|
|
|||
Federal |
|
$ |
|
|
$ |
|
|
$ |
|
|||
State |
|
|
|
|
|
( |
) |
|
|
|
||
Total deferred income tax provision (benefit): |
|
$ |
|
|
$ |
( |
) |
|
$ |
|
||
Income tax provision |
|
$ |
|
|
$ |
|
|
$ |
|
|||
The effective tax rate on pre-tax income differs from the Federal statutory rate of
|
|
For the Year Ended |
|
|||||||||
|
|
December 31, |
|
|||||||||
|
|
2023 |
|
|
2022 |
|
|
2021 |
|
|||
Taxes at federal statutory rate |
|
$ |
|
|
$ |
|
|
$ |
|
|||
Less: Pre-IPO activity attributable to Atlas Sand Company, LLC |
|
|
( |
) |
|
|
( |
) |
|
|
( |
) |
Less: noncontrolling interest |
|
|
( |
) |
|
|
|
|
|
|
||
State income tax expense |
|
|
|
|
|
|
|
|
|
|||
Other |
|
|
|
|
|
|
|
|
|
|||
Income tax expense |
|
$ |
|
|
$ |
|
|
$ |
|
|||
Effective tax rate |
|
|
% |
|
|
% |
|
|
% |
|||
The tax effects of cumulative temporary differences that give rise to significant deferred tax assets and deferred tax liabilities are presented below (in thousands):
|
|
For the Year Ended |
|
|||||
|
|
December 31, |
|
|||||
|
|
2023 |
|
|
2022 |
|
||
Deferred tax assets |
|
|
|
|
|
|
||
Amortizable intangible assets |
|
$ |
|
|
$ |
|
||
Net operating loss carryforward |
|
|
|
|
|
|
||
Employee compensation |
|
|
|
|
|
|
||
Other |
|
|
|
|
|
|
||
Total deferred tax assets |
|
$ |
|
|
$ |
|
||
Deferred tax liabilities |
|
|
|
|
|
|
||
Inventories |
|
$ |
( |
) |
|
$ |
|
|
Fixed assets |
|
|
( |
) |
|
|
( |
) |
Depletable assets |
|
|
( |
) |
|
|
( |
) |
Other |
|
|
( |
) |
|
|
|
|
Total deferred tax liabilities |
|
|
( |
) |
|
|
( |
) |
Deferred tax liability, net |
|
$ |
( |
) |
|
$ |
( |
) |
F-34
Deferred income tax assets and liabilities are recognized for temporary differences between the basis of assets and liabilities for financial reporting and tax purposes. Deferred tax assets are reduced by a valuation allowance if, based on all available evidence, it is more likely than not that some portion or all of the deferred tax asset will not be realized. In determining the need for a valuation allowance, the Company considers all available evidence, both positive and negative, including future reversals of existing taxable temporary differences, future taxable income exclusive of reversing temporary differences and carryforwards, taxable income in carryback years if carryback is permitted by the tax law, and the availability of prudent and feasible tax planning strategies that can be implemented, if necessary, to realize deferred tax assets. While the Company has a limited historical financial information as a standalone C-Corporation, the Company’s predecessor has a history of creating pre-tax income in previous periods. The Company is in a substantial cumulative book income position (inclusive of adjustments for permanent differences) which is considered strong positive evidence by which a Company can consider when evaluating the realizability of existing deferred tax assets (including those of a long-term nature). In addition, the Company is currently in an overall deferred tax liability position.
As of December 31, 2023, we have federal net operating loss carryforwards of approximately $
As of December 31, 2023, and December 31, 2022, the Company did
Note 14 – Related-Party Transactions
Brigham Oil & Gas, LLC
Atlas LLC has sold proppant to a customer, Brigham Oil & Gas, LLC (“Brigham Oil & Gas”), which is controlled by our Executive Chairman and Chief Executive Officer, Bud Brigham. The Company made
Brigham Land Management LLC
Brigham Land Management LLC (“Brigham Land”) provides us with landman services for certain of our projects and initiatives. The services are provided on a per hour basis at market prices. Brigham Land is owned and controlled by Vince Brigham, an advisor to the Company and the brother of our Executive Chairman and Chief Executive Officer, Bud Brigham. For the years ended December 31, 2023, 2022, and 2021, we made aggregate payments to Brigham Land equal to approximately $
Brigham Earth, LLC
Brigham Earth, LLC (“Brigham Earth”) provides us with professional and consulting services as well as access to certain information and software systems. Brigham Earth is owned and controlled by our Executive Chairman and Chief Executive Officer, Bud Brigham. For the years ended December 31, 2023, 2022, and 2021, our aggregate payments to Brigham Earth for these services were approximately $
Anthem Ventures, LLC
Anthem Ventures, LLC (“Anthem Ventures”) provides us with transportation services. Anthem Ventures is owned and controlled by our Executive Chairman and Chief Executive Officer, Bud Brigham. For the years ended December 31, 2023, 2022, and 2021, our aggregate payments to Anthem Ventures for these services were approximately $
In a Good Mood
In a Good Mood, LLC (“In a Good Mood”) provides the Company with access, at cost, to reserved space in the Moody Center in Austin, Texas for concerts, sporting events and other opportunities as a benefit to our employees and for business entertainment. In a Good Mood is owned and controlled by our Executive Chairman and Chief Executive Officer, Bud Brigham. For the years ended December 31, 2023 and 2022, we made payments of approximately $
The Sealy & Smith Foundation
Refer to Note 8 – Commitments and contingencies for disclosures related to the Company’s royalty agreement and mining agreement with The Sealy & Smith Foundation, a related party.
F-35
Reorganization
Refer to Note 1 – Business and Organization for disclosures related to the Company’s transactions with affiliates including entities controlled by Bud Brigham in connection with the Reorganization.
Registration Rights Agreement
In connection with the closing of the IPO, we entered into a registration rights agreement with certain Legacy Owners (the “Original Registration Rights Agreement”) covering, in the aggregate, approximately
On October 2, 2023, the Company entered into an amended and restated registration rights agreement (the “A&R Registration Rights Agreement”) with New Atlas and certain stockholders identified on the signature pages thereto. The A&R Registration Rights Agreement was entered into in order to, among other things, provide for the assumption of Old Atlas’s obligations under the Original Registration Rights Agreement by New Atlas. The A&R Registration Rights Agreement is substantially similar to the Original Registration Rights Agreement, but contains certain administrative and clarifying changes to reflect the transition from a dual class capital structure to a single class of common stock. We will generally be obligated to pay all registration expenses in connection with these registration obligations, regardless of whether a registration statement is filed or becomes effective. These registration rights are subject to certain conditions and limitations.
The foregoing description does not purport to be complete and is qualified in its entirety by reference to the full text of the A&R Registration Rights Agreement, which is attached as Exhibit 4.1 to this Annual Report.
Stockholders’ Agreement
In connection with the closing of the IPO, we entered into a stockholders’ agreement (the “Original Stockholders’ Agreement”) with certain of our Legacy Owners (the “Principal Stockholders”). Among other things, the Original Stockholders’ Agreement provides our Executive Chairman and Chief Executive Officer, Bud Brigham, the right to designate a certain number of nominees for election or appointment to our Board as described below according to the percentage of the Company’s common stock held by such Principal Stockholders.
Pursuant to the Original Stockholders’ Agreement, we are required to take all necessary actions, to the fullest extent permitted by applicable law (including with respect to any fiduciary duties under Delaware law), to cause the election or appointment of the nominees designated by Mr. Brigham or his affiliates, and each of the Principal Stockholders agreed to cause its respective shares of the Company’s common stock to be voted in favor of the election of each of the nominees designated by Mr. Brigham or his affiliates. Mr. Brigham or his affiliates will be entitled to designate the replacement for any of his respective board designees whose board service terminates prior to the end of such director’s term.
In addition, the Original Stockholders’ Agreement provided that for so long as Mr. Brigham or any of his affiliates is entitled to designate any members of our Board, we are required to take all necessary actions to cause each of the audit committee, compensation committee and nominating and corporate governance committee of our Board to include in its membership at least one director designated by Mr. Brigham or his affiliates, except to the extent that such membership would violate applicable securities laws or stock exchange rules.
Furthermore, so long as the Principal Stockholders collectively beneficially own at least a majority of the outstanding shares of our common stock, we have agreed not to take, and will cause our subsidiaries not to take, the following actions (or enter into an agreement to take such actions) without the prior consent of Mr. Brigham or his affiliates, subject to certain exceptions:
On October 2, 2023, Old Atlas entered into an amended and restated stockholders’ agreement (the “A&R Stockholders’ Agreement”) with New Atlas and certain of the Principal Stockholders. The A&R Stockholders’ Agreement was entered into in order to, among other things, provide for the assumption of Old Atlas’s obligations under the Original Stockholders’ Agreement by New Atlas. The A&R Stockholders’ Agreement is substantially similar to the Original Stockholders’ Agreement, but contains certain administrative and clarifying changes to reflect the transition from a dual class capital structure to a single class of common stock.
The foregoing description is not complete and is qualified in its entirety by reference to the full text of the A&R Stockholders’ Agreement, which is attached as Exhibit 10.1 to this Annual Report.
F-36
Up-C Simplification
Refer to Note 1 – Business and Organization for disclosures related to the Company’s Up-C Simplification.
Note 15 – Subsequent Events
Dividend
On February 8, 2024, the Company declared a dividend of $
Acquisition
On February 26, 2024, Atlas entered into an Agreement and Plan of Merger (the “Merger Agreement”) with Hi-Crush Inc., a Delaware corporation (“Hi-Crush”), pursuant to which Atlas will acquire substantially all of Hi-Crush’s Permian Basin proppant production and North American logistics businesses and operations (the “Hi-Crush Transaction”).
Under the terms and conditions of the Merger Agreement, which has an economic effective time of 11:59 p.m. CT on February 29, 2024, the aggregate consideration to be paid to the Hi-Crush stockholders in the Hi-Crush Transaction will consist of (i) cash consideration of $
The Merger Agreement and the Hi-Crush Transaction have been unanimously approved by a Special Committee of the Atlas board of directors composed of a majority of independent directors, as well as the boards of directors of both companies. The completion of the Hi-Crush Transaction is subject to the satisfaction or waiver of customary closing conditions, including Hi-Crush’s delivery of a written consent approving the Hi-Crush Transaction signed by Hi-Crush stockholders holding at least
Debt Agreements
Seller Note
In accordance with the Merger Agreement, Atlas LLC will issue the Seller Note in favor of the Hi-Crush Stockholders in the original aggregate principal amount of $
First Amendment to the 2023 ABL Credit Facility
On February 26, 2024, Atlas LLC and certain other subsidiaries of the Company entered into that certain First Amendment to Loan, Security and Guaranty Agreement (the “ABL Amendment”), among Atlas LLC, the subsidiary guarantors party thereto, the lenders party thereto and Bank of America, N.A., as administrative agent (the “ABL Agent”). The ABL Amendment amends that certain Loan, Security and Guaranty Agreement dated as of February 22, 2023 (the “ABL Credit Agreement”), among Atlas LLC, the subsidiary guarantors party thereto from time to time, the lenders party thereto from time to time and the ABL Agent.
Among other things, the ABL Amendment (a) will, subject to certain conditions to be satisfied in connection with the Closing, increase the revolving commitment amount under the ABL Credit Agreement from $
First Amendment to the 2023 Term Loan Credit Facility
On February 26, 2024 the Company, Atlas LLC and certain other subsidiaries of the Company entered into that certain First Amendment to Credit Agreement (the “Term Loan Amendment”), among Company, Atlas LLC, the subsidiary guarantors party thereto, the lenders party thereto and Stonebriar Commercial Finance, LLC, a Delaware limited liability company, as administrative agent (the “Term Agent”). The Term Loan Amendment amends that certain Credit Agreement dated as of July 31, 2023 (the “2023 Term Loan Credit Agreement”) among Atlas LLC, the lenders party thereto from time to time and the Term Agent.
Among other things, the Term Loan Amendment (a) provided an incremental delayed draw term loan facility of $
F-37
Item 9. Changes in and Disagreements With Accountants on Accounting and Financial Disclosure.
None.
Item 9A. Controls and Procedures.
Evaluation of Disclosure Controls and Procedures
As required by Rule 13a-15(b) under the Exchange Act, we have evaluated, under the supervision and with the participation of management, including our principal executive officer and principal financial officer, the effectiveness of the design and operation of our disclosure controls and procedures (as defined in Rules 13a-15(e) and 15d-15(e) under the Exchange Act) as of the end of the period covered by this Annual Report. Our disclosure controls and procedures are designed to provide reasonable assurance that the information required to be disclosed by us in reports that we file or submit under the Exchange Act is accumulated and communicated to management, including our principal executive officer and principal financial officer, as appropriate, to allow timely decisions regarding required disclosure and is recorded, processed, summarized and reported within the time periods specified in the rules and forms of the SEC. Based upon that evaluation, our principal executive officer and principal financial officer concluded that our disclosure controls and procedures were effective as of December 31, 2023 at a level of reasonable assurance.
Management’s Annual Report on Internal Control over Financial Reporting
This Annual Report does not include a report of management’s assessment regarding internal control over financial reporting or an attestation report of the Company's registered public accounting firm due to a transition period established by rules of the SEC for newly public companies.
Changes in Internal Control Over Financial Reporting
We will not be required to make our first assessment of the effectiveness of our internal control over financial reporting under Section 404 of the Sarbanes-Oxley Act until our Annual Report on Form 10-K for the fiscal year ended December 31, 2024. Further, our independent registered public accounting firm is not yet required to formally attest to the effectiveness of our internal controls over financial reporting and will not be required to do so for as long as we are an “emerging growth company” pursuant to the provisions of the JOBS Act. Please see the section titled “Management’s Discussion and Analysis of Financial Condition and Results of Operations—Emerging Growth Company Status” for more information.
Limitations on Effectiveness of Controls and Procedures
In designing and evaluating our disclosure controls and procedures, management recognizes that any controls and procedures, no matter how well designed and operated, can provide only reasonable assurance of achieving the desired control objectives. In addition, the design of disclosure controls and procedures must reflect the fact that there are resource constraints and that management is required to apply judgment in evaluating the benefits of possible controls and procedures relative to their costs. Our management, including our Chief Executive Officer and Chief Financial Officer, believe that our disclosure controls and procedures and internal control over financial reporting are designed to provide reasonable assurance of achieving their objectives and are effective at the reasonable assurance level. However, our management does not expect that our disclosure controls and procedures or our internal control over financial reporting will prevent all errors and all fraud.
Item 9B. Other Information.
Trading Plans
During the year ended December 31, 2023, no director or officer of the Company
Item 9C. Disclosure Regarding Foreign Jurisdictions that Prevent Inspections.
None.
108
PART III
Item 10. Directors, Executive Officers and Corporate Governance.
The information required by this item (and only such information) is incorporated by reference to our Definitive Proxy Statement for our 2024 Annual Meeting of Shareholders to be filed with the SEC within 120 days of December 31, 2023 (“Proxy Statement”).
Item 11. Executive Compensation.
The information required by this item (and only such information) is incorporated by reference to our Proxy Statement.
Item 12. Security Ownership of Certain Beneficial Owners and Management and Related Stockholder Matters.
The information required by this item (and only such information) is incorporated by reference to our Proxy Statement.
Item 13. Certain Relationships and Related Transactions, and Director Independence.
The information required by this item (and only such information) is incorporated by reference to our Proxy Statement.
Item 14. Principal Accounting Fees and Services.
The information required by this item (and only such information) is incorporated by reference to our Proxy Statement.
109
PART IV
Item 15. Exhibits, Financial Statement Schedules.
Reference is made to Part II, Item 8 of this Annual Report on Form 10-K.
The financial statement schedules have been omitted because they are either not required, not applicable or the information required to be presented is included in the Company’s consolidated financial statements and notes thereto.
The exhibits required to be filed or furnished pursuant to Item 601 of Regulation S-K are set forth below.
110
Exhibit Index
Exhibit Number |
|
Description |
|
||
|
||
|
||
|
||
|
||
|
Description of Securities Registered Pursuant to Section 12 of the Securities Exchange Act of 1934. |
|
|
||
|
||
|
||
|
||
|
||
|
||
|
Atlas Energy Solutions Inc. Management Change in Control Severance Plan. |
|
|
||
|
||
|
||
|
||
|
||
|
||
|
||
|
||
|
||
|
||
|
111
|
||
|
||
|
||
|
John T. Boyd Company Summary of Reserves at December 31, 2023. |
|
|
||
101.INS* |
|
Inline XBRL Instance Document – the instance document does not appear in the Interactive Data File because XBRL tags are embedded within the Inline XBRL document |
101.SCH* |
|
Inline XBRL Taxonomy Extension Schema With Embedded Linkbase Documents |
104* |
|
Cover page formatted as Inline XBRL and contained in Exhibit 101 |
* Filed herewith
†Compensatory plan or arrangement |
|
Item 16. Form 10-K Summary
None.
112
SIGNATURES
Pursuant to the requirements of Section 13 or 15(d) of the Securities Exchange Act of 1934, as amended, the Registrant has duly caused this Annual Report to be signed on its behalf by the undersigned, thereunto duly authorized.
|
|
ATLAS ENERGY SOLUTIONS INC. |
|
|
|
|
|
Date: February 27, 2024 |
|
By: |
/s/ John Turner |
|
|
|
John Turner |
|
|
|
President and Chief Financial Officer |
Pursuant to the requirements of the Securities Exchange Act of 1934, as amended, this Annual Report has been signed below by the following persons on behalf of the Registrant in the capacities and on the dates indicated.
Name |
|
Title |
|
Date |
|
|
|
|
|
/s/ Ben M. Brigham |
|
Executive Chairman and Chief Executive Officer (Principal Executive Officer) |
|
February 27, 2024 |
Ben M. Brigham |
|
|
|
|
|
|
|
|
|
/s/ John Turner |
|
President and Chief Financial Officer (Principal Accounting and Financial Officer) |
|
February 27, 2024 |
John Turner |
|
|
|
|
|
|
|
|
|
/s/ Gayle Burleson |
|
Director |
|
February 27, 2024 |
Gayle Burleson |
|
|
|
|
|
|
|
|
|
/s/ Stacy Hock |
|
Director |
|
February 27, 2024 |
Stacy Hock |
|
|
|
|
|
|
|
|
|
/s/ Mike Howard |
|
Director |
|
February 27, 2024 |
Mike Howard |
|
|
|
|
|
|
|
|
|
/s/ A. Lance Langford |
|
Director |
|
February 27, 2024 |
A. Lance Langford |
|
|
|
|
|
|
|
|
|
/s/ Mark P. Mills |
|
Director |
|
February 27, 2024 |
Mark P. Mills |
|
|
|
|
|
|
|
|
|
/s/ Douglas Rogers |
|
Director |
|
February 27, 2024 |
Douglas Rogers |
|
|
|
|
|
|
|
|
|
/s/ Robb L. Voyles |
|
Director |
|
February 27, 2024 |
Robb L. Voyles |
|
|
|
|
113